| Param | Original file | Final file |
|---|---|---|
| Filename | modeM0/AS1P01_010T01_9000000108_00728cztM0_level2.evt | modeM0/AS1P01_010T01_9000000108_00728cztM0_level2_quad_clean.evt |
| Size (bytes) | 1,307,617,920 | 89,357,760 |
| Size | 1.2 GB | 85.2 MB |
| Events in quadrant A | 9,109,829 | 559,863 |
| Events in quadrant B | 9,296,279 | 568,398 |
| Events in quadrant C | 8,671,333 | 557,994 |
| Events in quadrant D | 12,045,783 | 515,049 |
| Mode SS | |||
|---|---|---|---|
| Quadrant | BADHDUFLAG | Total packets | Discarded packets |
| A | 0 | 146 | 0 |
| B | 0 | 146 | 0 |
| C | 0 | 146 | 0 |
| D | 0 | 146 | 0 |
| Mode M0 | |||
|---|---|---|---|
| Quadrant | BADHDUFLAG | Total packets | Discarded packets |
| A | 0 | 32223 | 0 |
| B | 0 | 32798 | 0 |
| C | 0 | 30870 | 3 |
| D | 0 | 40951 | 0 |
| Quadrant | Total seconds | Saturated seconds | Saturation percentage |
|---|---|---|---|
| A | 7241 | 42 | 0.580030% |
| B | 7241 | 44 | 0.607651% |
| C | 7240 | 22 | 0.303867% |
| D | 7240 | 758 | 10.469613% |
Noise dominated data is calculated using 1-second bins in cleaned event files. If a bin has >2000 counts, and if more than 50% of those come from <1% of pixels, then it is considered to be noise-dominated and hence unusable.
| Quadrant | # 1 sec bins | Bins with >0 counts | Bins with >2000 counts | High rate bins dominated by noise | Noise dominated (total time) | Noise dominated (detector-on time) | Marked lightcurve |
|---|---|---|---|---|---|---|---|
| A | 7241 | 7241 | 439 | 439 | 6.06% | 6.06% | 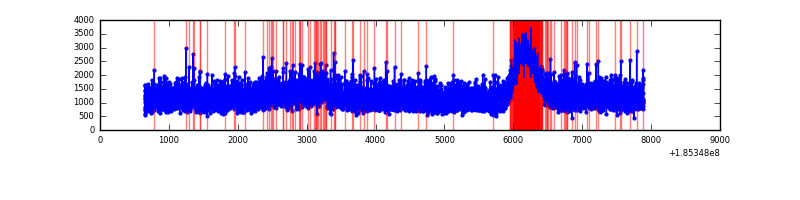 |
| B | 7241 | 7241 | 480 | 480 | 6.63% | 6.63% | 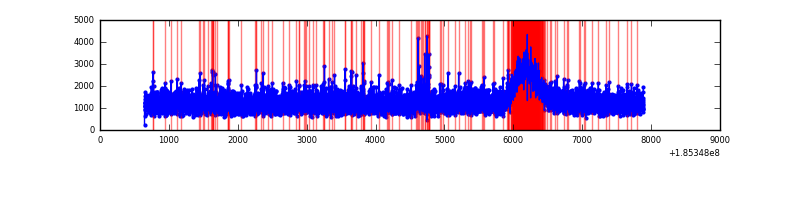 |
| C | 7240 | 7240 | 402 | 402 | 5.55% | 5.55% | 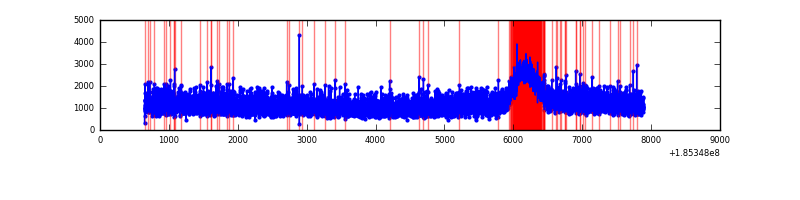 |
| D | 7240 | 7240 | 1966 | 1966 | 27.15% | 27.15% | 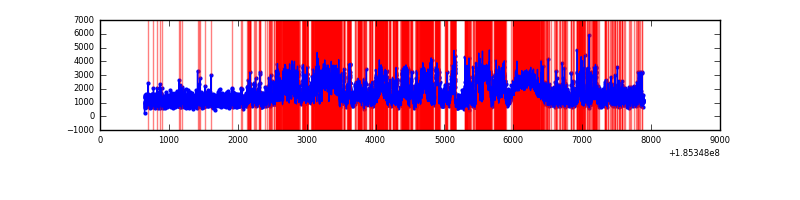 |
Top three noisy pixels from each quadrant. If the there are fewer than three noisy pixels in the level2.evt file, extra rows are filled as -1
| Pixel properties | Quadrant properties | ||||||
|---|---|---|---|---|---|---|---|
| Quadrant | DetID | PixID | Counts | Sigma | Mean | Median | Sigma |
| A | 10 | 230 | 255125 | 452.98 | 2297 | 2314 | 558.1 |
| A | 12 | 189 | 18731 | 29.41 | 2297 | 2314 | 558.1 |
| A | 14 | 79 | 13952 | 20.85 | 2297 | 2314 | 558.1 |
| B | 5 | 249 | 58234 | 97.43 | 2395 | 2398 | 573.1 |
| B | 0 | 220 | 25792 | 40.82 | 2395 | 2398 | 573.1 |
| B | 15 | 185 | 25604 | 40.49 | 2395 | 2398 | 573.1 |
| C | 15 | 241 | 41671 | 64.06 | 2187 | 2267 | 615.1 |
| C | 3 | 111 | 36682 | 55.95 | 2187 | 2267 | 615.1 |
| C | 9 | 52 | 27627 | 41.23 | 2187 | 2267 | 615.1 |
| D | 9 | 52 | 3589854 | 5529.63 | 2073 | 2146 | 648.8 |
| D | 6 | 226 | 307081 | 469.99 | 2073 | 2146 | 648.8 |
| D | 7 | 207 | 296125 | 453.1 | 2073 | 2146 | 648.8 |
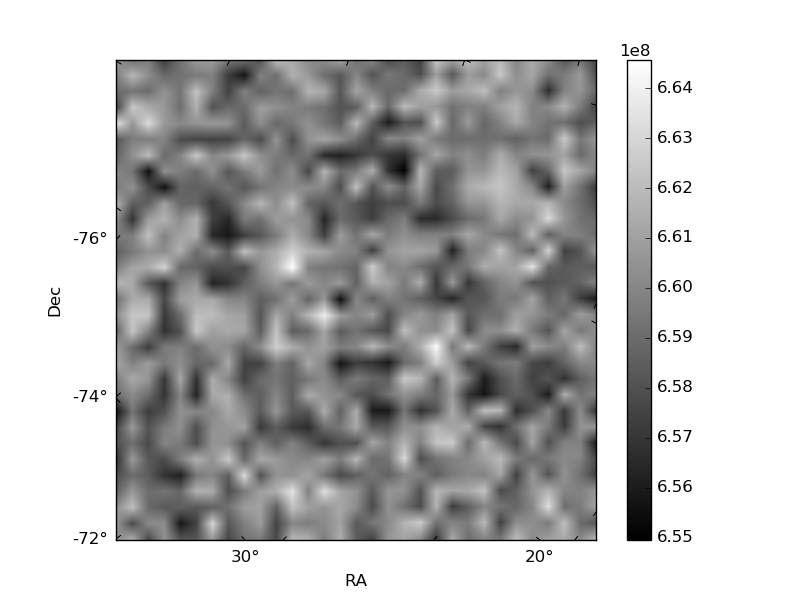
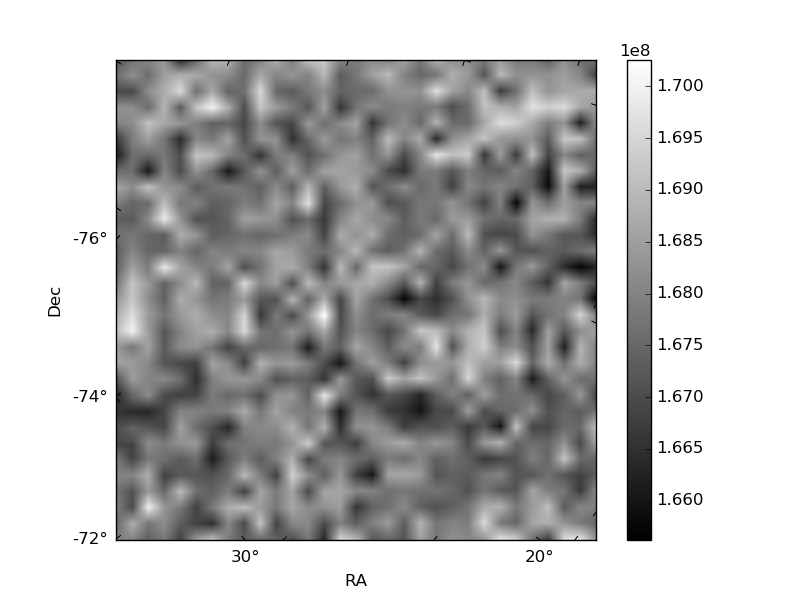
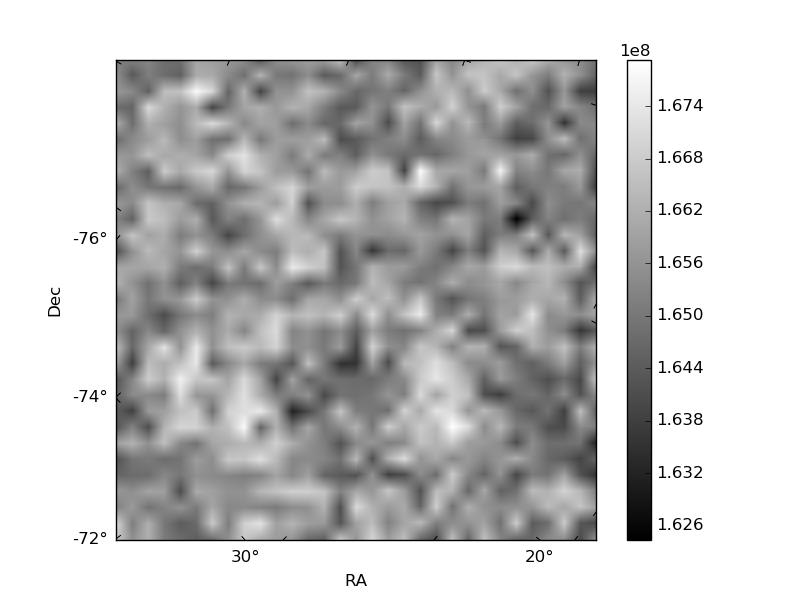
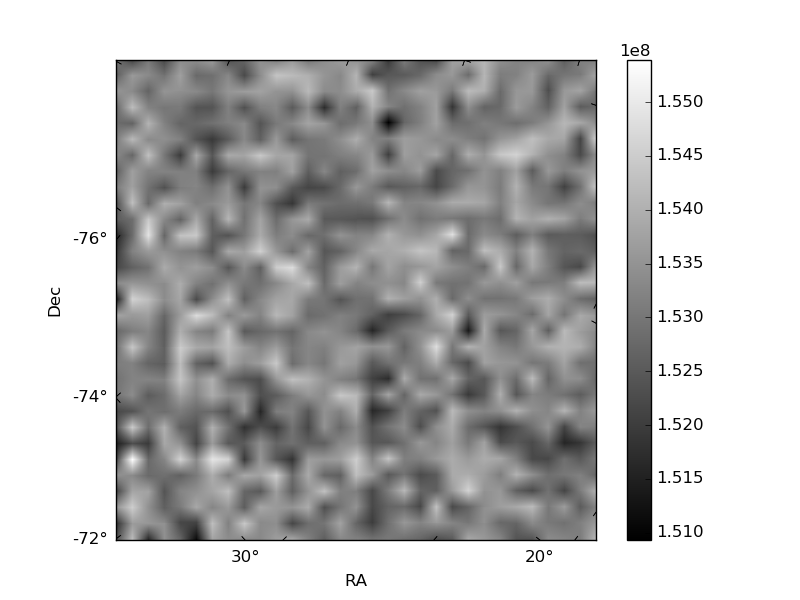
Histogram calculated using DETX and DETY for each event in the final _common_clean file
| Quadrant A | 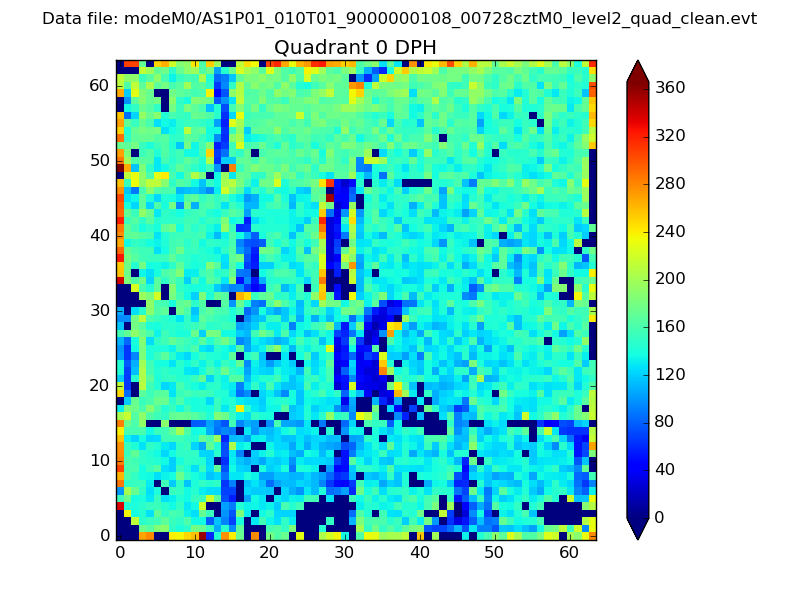 |
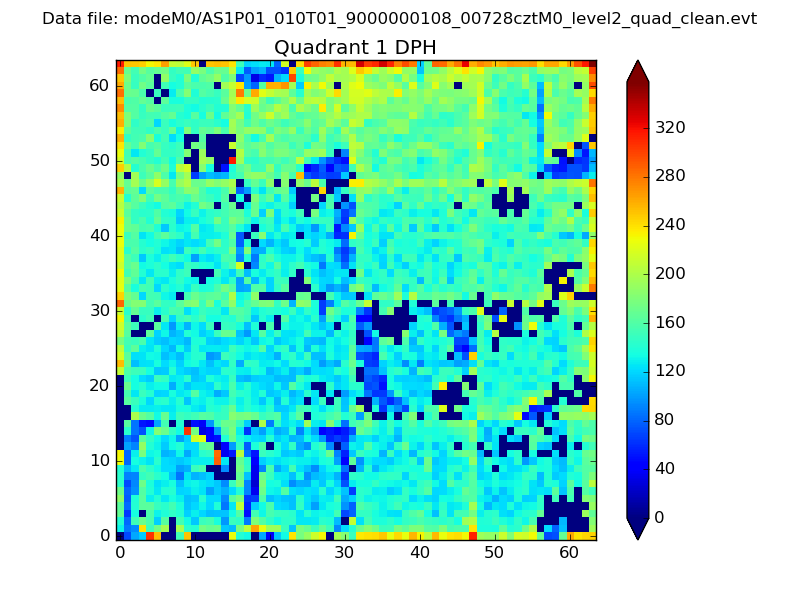 |
Quadrant B |
|---|---|---|---|
| Quadrant D | 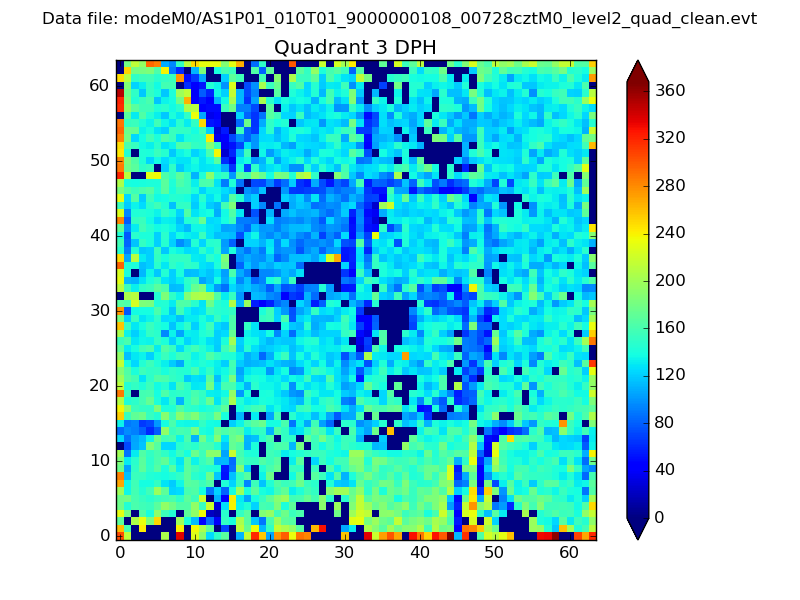 |
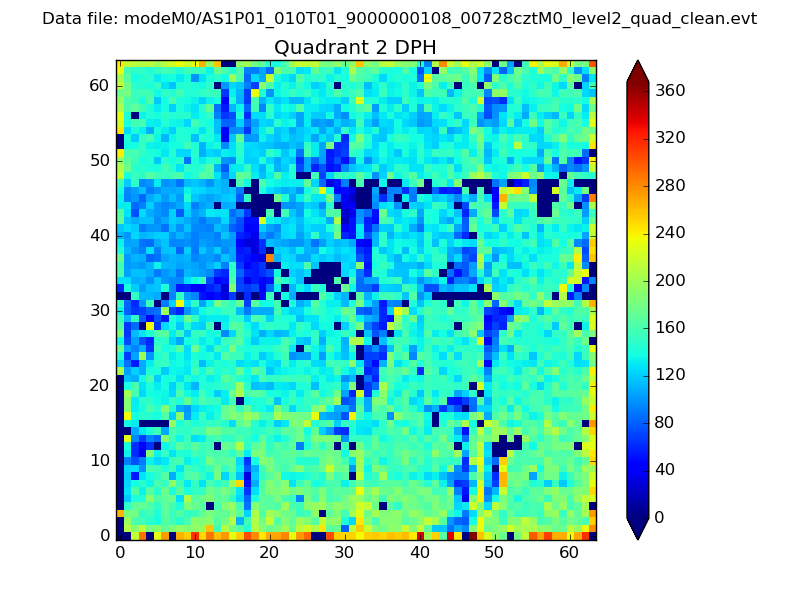 |
Quadrant C |
| Plot type | Count rate plots | Images |
|---|---|---|
| Comparison with Poisson distribution Blue bars denote a histogram of data divided into 1 sec bins. Red curve is a Poisson curve with rate = median count rate of data. |
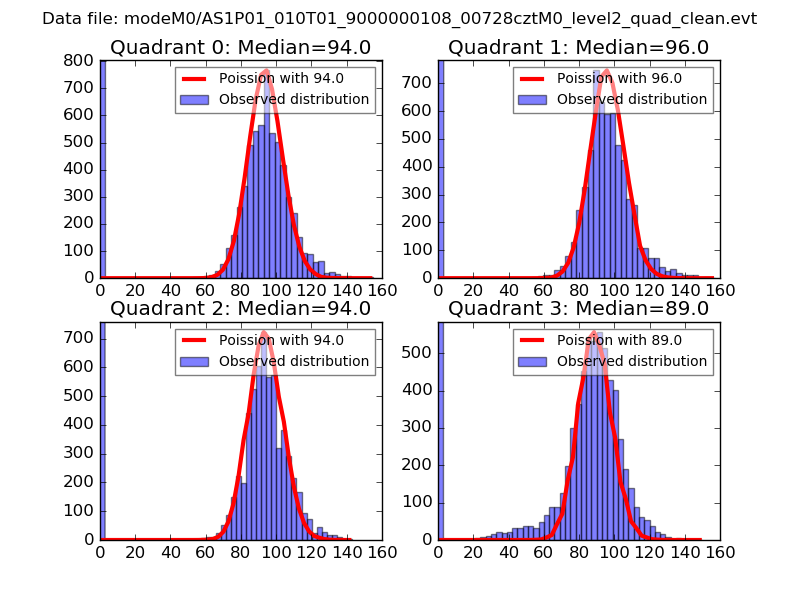 |
 |
| Quadrant-wise count rates Data is divided into 100 sec bins |
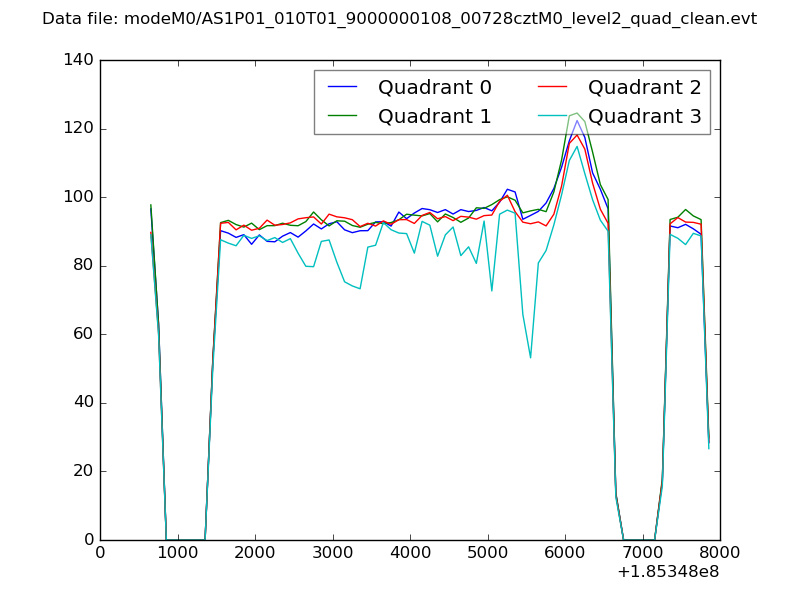 |
|
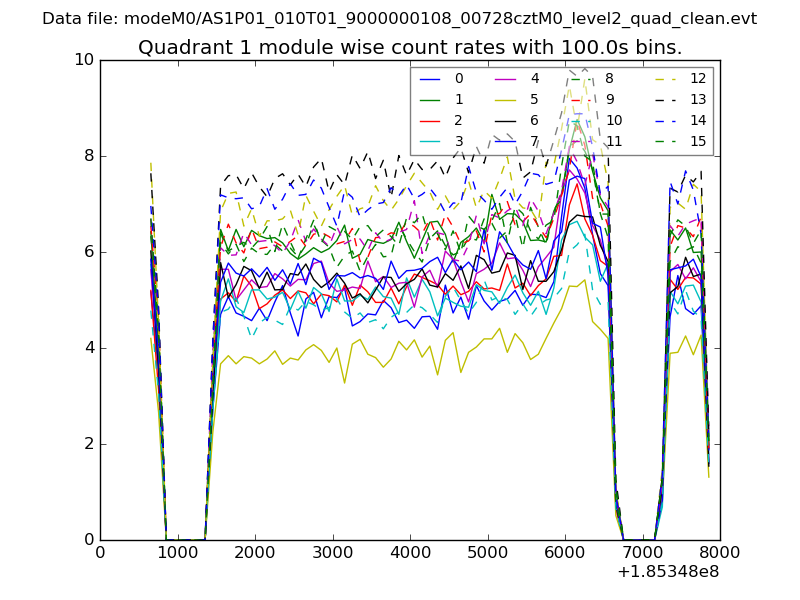
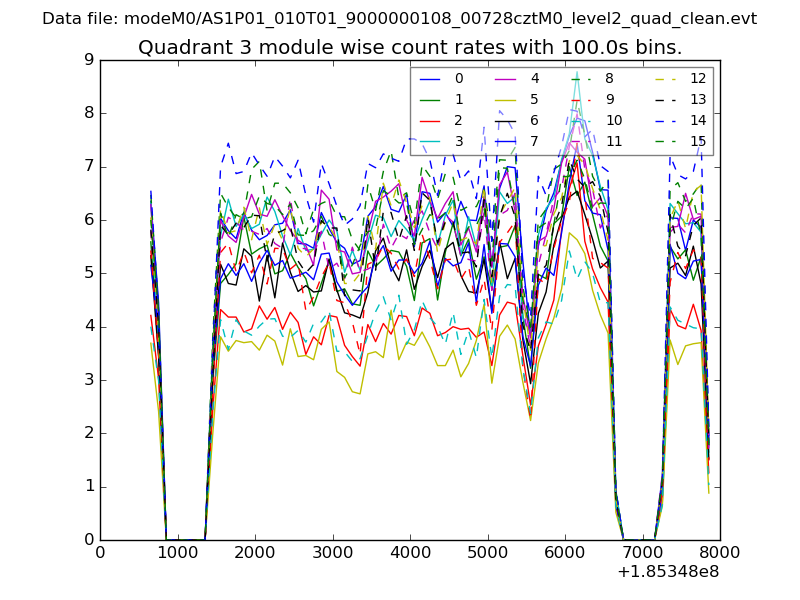
| Module-wise count rates for Quadrant A Data is divided into 100 sec bins |
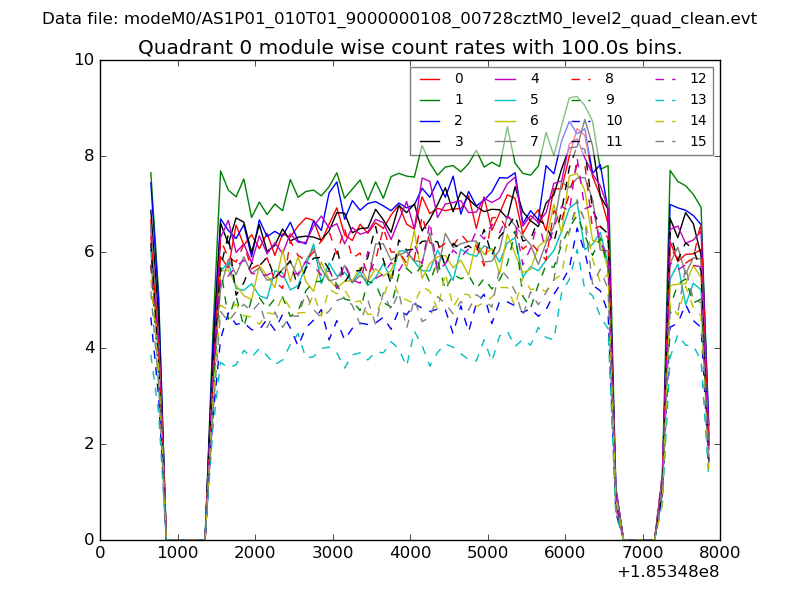 |
 |
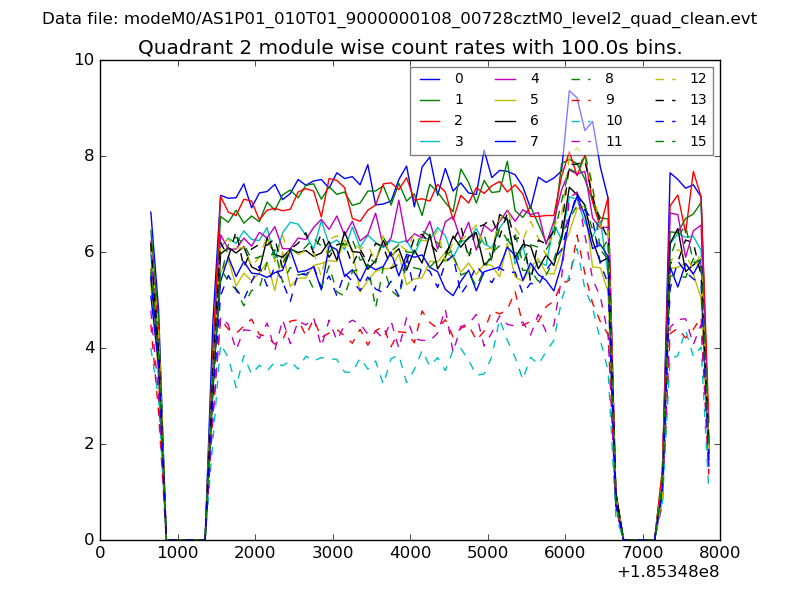
| Module-wise count rates for Quadrant B Data is divided into 100 sec bins |
 |
 |
| Module-wise count rates for Quadrant C Data is divided into 100 sec bins |
 |
 |
| Module-wise count rates for Quadrant D Data is divided into 100 sec bins |
 |
 |
| Parameter | Plot |
|---|---|
| CZT HV Monitor | 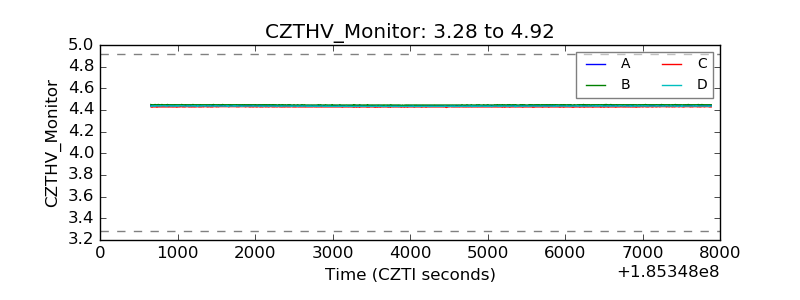 |
| D_VDD | 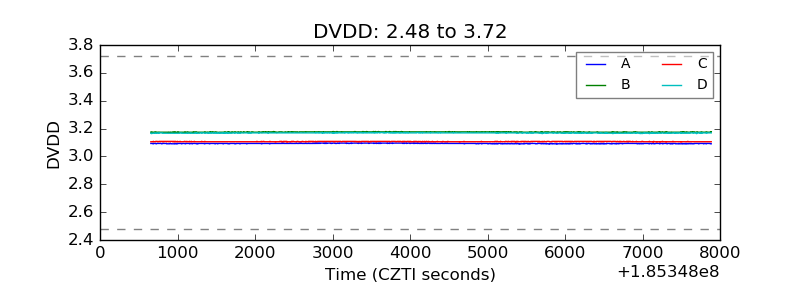 |
| Temperature 1 | 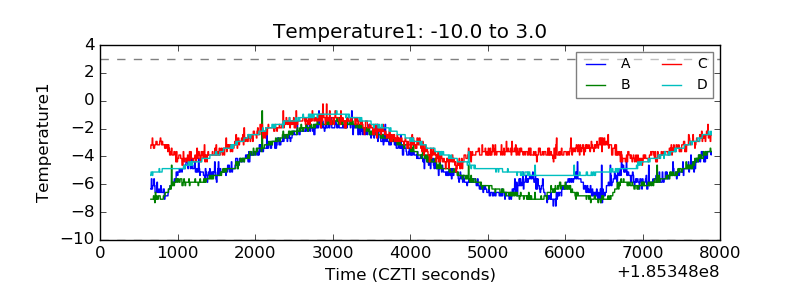 |
| Veto HV Monitor | 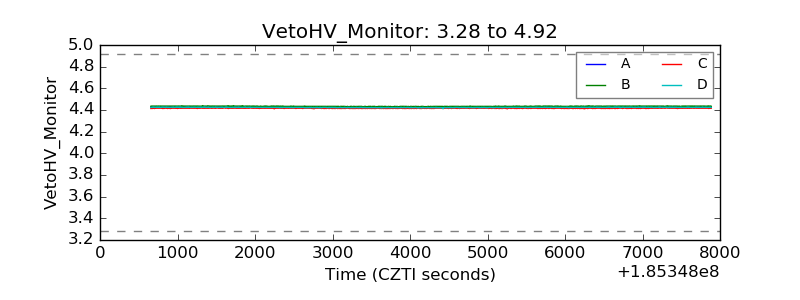 |
| Veto LLD | 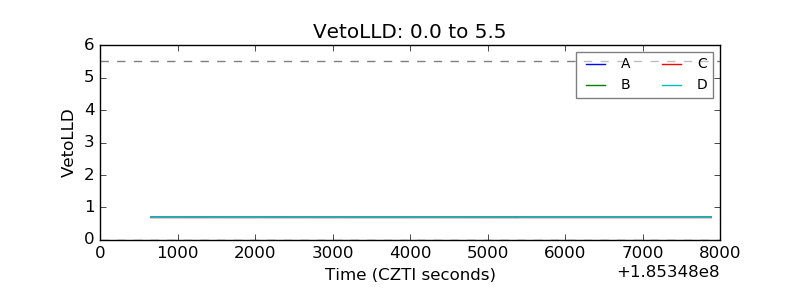 |
| Alpha Counter | 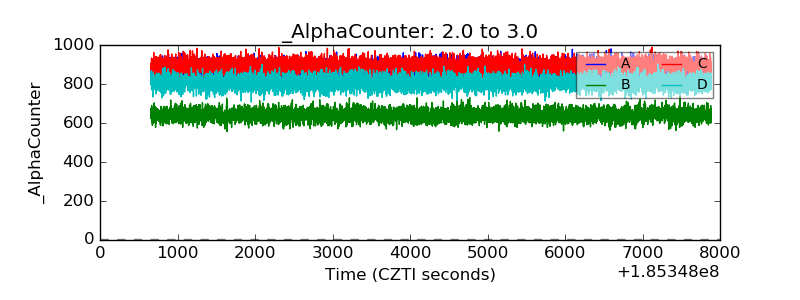 |
| _CPM_Rate | 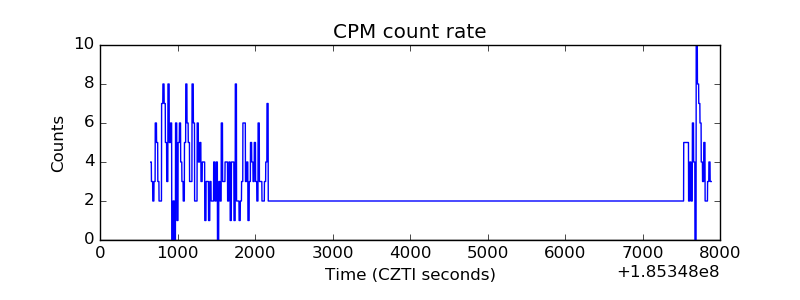 |
| CZT Counter | 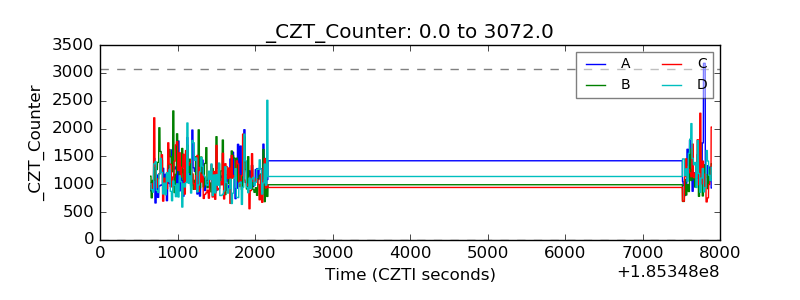 |
| +2.5 Volts monitor |  |
| +5 Volts monitor |  |
| _ROLL_ROT | 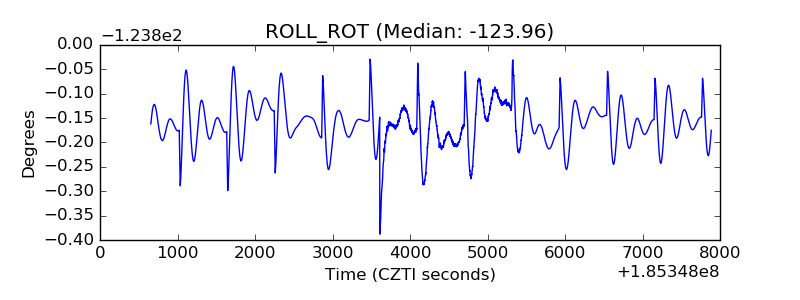 |
| _Roll_DEC | 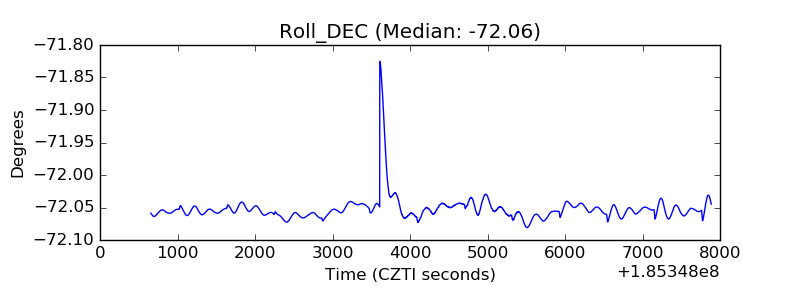 |
| _Roll_RA | 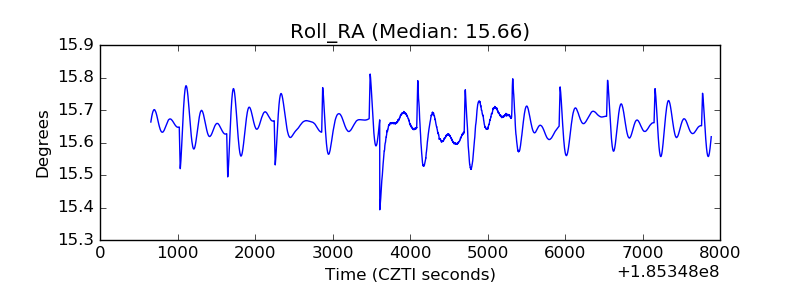 |
| Veto Counter | 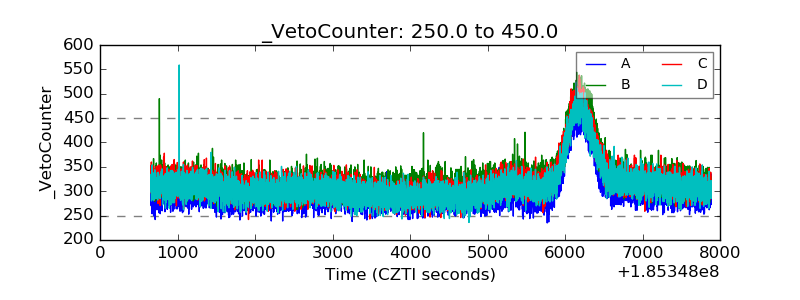 |