| Param | Original file | Final file |
|---|---|---|
| Filename | modeM0/AS1P01_010T01_9000000108_00731cztM0_level2.evt | modeM0/AS1P01_010T01_9000000108_00731cztM0_level2_quad_clean.evt |
| Size (bytes) | 904,824,000 | 71,317,440 |
| Size | 862.9 MB | 68.0 MB |
| Events in quadrant A | 5,791,555 | 464,283 |
| Events in quadrant B | 6,198,956 | 465,631 |
| Events in quadrant C | 5,607,456 | 461,217 |
| Events in quadrant D | 9,468,886 | 412,874 |
| Mode SS | |||
|---|---|---|---|
| Quadrant | BADHDUFLAG | Total packets | Discarded packets |
| A | 0 | 100 | 0 |
| B | 0 | 100 | 0 |
| C | 0 | 100 | 0 |
| D | 0 | 100 | 0 |
| Mode M0 | |||
|---|---|---|---|
| Quadrant | BADHDUFLAG | Total packets | Discarded packets |
| A | 0 | 20787 | 0 |
| B | 0 | 22021 | 0 |
| C | 0 | 20280 | 0 |
| D | 0 | 31768 | 0 |
| Quadrant | Total seconds | Saturated seconds | Saturation percentage |
|---|---|---|---|
| A | 5072 | 22 | 0.433754% |
| B | 5073 | 27 | 0.532229% |
| C | 5073 | 13 | 0.256259% |
| D | 5073 | 570 | 11.235955% |
Noise dominated data is calculated using 1-second bins in cleaned event files. If a bin has >2000 counts, and if more than 50% of those come from <1% of pixels, then it is considered to be noise-dominated and hence unusable.
| Quadrant | # 1 sec bins | Bins with >0 counts | Bins with >2000 counts | High rate bins dominated by noise | Noise dominated (total time) | Noise dominated (detector-on time) | Marked lightcurve |
|---|---|---|---|---|---|---|---|
| A | 5072 | 5072 | 72 | 72 | 1.42% | 1.42% | 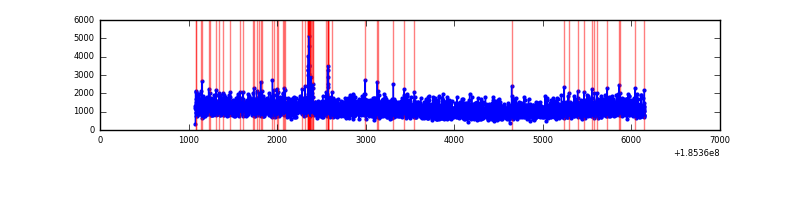 |
| B | 5073 | 5073 | 143 | 143 | 2.82% | 2.82% | 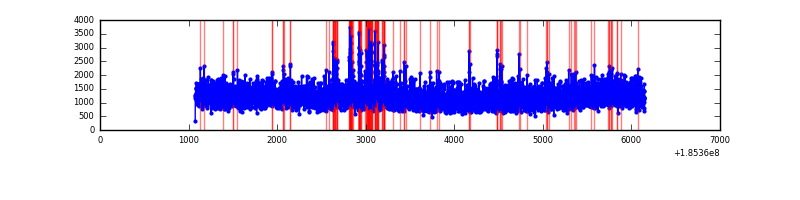 |
| C | 5073 | 5073 | 57 | 57 | 1.12% | 1.12% | 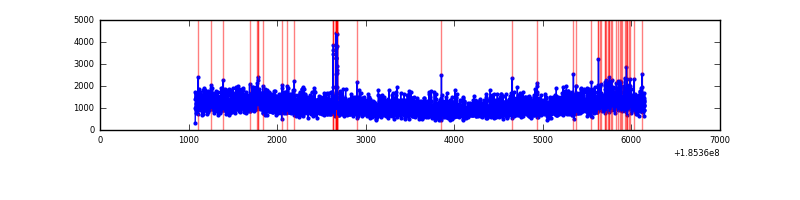 |
| D | 5073 | 5073 | 1641 | 1641 | 32.35% | 32.35% | 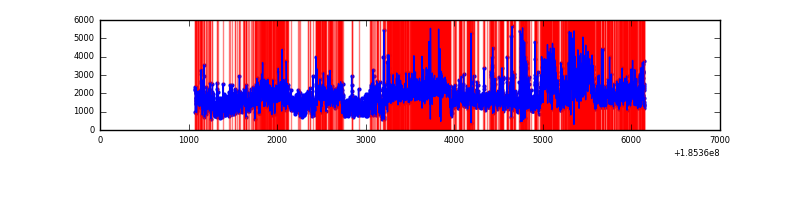 |
Top three noisy pixels from each quadrant. If the there are fewer than three noisy pixels in the level2.evt file, extra rows are filled as -1
| Pixel properties | Quadrant properties | ||||||
|---|---|---|---|---|---|---|---|
| Quadrant | DetID | PixID | Counts | Sigma | Mean | Median | Sigma |
| A | 15 | 171 | 87701 | 239.92 | 1481 | 1494 | 359.3 |
| A | 15 | 17 | 12606 | 30.93 | 1481 | 1494 | 359.3 |
| A | 12 | 189 | 12154 | 29.67 | 1481 | 1494 | 359.3 |
| B | 14 | 51 | 170991 | 462.51 | 1547 | 1553 | 366.3 |
| B | 15 | 185 | 41134 | 108.04 | 1547 | 1553 | 366.3 |
| B | 5 | 191 | 37063 | 96.93 | 1547 | 1553 | 366.3 |
| C | 9 | 52 | 86230 | 218.59 | 1390 | 1434 | 387.9 |
| C | 15 | 241 | 31883 | 78.49 | 1390 | 1434 | 387.9 |
| C | 3 | 111 | 30257 | 74.3 | 1390 | 1434 | 387.9 |
| D | 12 | 22 | 2452112 | 6153.41 | 1279 | 1323 | 398.3 |
| D | 9 | 52 | 1367753 | 3430.82 | 1279 | 1323 | 398.3 |
| D | 6 | 226 | 650570 | 1630.12 | 1279 | 1323 | 398.3 |
Histogram calculated using DETX and DETY for each event in the final _common_clean file
| Quadrant A | 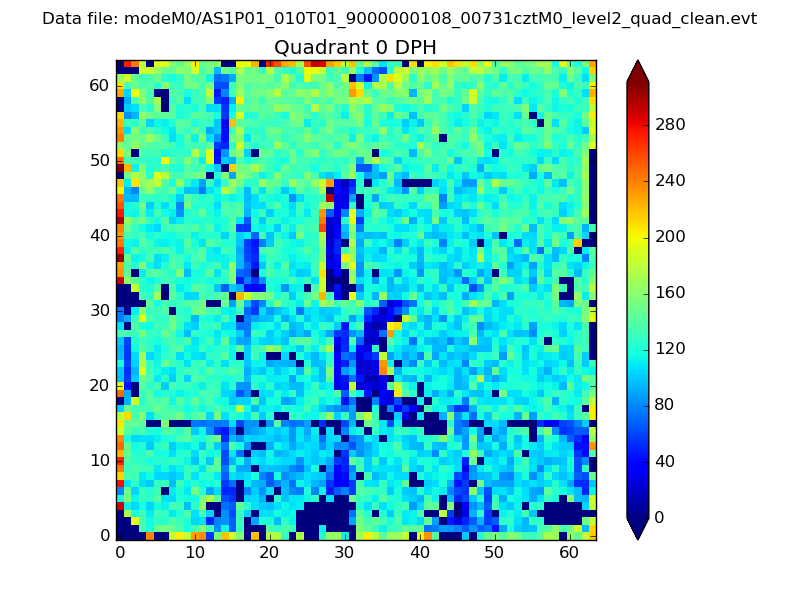 |
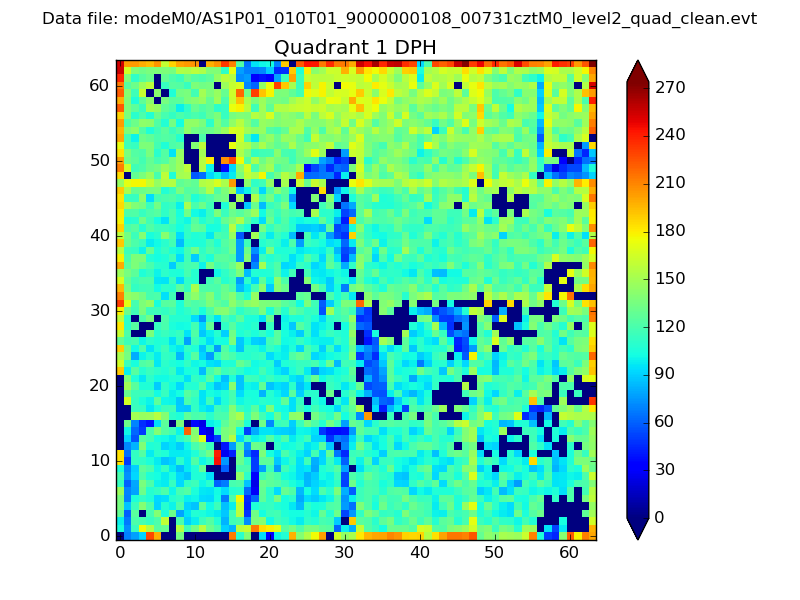 |
Quadrant B |
|---|---|---|---|
| Quadrant D |  |
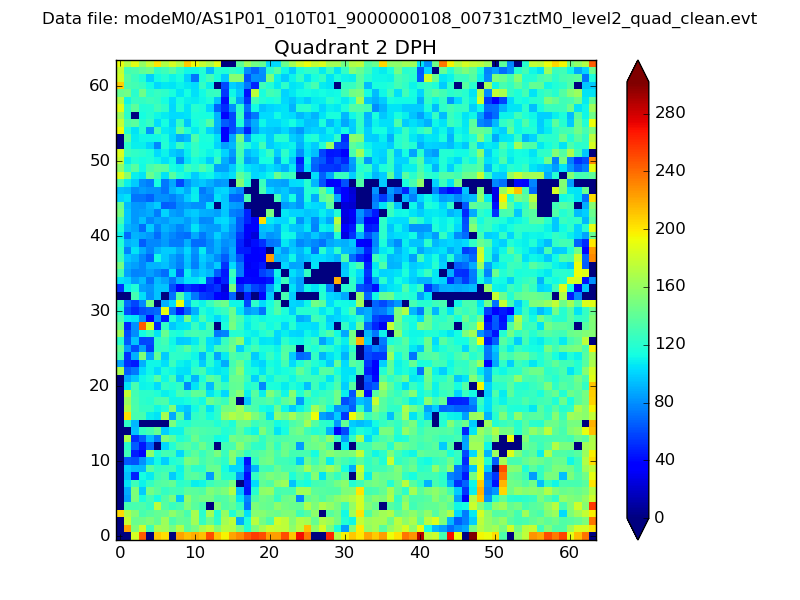 |
Quadrant C |
| Plot type | Count rate plots | Images |
|---|---|---|
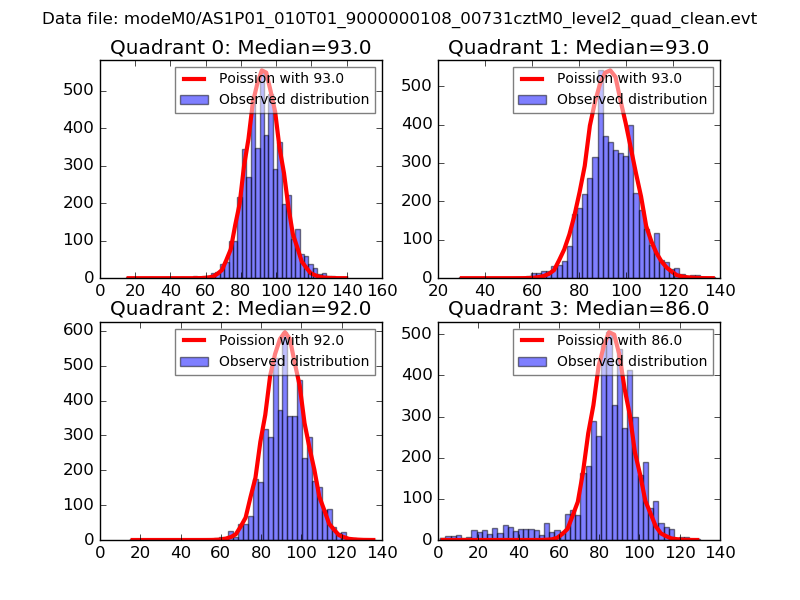
| Comparison with Poisson distribution Blue bars denote a histogram of data divided into 1 sec bins. Red curve is a Poisson curve with rate = median count rate of data. |
 |
 |
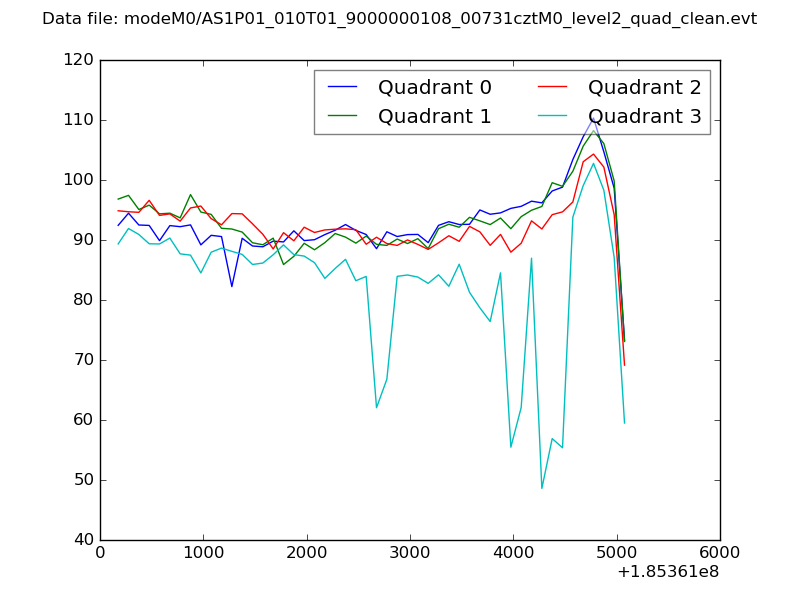
| Quadrant-wise count rates Data is divided into 100 sec bins |
 |
|
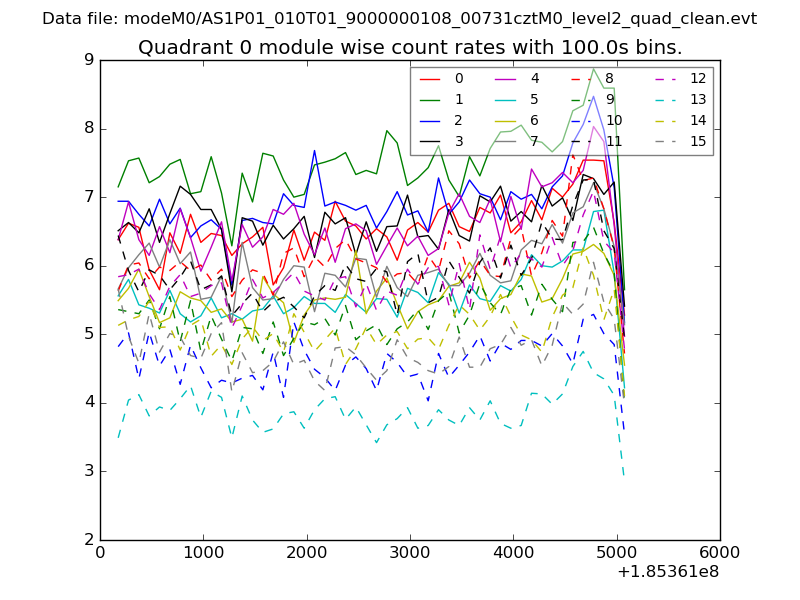
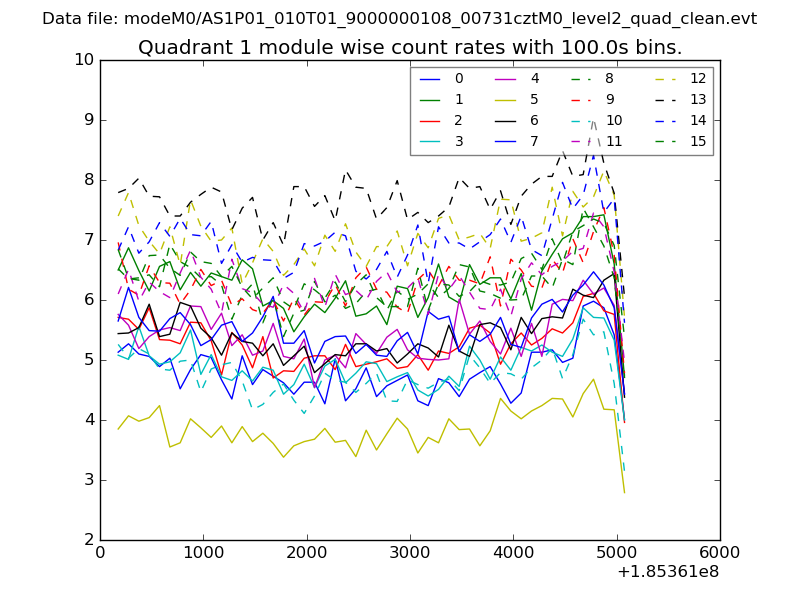
| Module-wise count rates for Quadrant A Data is divided into 100 sec bins |
 |
 |
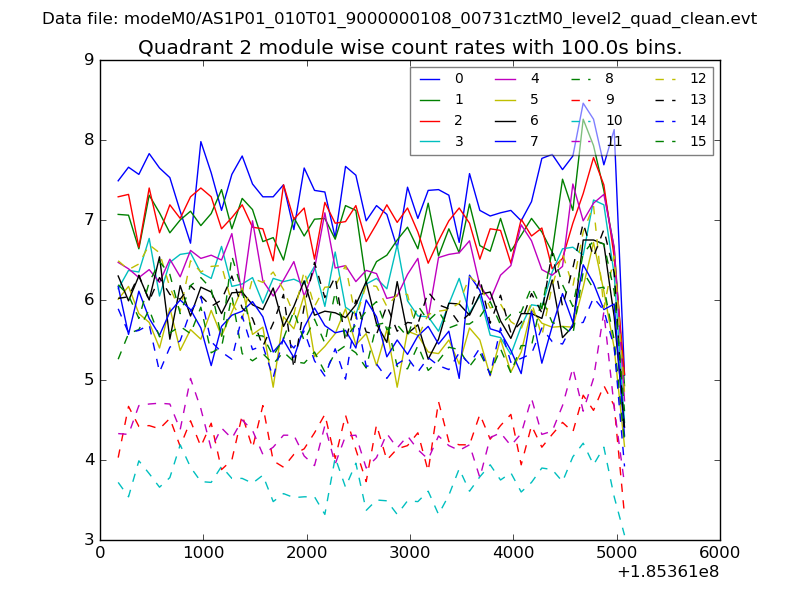
| Module-wise count rates for Quadrant B Data is divided into 100 sec bins |
 |
 |
| Module-wise count rates for Quadrant C Data is divided into 100 sec bins |
 |
 |
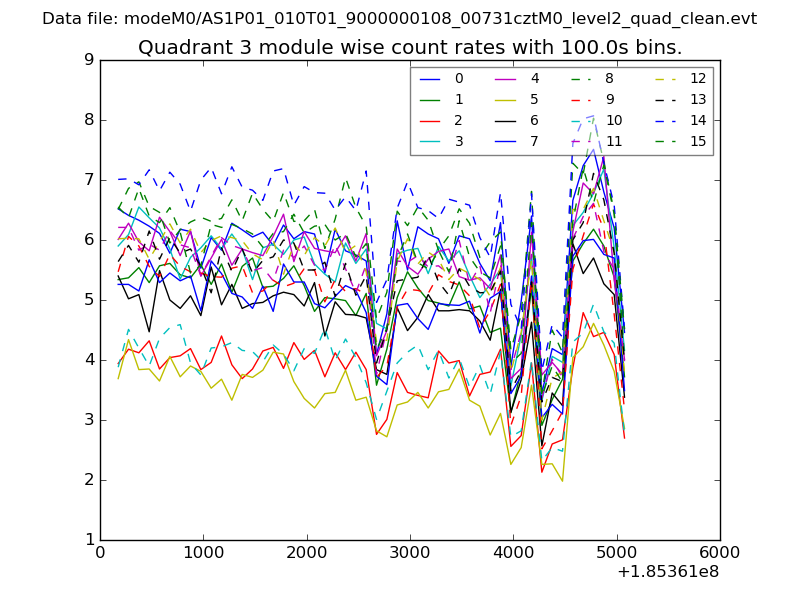
| Module-wise count rates for Quadrant D Data is divided into 100 sec bins |
 |
 |
| Parameter | Plot |
|---|---|
| CZT HV Monitor | 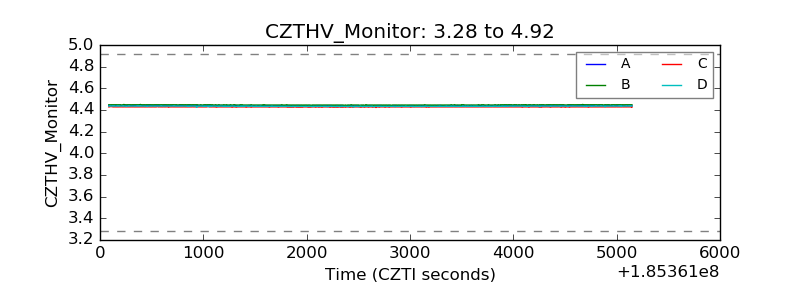 |
| D_VDD | 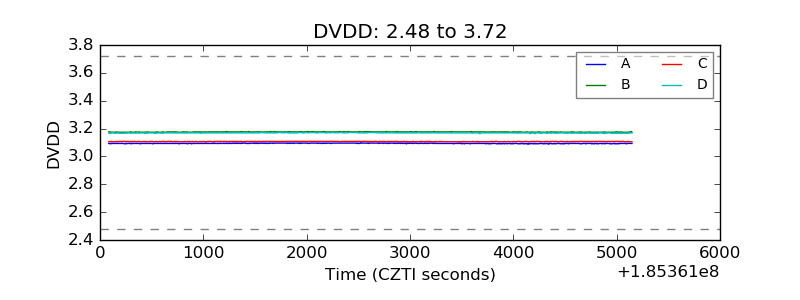 |
| Temperature 1 | 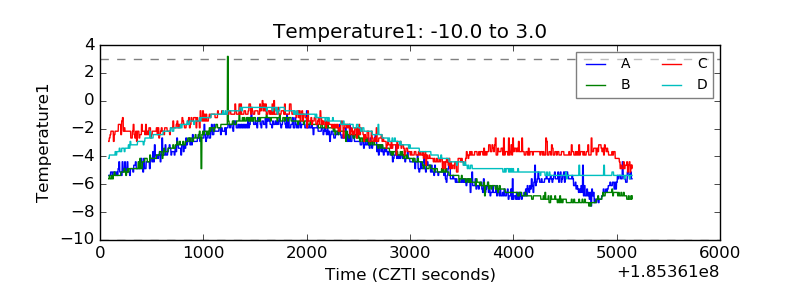 |
| Veto HV Monitor | 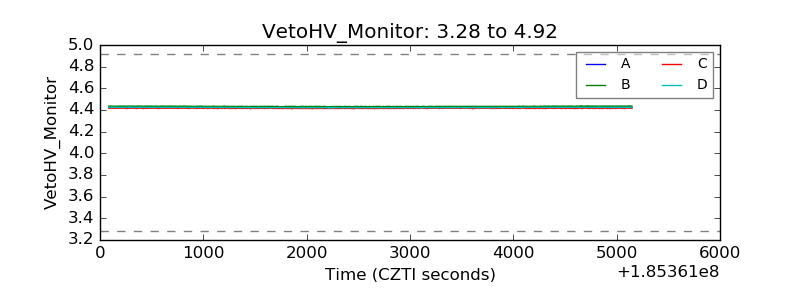 |
| Veto LLD | 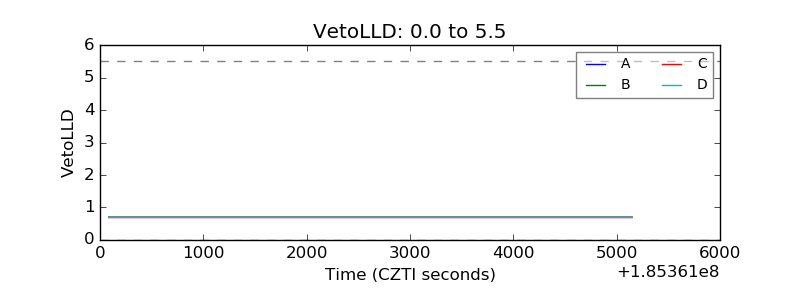 |
| Alpha Counter | 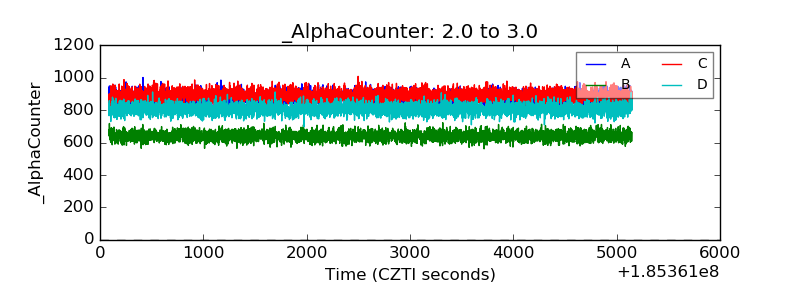 |
| _CPM_Rate | 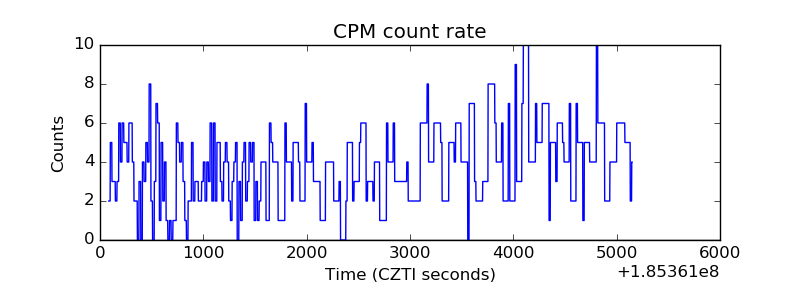 |
| CZT Counter | 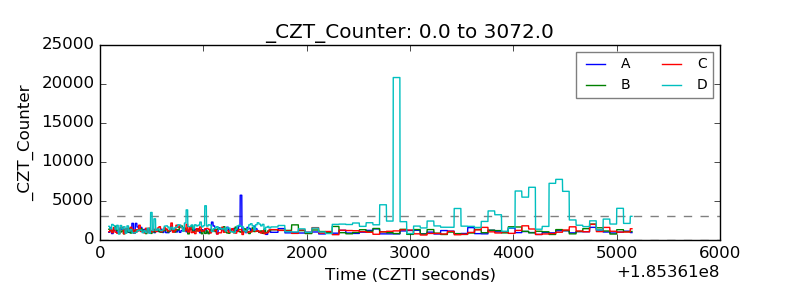 |
| +2.5 Volts monitor |  |
| +5 Volts monitor | 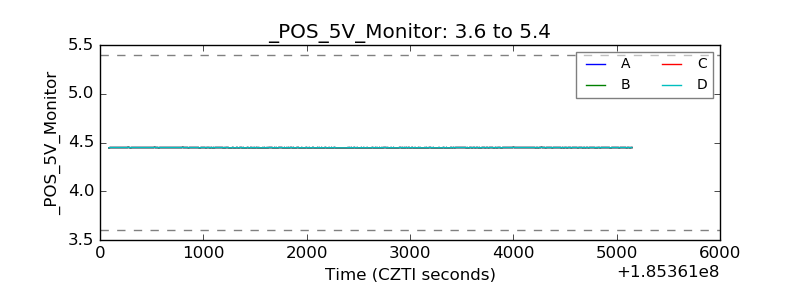 |
| _ROLL_ROT | 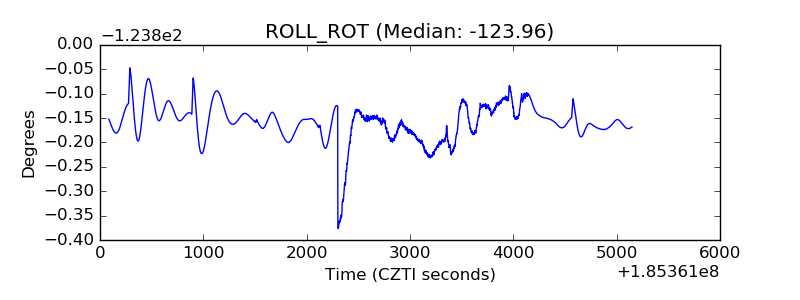 |
| _Roll_DEC | 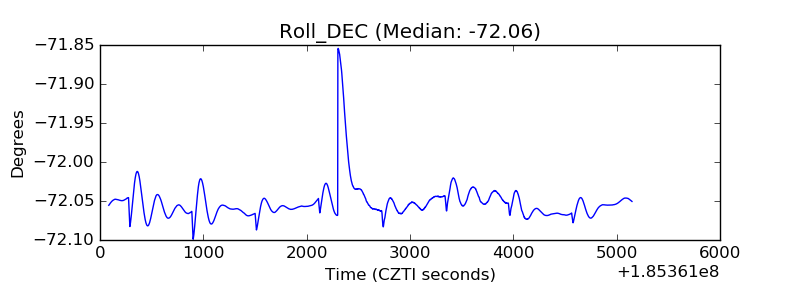 |
| _Roll_RA | 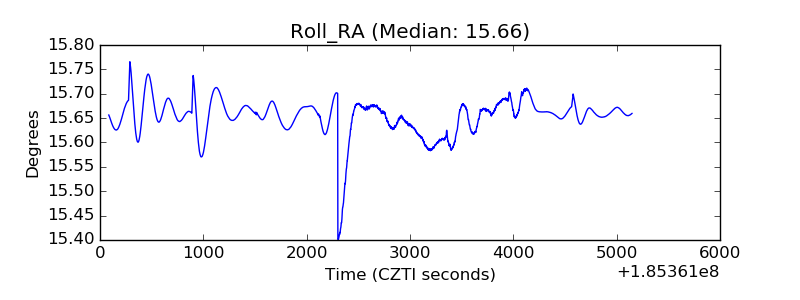 |
| Veto Counter | 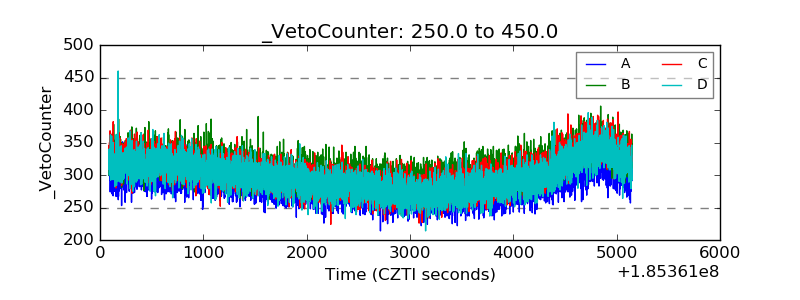 |