| Param | Original file | Final file |
|---|---|---|
| Filename | modeM0/AS1P01_010T01_9000000108_00733cztM0_level2.evt | modeM0/AS1P01_010T01_9000000108_00733cztM0_level2_quad_clean.evt |
| Size (bytes) | 1,127,977,920 | 82,748,160 |
| Size | 1.1 GB | 78.9 MB |
| Events in quadrant A | 7,167,763 | 548,931 |
| Events in quadrant B | 9,003,586 | 511,787 |
| Events in quadrant C | 6,838,030 | 534,126 |
| Events in quadrant D | 10,743,365 | 479,569 |
| Mode SS | |||
|---|---|---|---|
| Quadrant | BADHDUFLAG | Total packets | Discarded packets |
| A | 0 | 124 | 0 |
| B | 0 | 124 | 0 |
| C | 0 | 124 | 0 |
| D | 0 | 124 | 0 |
| Mode M0 | |||
|---|---|---|---|
| Quadrant | BADHDUFLAG | Total packets | Discarded packets |
| A | 0 | 25671 | 1 |
| B | 0 | 31209 | 1 |
| C | 0 | 24709 | 1 |
| D | 0 | 36439 | 5 |
| Mode M9 | |||
|---|---|---|---|
| Quadrant | BADHDUFLAG | Total packets | Discarded packets |
| A | 0 | 10 | 0 |
| B | 0 | 10 | 0 |
| C | 0 | 10 | 0 |
| D | 0 | 10 | 0 |
| Quadrant | Total seconds | Saturated seconds | Saturation percentage |
|---|---|---|---|
| A | 6171 | 17 | 0.275482% |
| B | 6171 | 586 | 9.496030% |
| C | 6172 | 11 | 0.178224% |
| D | 6171 | 1094 | 17.728083% |
Noise dominated data is calculated using 1-second bins in cleaned event files. If a bin has >2000 counts, and if more than 50% of those come from <1% of pixels, then it is considered to be noise-dominated and hence unusable.
| Quadrant | # 1 sec bins | Bins with >0 counts | Bins with >2000 counts | High rate bins dominated by noise | Noise dominated (total time) | Noise dominated (detector-on time) | Marked lightcurve |
|---|---|---|---|---|---|---|---|
| A | 7146 | 6172 | 156 | 156 | 2.18% | 2.53% |  |
| B | 7146 | 6172 | 889 | 889 | 12.44% | 14.40% |  |
| C | 7147 | 6173 | 114 | 114 | 1.60% | 1.85% | 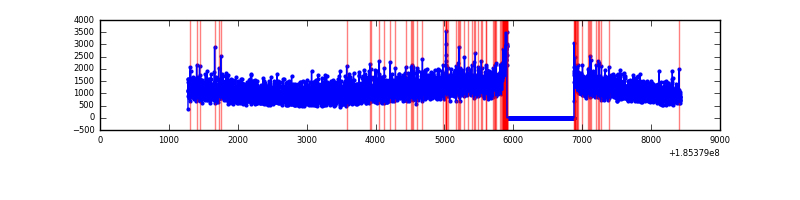 |
| D | 7146 | 6172 | 2030 | 2030 | 28.41% | 32.89% | 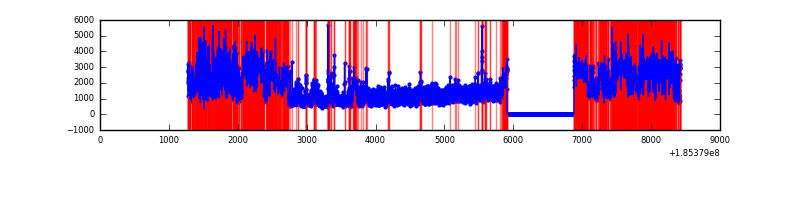 |
Top three noisy pixels from each quadrant. If the there are fewer than three noisy pixels in the level2.evt file, extra rows are filled as -1
| Pixel properties | Quadrant properties | ||||||
|---|---|---|---|---|---|---|---|
| Quadrant | DetID | PixID | Counts | Sigma | Mean | Median | Sigma |
| A | 13 | 34 | 36921 | 78.15 | 1856 | 1865 | 448.6 |
| A | 11 | 79 | 8710 | 15.26 | 1856 | 1865 | 448.6 |
| A | 3 | 111 | 5390 | 7.86 | 1856 | 1865 | 448.6 |
| B | 8 | 38 | 1556044 | 3517.05 | 1865 | 1874 | 441.9 |
| B | 7 | 221 | 295861 | 665.28 | 1865 | 1874 | 441.9 |
| B | 5 | 191 | 31626 | 67.33 | 1865 | 1874 | 441.9 |
| C | 15 | 241 | 37421 | 74.67 | 1719 | 1780 | 477.3 |
| C | 3 | 111 | 30225 | 59.59 | 1719 | 1780 | 477.3 |
| C | 9 | 52 | 26521 | 51.83 | 1719 | 1780 | 477.3 |
| D | 13 | 25 | 2249114 | 4602.26 | 1582 | 1633 | 488.3 |
| D | 9 | 52 | 1372316 | 2806.8 | 1582 | 1633 | 488.3 |
| D | 12 | 233 | 382734 | 780.4 | 1582 | 1633 | 488.3 |
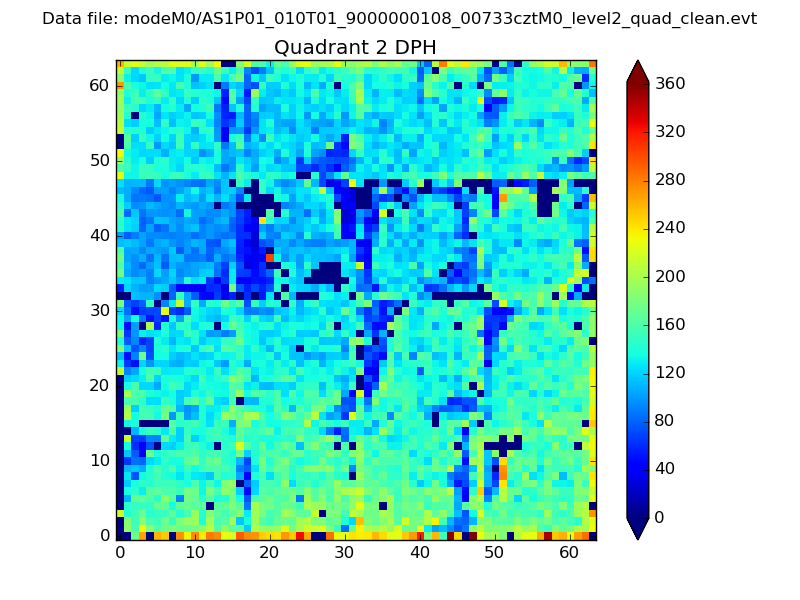
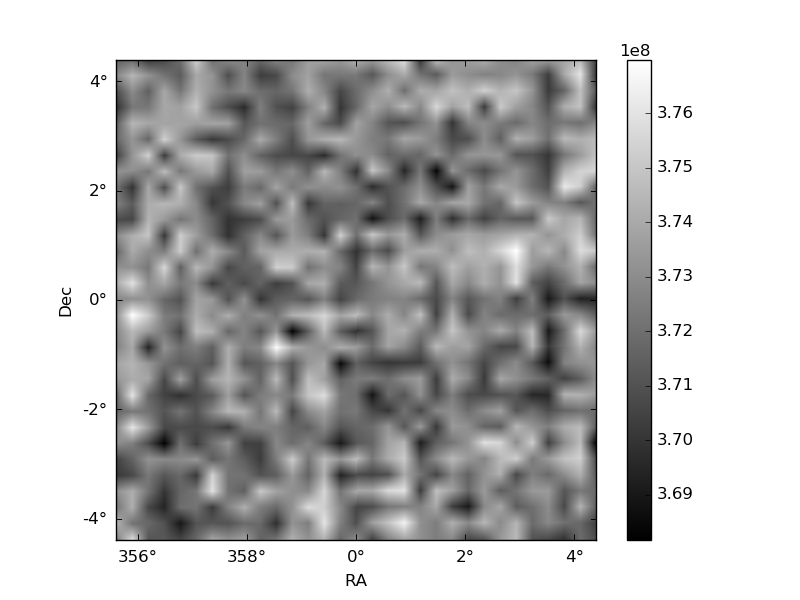
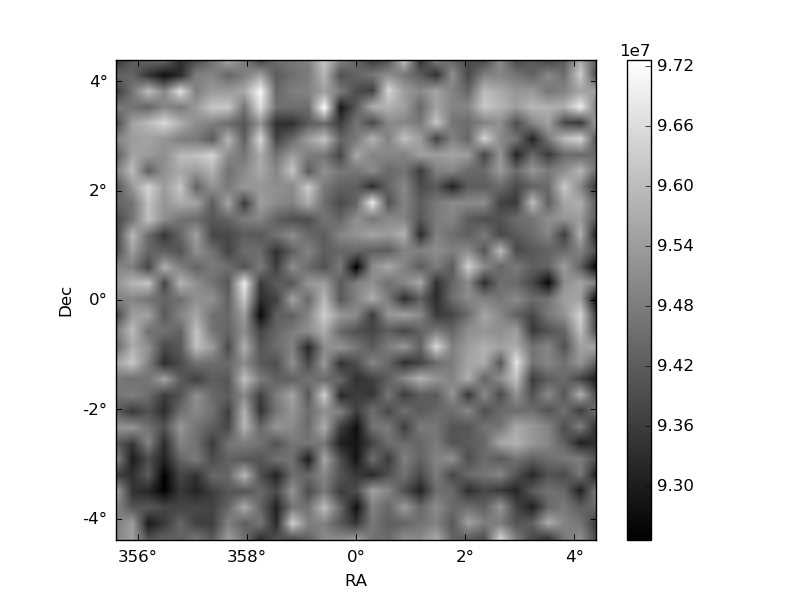
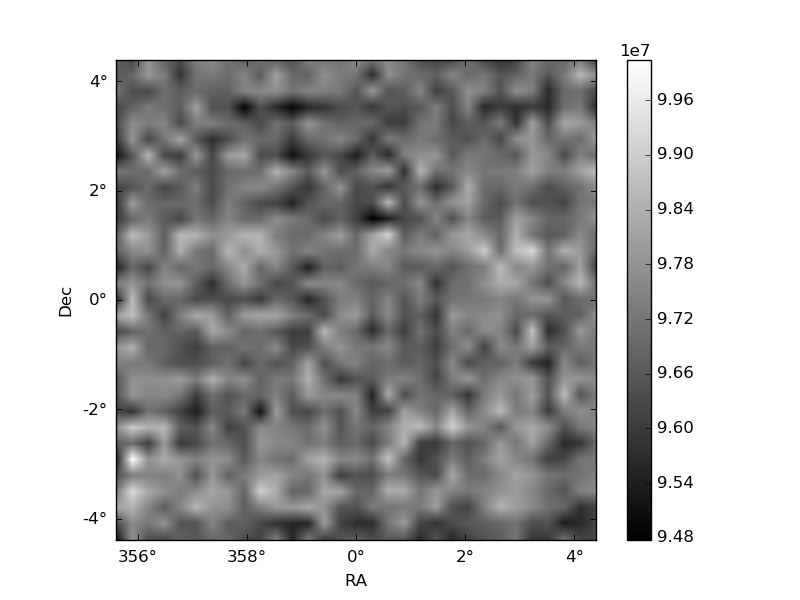
Histogram calculated using DETX and DETY for each event in the final _common_clean file
| Quadrant A |  |
 |
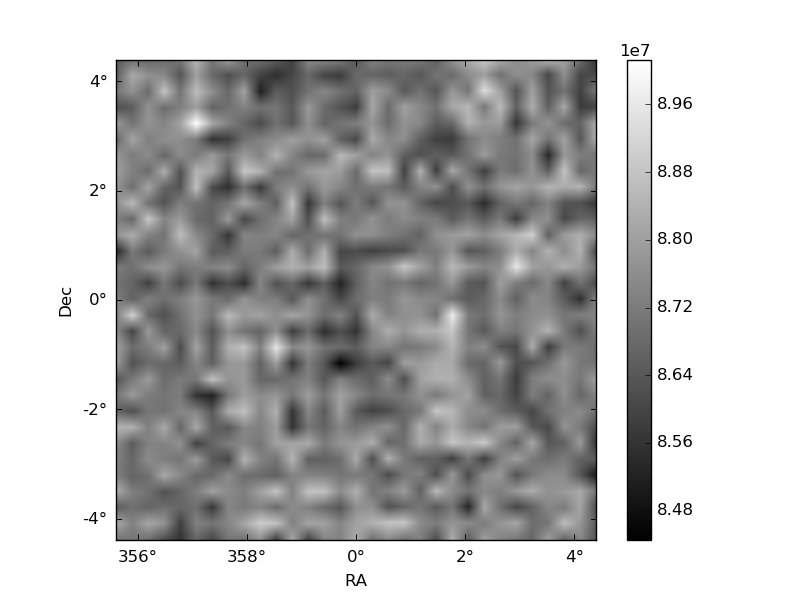
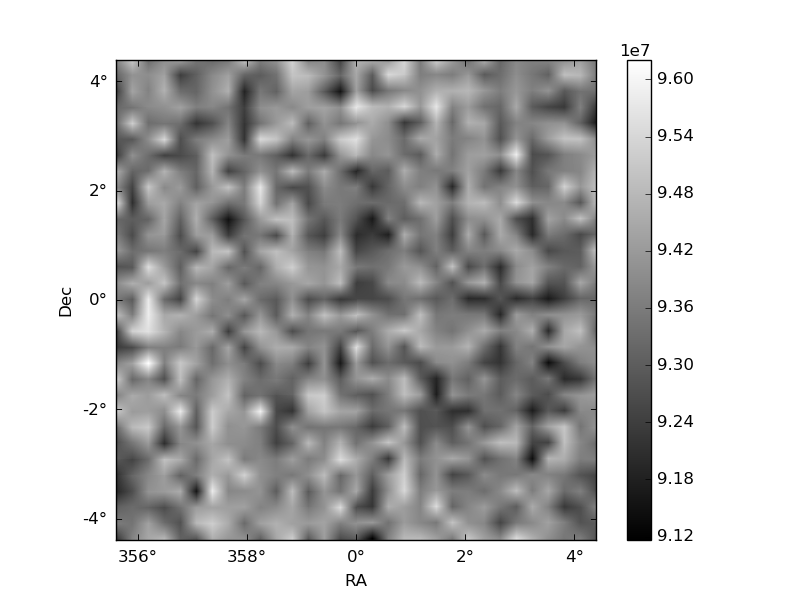
Quadrant B |
|---|---|---|---|
| Quadrant D | 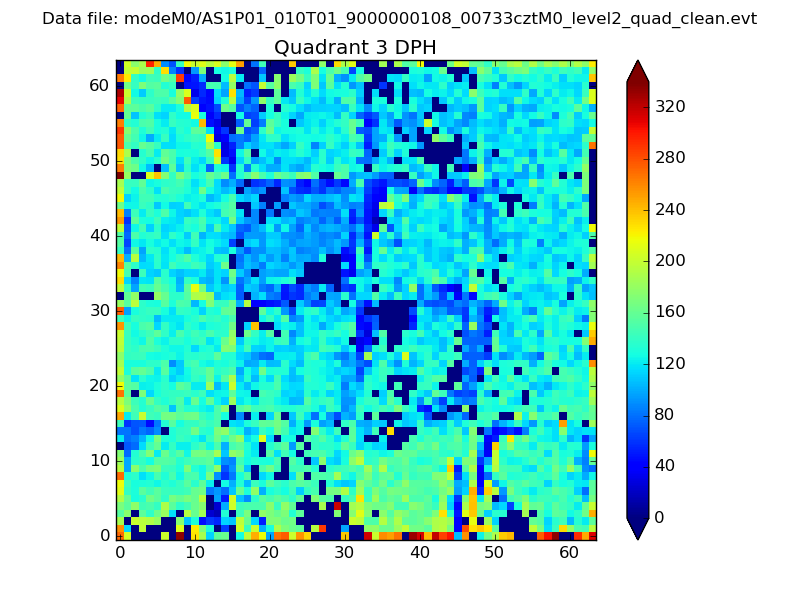 |
 |
Quadrant C |
| Plot type | Count rate plots | Images |
|---|---|---|
| Comparison with Poisson distribution Blue bars denote a histogram of data divided into 1 sec bins. Red curve is a Poisson curve with rate = median count rate of data. |
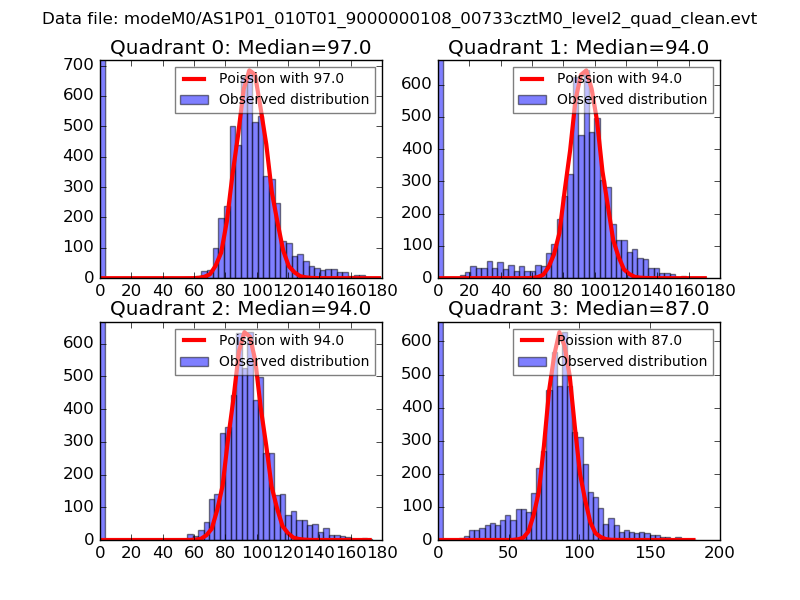 |
 |
| Quadrant-wise count rates Data is divided into 100 sec bins |
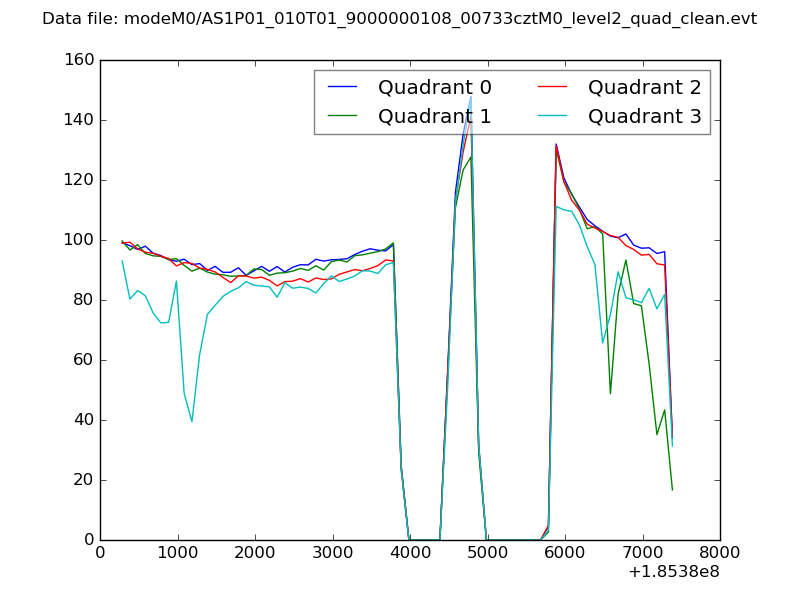 |
|
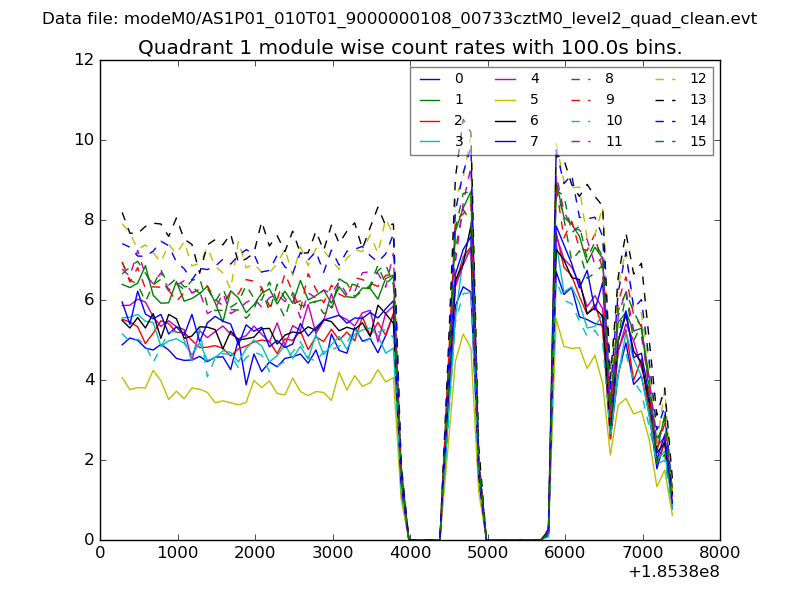
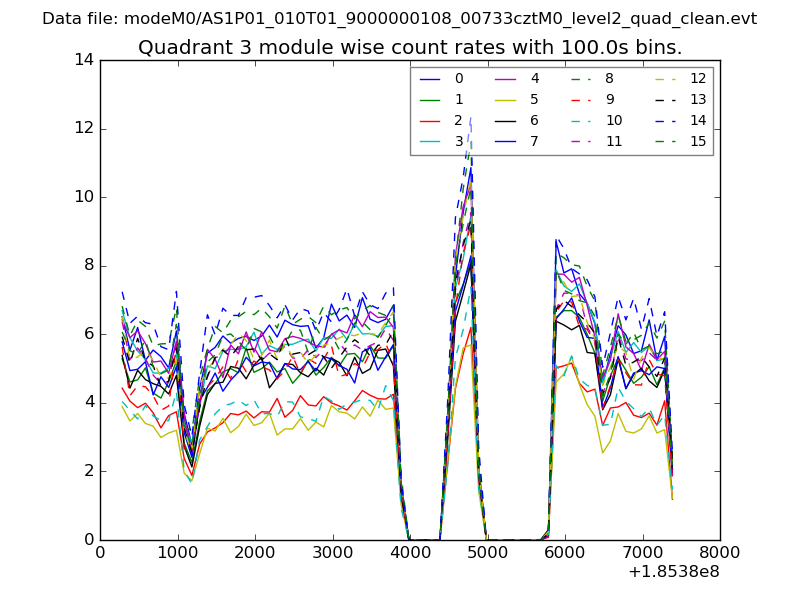
| Module-wise count rates for Quadrant A Data is divided into 100 sec bins |
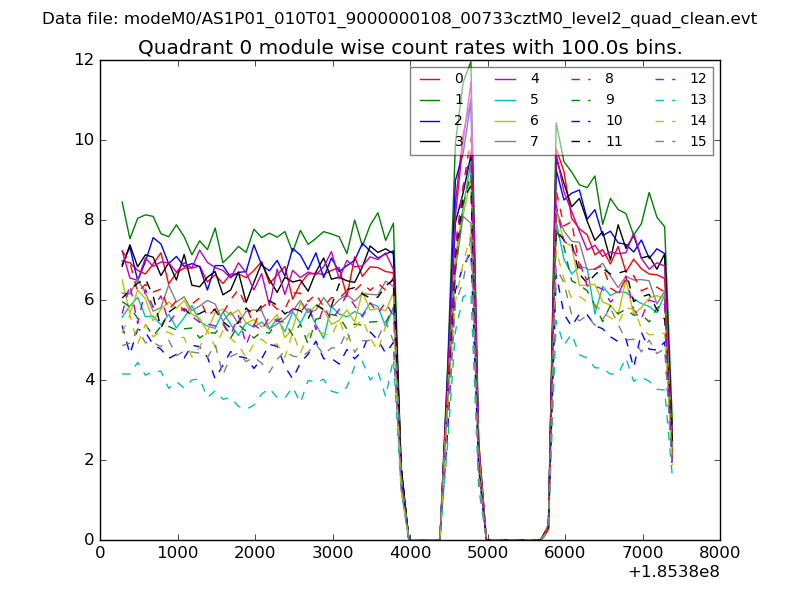 |
 |
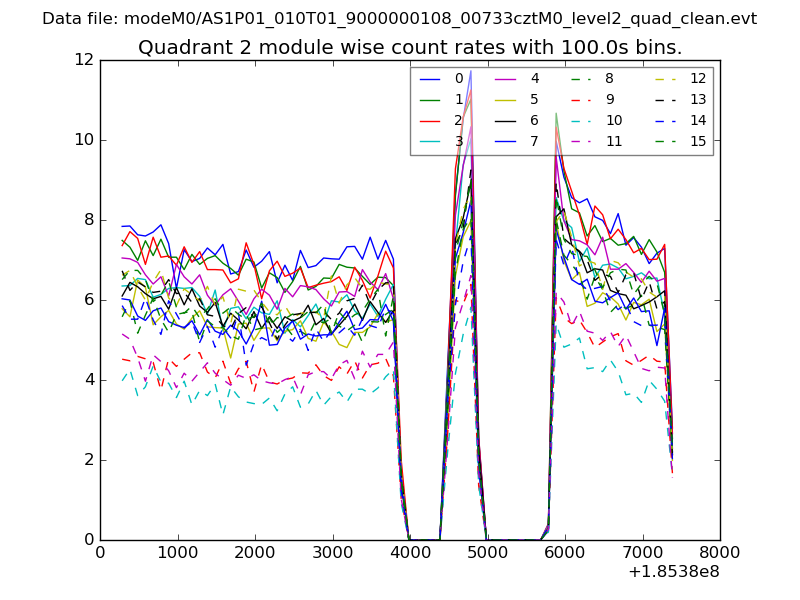
| Module-wise count rates for Quadrant B Data is divided into 100 sec bins |
 |
 |
| Module-wise count rates for Quadrant C Data is divided into 100 sec bins |
 |
 |
| Module-wise count rates for Quadrant D Data is divided into 100 sec bins |
 |
 |
| Parameter | Plot |
|---|---|
| CZT HV Monitor | 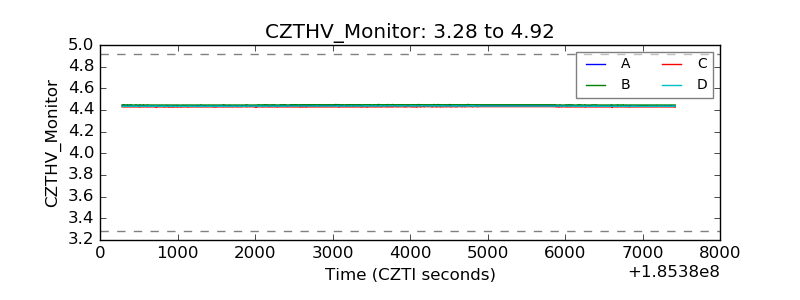 |
| D_VDD | 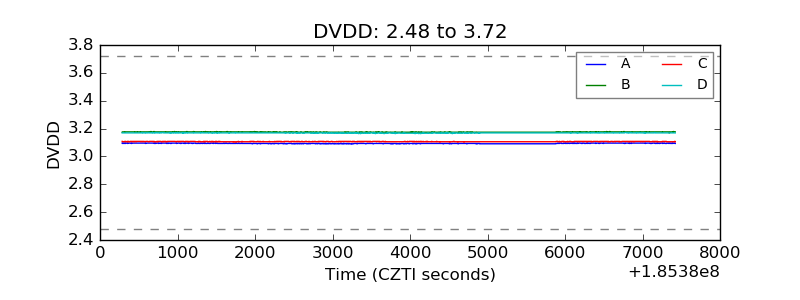 |
| Temperature 1 | 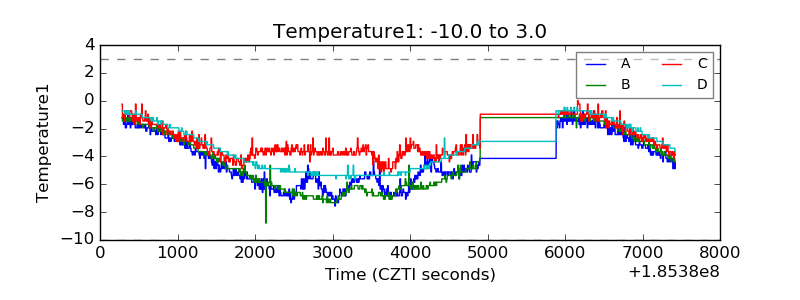 |
| Veto HV Monitor | 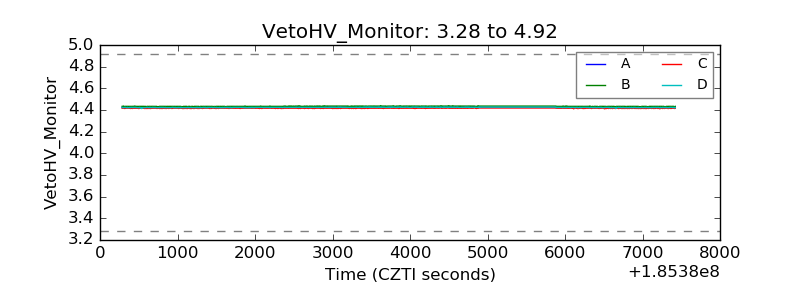 |
| Veto LLD | 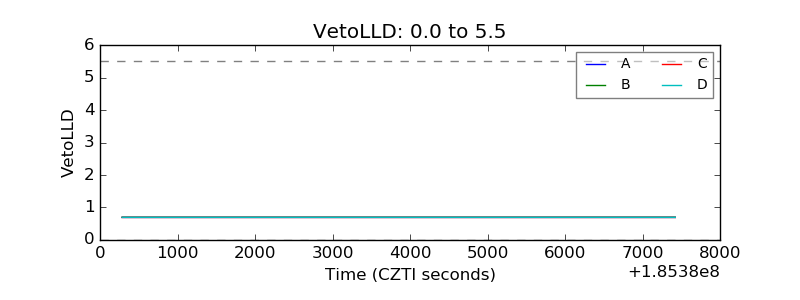 |
| Alpha Counter | 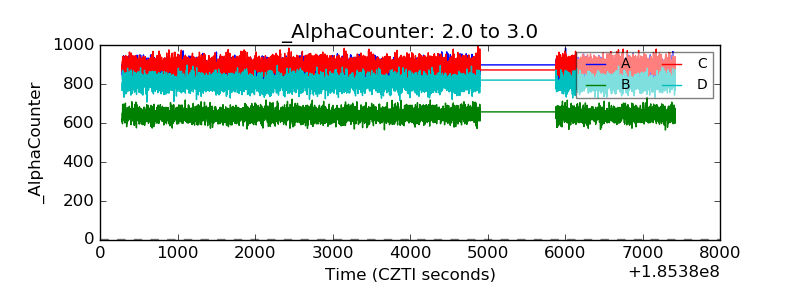 |
| _CPM_Rate | 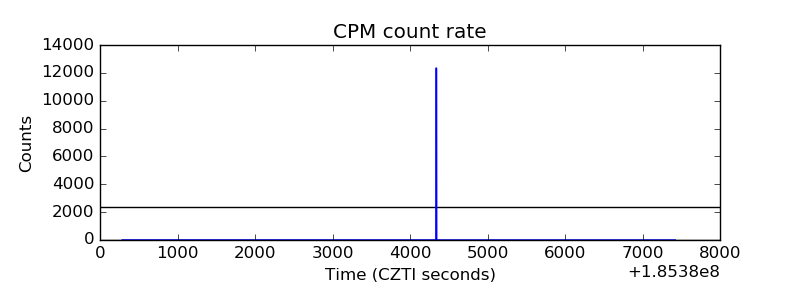 |
| CZT Counter | 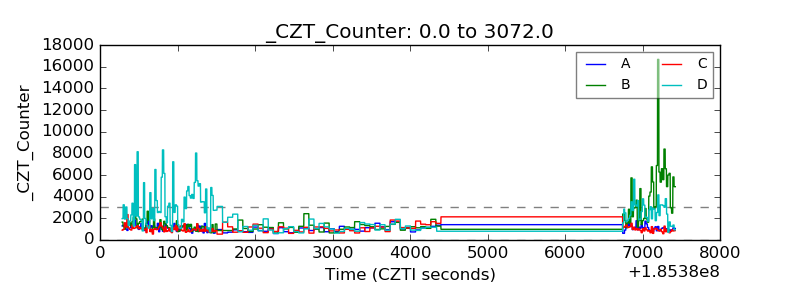 |
| +2.5 Volts monitor | 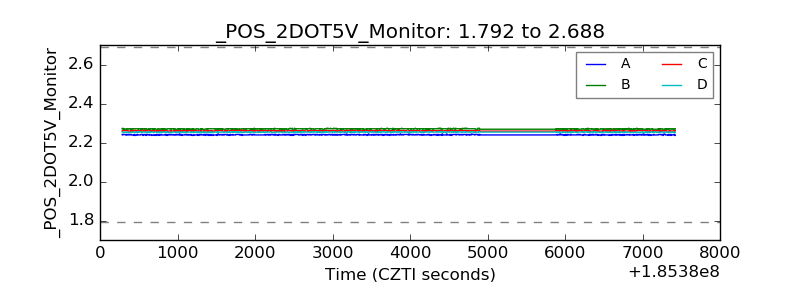 |
| +5 Volts monitor |  |
| _ROLL_ROT | 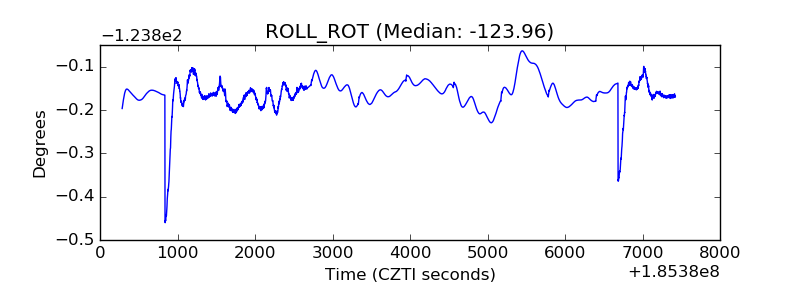 |
| _Roll_DEC | 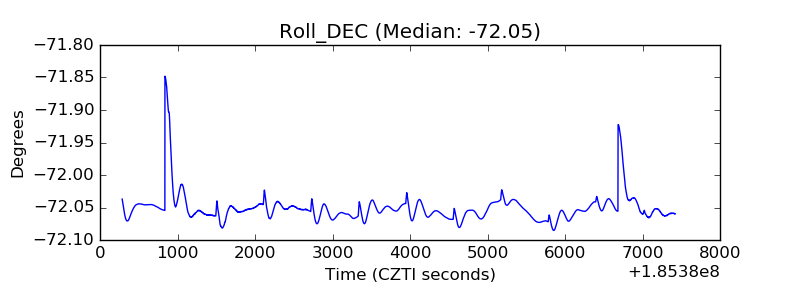 |
| _Roll_RA | 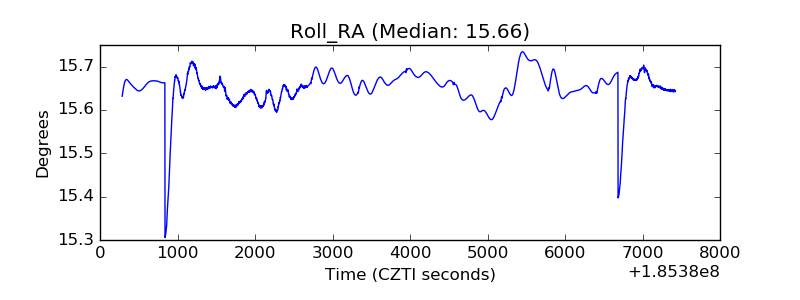 |
| Veto Counter | 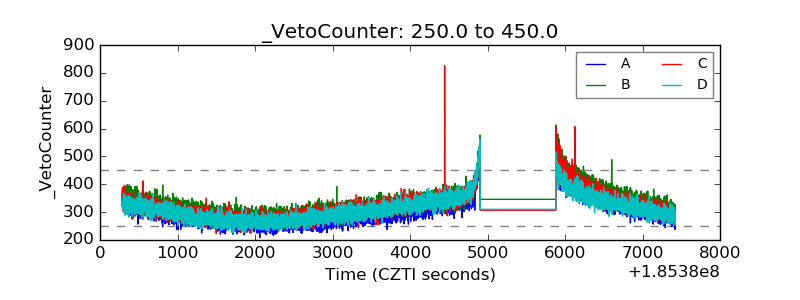 |