| Param | Original file | Final file |
|---|---|---|
| Filename | modeM0/AS1P01_010T01_9000000108_00737cztM0_level2.evt | modeM0/AS1P01_010T01_9000000108_00737cztM0_level2_quad_clean.evt |
| Size (bytes) | 1,186,922,880 | 83,096,640 |
| Size | 1.1 GB | 79.2 MB |
| Events in quadrant A | 6,984,770 | 559,030 |
| Events in quadrant B | 11,979,117 | 494,938 |
| Events in quadrant C | 6,689,554 | 550,094 |
| Events in quadrant D | 9,896,111 | 492,087 |
| Mode SS | |||
|---|---|---|---|
| Quadrant | BADHDUFLAG | Total packets | Discarded packets |
| A | 0 | 124 | 0 |
| B | 0 | 124 | 0 |
| C | 0 | 124 | 0 |
| D | 0 | 124 | 0 |
| Mode M0 | |||
|---|---|---|---|
| Quadrant | BADHDUFLAG | Total packets | Discarded packets |
| A | 0 | 25022 | 0 |
| B | 0 | 40069 | 0 |
| C | 0 | 24127 | 0 |
| D | 0 | 33756 | 0 |
| Mode M9 | |||
|---|---|---|---|
| Quadrant | BADHDUFLAG | Total packets | Discarded packets |
| A | 0 | 12 | 0 |
| B | 0 | 12 | 0 |
| C | 0 | 12 | 0 |
| D | 0 | 12 | 0 |
| Quadrant | Total seconds | Saturated seconds | Saturation percentage |
|---|---|---|---|
| A | 5994 | 16 | 0.266934% |
| B | 5993 | 1731 | 28.883698% |
| C | 5993 | 3 | 0.050058% |
| D | 5993 | 884 | 14.750542% |
Noise dominated data is calculated using 1-second bins in cleaned event files. If a bin has >2000 counts, and if more than 50% of those come from <1% of pixels, then it is considered to be noise-dominated and hence unusable.
| Quadrant | # 1 sec bins | Bins with >0 counts | Bins with >2000 counts | High rate bins dominated by noise | Noise dominated (total time) | Noise dominated (detector-on time) | Marked lightcurve |
|---|---|---|---|---|---|---|---|
| A | 7249 | 5995 | 183 | 183 | 2.52% | 3.05% | 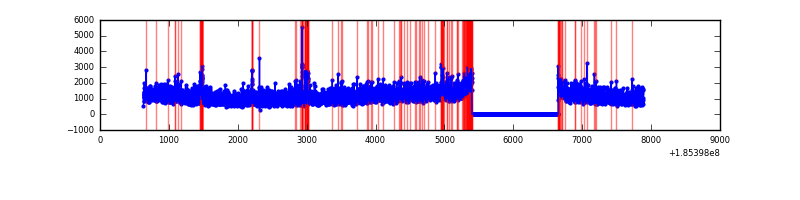 |
| B | 7248 | 5994 | 2489 | 2489 | 34.34% | 41.52% | 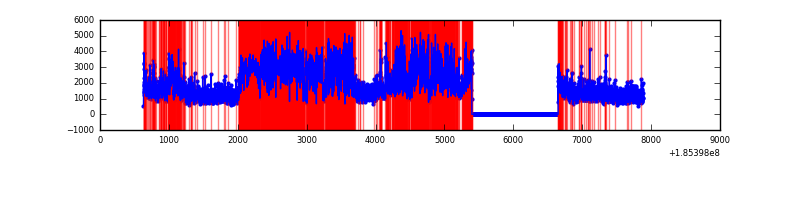 |
| C | 7248 | 5994 | 102 | 102 | 1.41% | 1.70% | 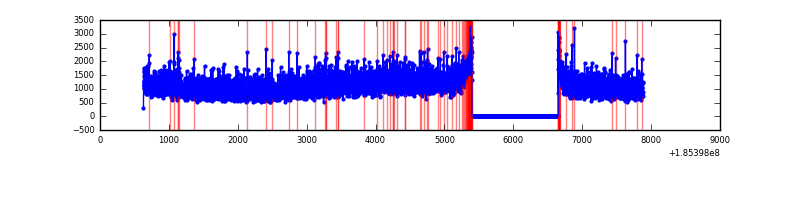 |
| D | 7248 | 5994 | 1854 | 1854 | 25.58% | 30.93% | 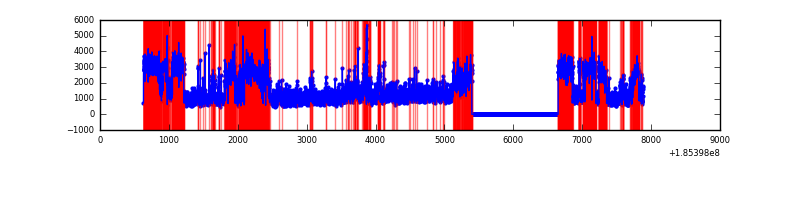 |
Top three noisy pixels from each quadrant. If the there are fewer than three noisy pixels in the level2.evt file, extra rows are filled as -1
| Pixel properties | Quadrant properties | ||||||
|---|---|---|---|---|---|---|---|
| Quadrant | DetID | PixID | Counts | Sigma | Mean | Median | Sigma |
| A | 15 | 171 | 147572 | 342.78 | 1770 | 1782 | 425.3 |
| A | 12 | 133 | 33855 | 75.41 | 1770 | 1782 | 425.3 |
| A | 15 | 17 | 7295 | 12.96 | 1770 | 1782 | 425.3 |
| B | 8 | 38 | 5228591 | 13177.33 | 1706 | 1714 | 396.7 |
| B | 7 | 221 | 119634 | 297.28 | 1706 | 1714 | 396.7 |
| B | 5 | 191 | 54755 | 133.72 | 1706 | 1714 | 396.7 |
| C | 15 | 241 | 37024 | 75.65 | 1682 | 1744 | 466.4 |
| C | 8 | 208 | 29841 | 60.24 | 1682 | 1744 | 466.4 |
| C | 3 | 111 | 23140 | 45.88 | 1682 | 1744 | 466.4 |
| D | 13 | 25 | 3001874 | 6397.16 | 1550 | 1601 | 469.0 |
| D | 12 | 188 | 522267 | 1110.16 | 1550 | 1601 | 469.0 |
| D | 7 | 207 | 168860 | 356.63 | 1550 | 1601 | 469.0 |
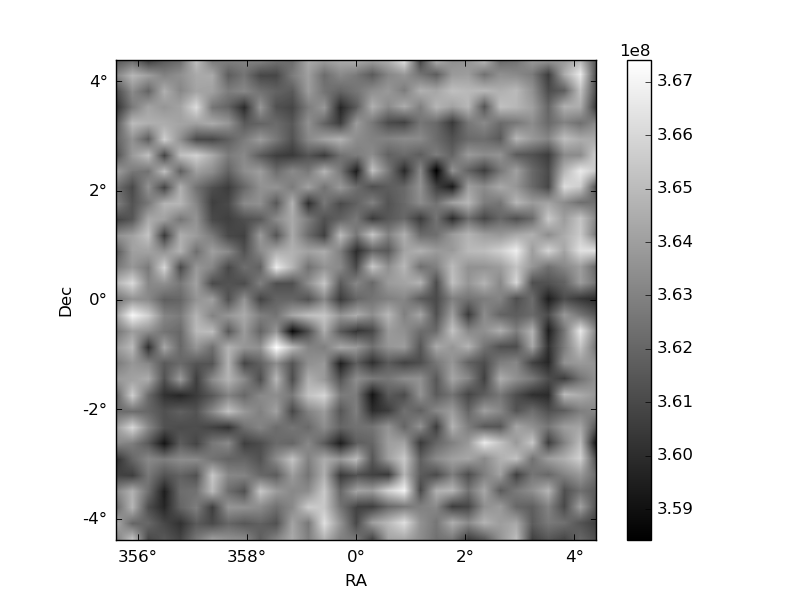
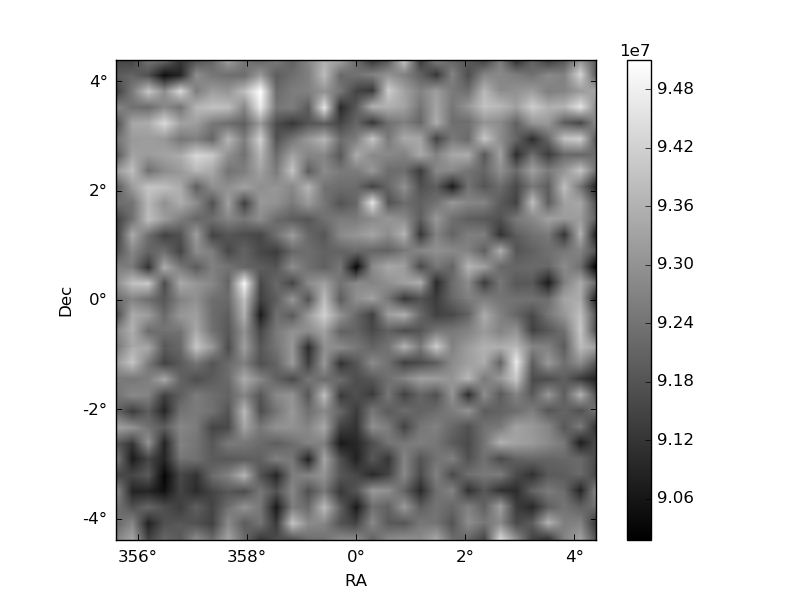
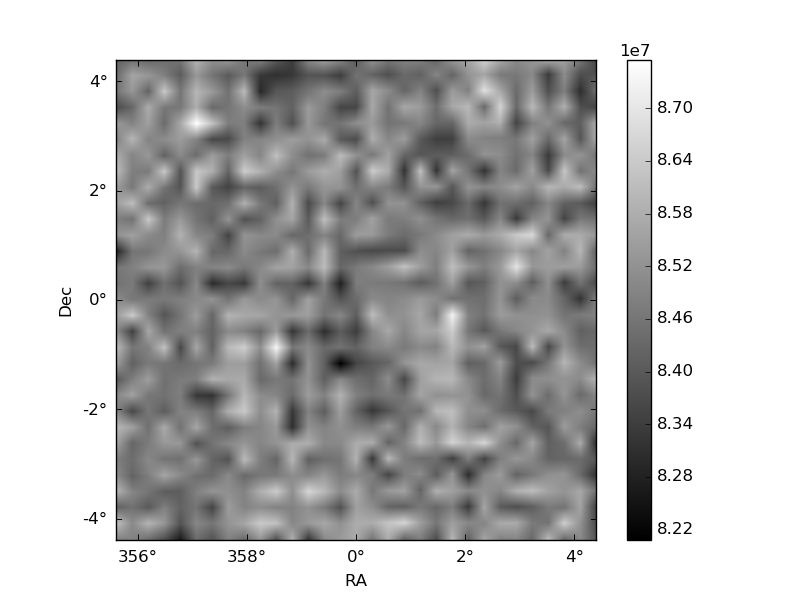
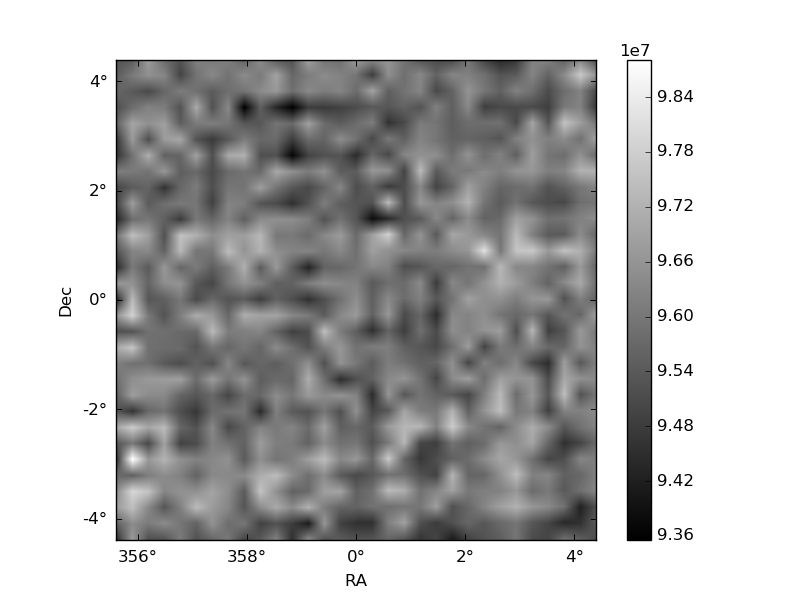
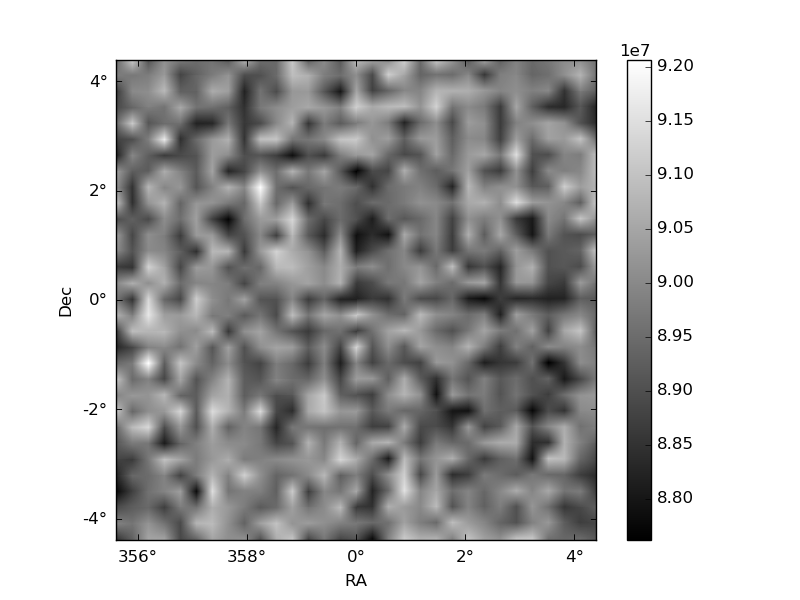
Histogram calculated using DETX and DETY for each event in the final _common_clean file
| Quadrant A | 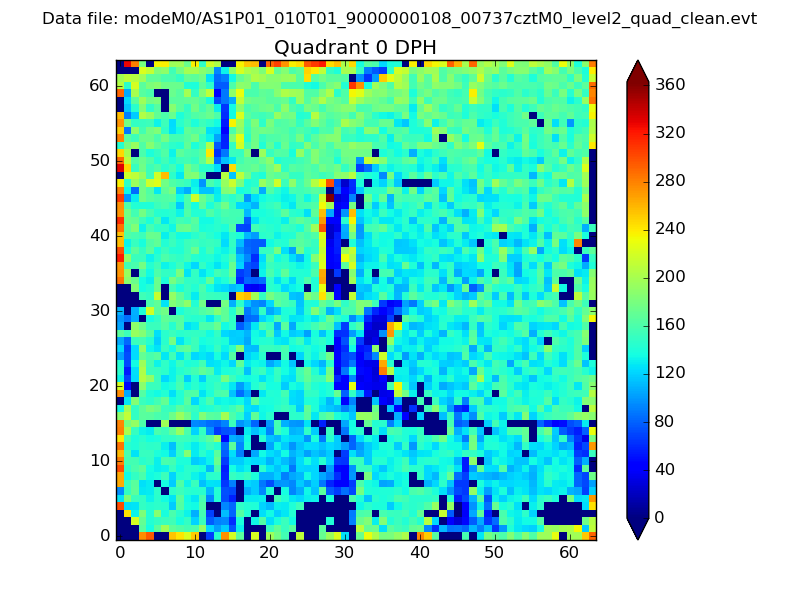 |
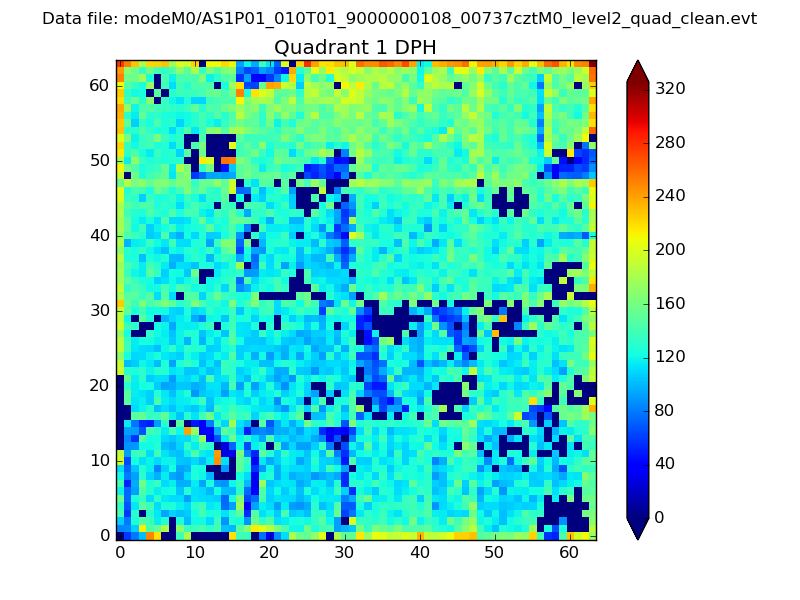 |
Quadrant B |
|---|---|---|---|
| Quadrant D | 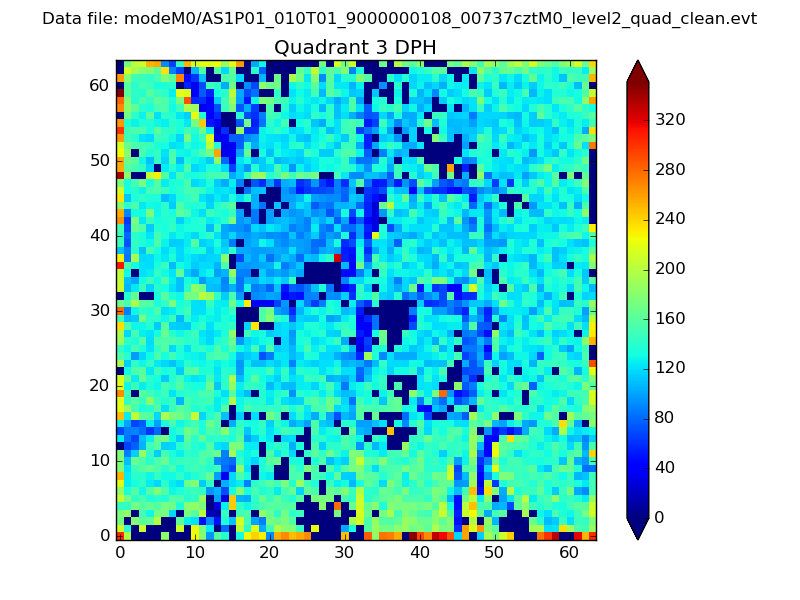 |
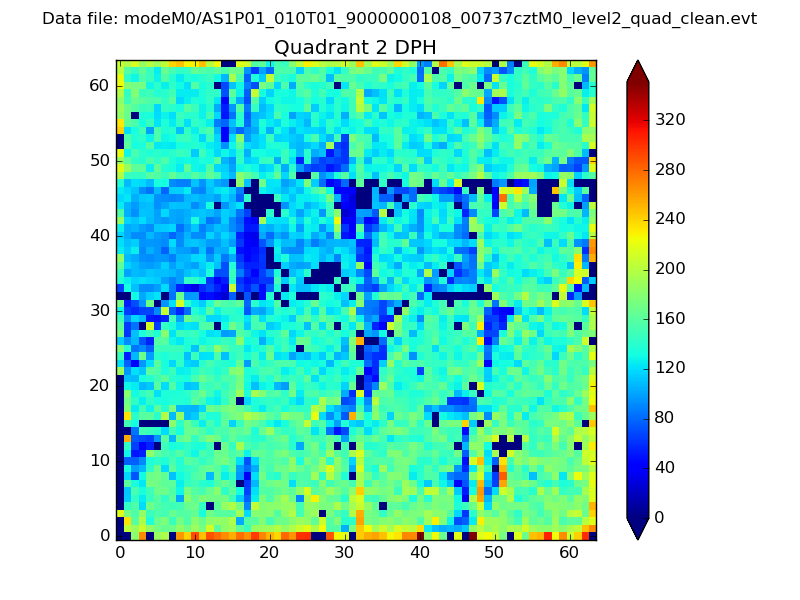 |
Quadrant C |
| Plot type | Count rate plots | Images |
|---|---|---|
| Comparison with Poisson distribution Blue bars denote a histogram of data divided into 1 sec bins. Red curve is a Poisson curve with rate = median count rate of data. |
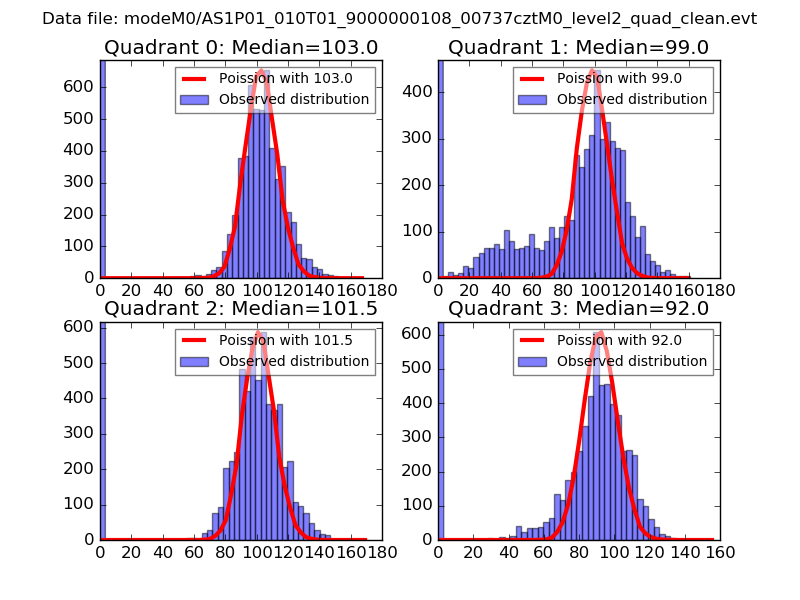 |
 |
| Quadrant-wise count rates Data is divided into 100 sec bins |
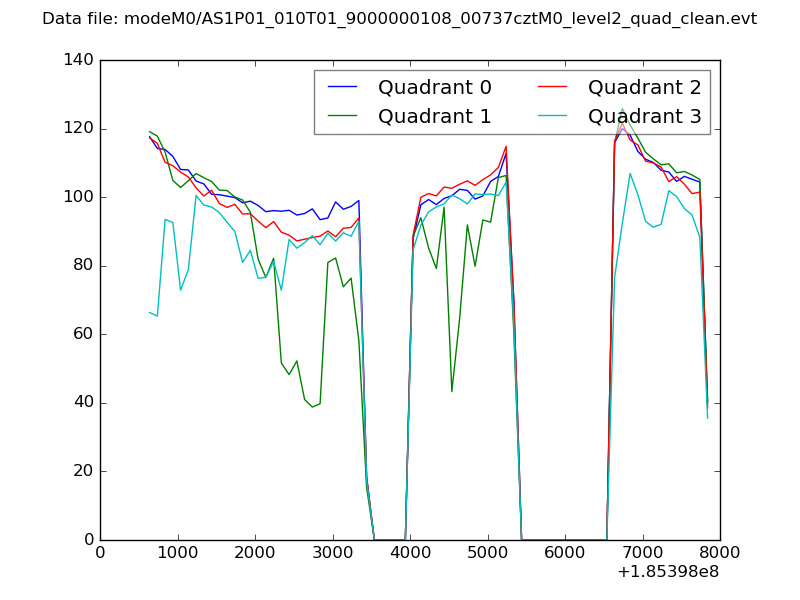 |
|
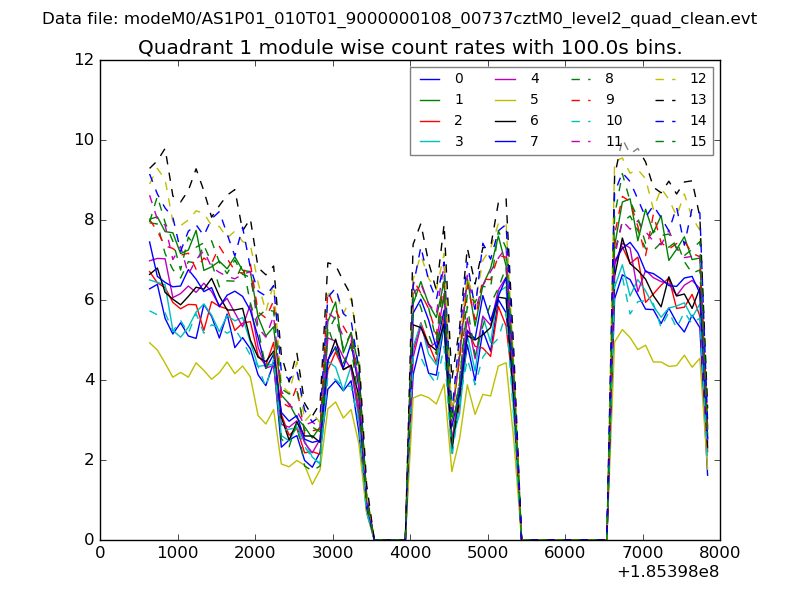
| Module-wise count rates for Quadrant A Data is divided into 100 sec bins |
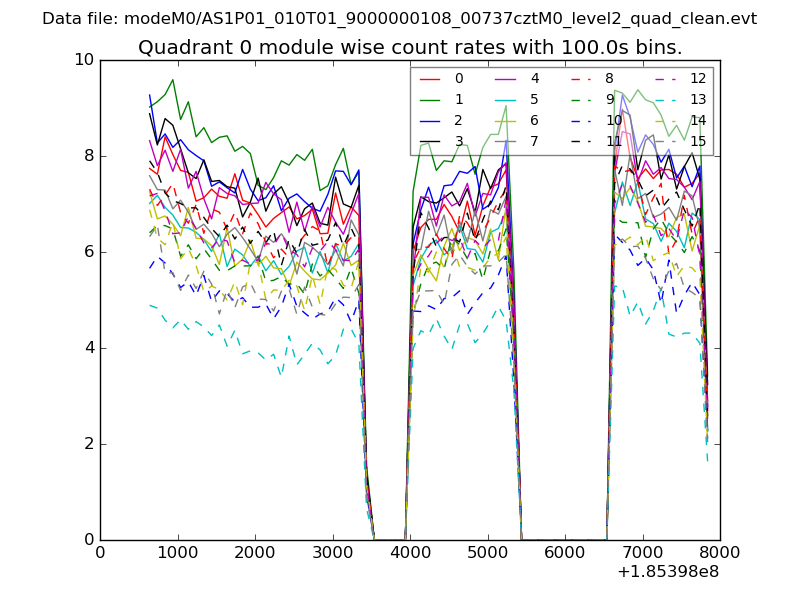 |
 |
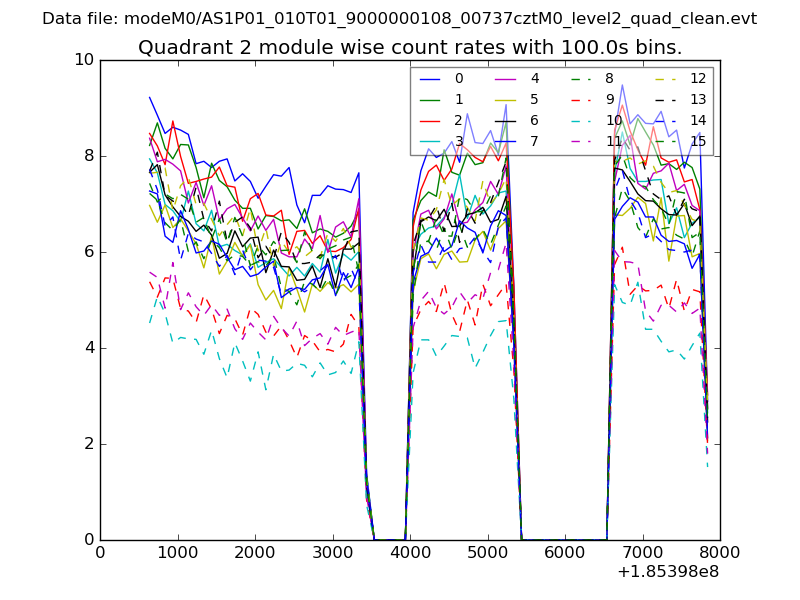
| Module-wise count rates for Quadrant B Data is divided into 100 sec bins |
 |
 |
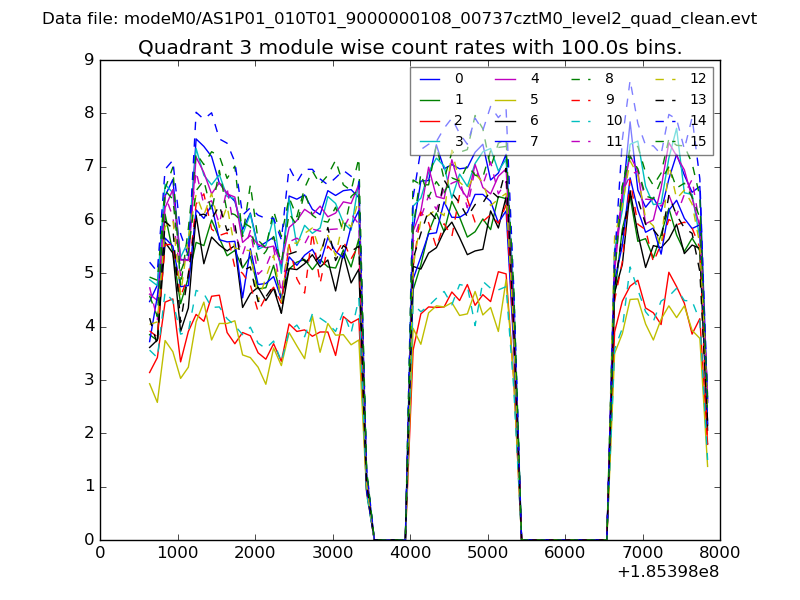
| Module-wise count rates for Quadrant C Data is divided into 100 sec bins |
 |
 |
| Module-wise count rates for Quadrant D Data is divided into 100 sec bins |
 |
 |
| Parameter | Plot |
|---|---|
| CZT HV Monitor | 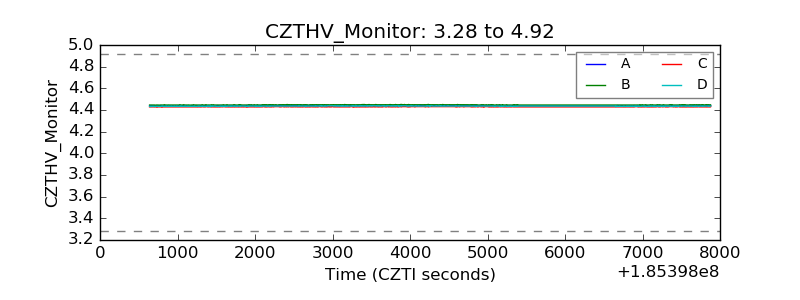 |
| D_VDD | 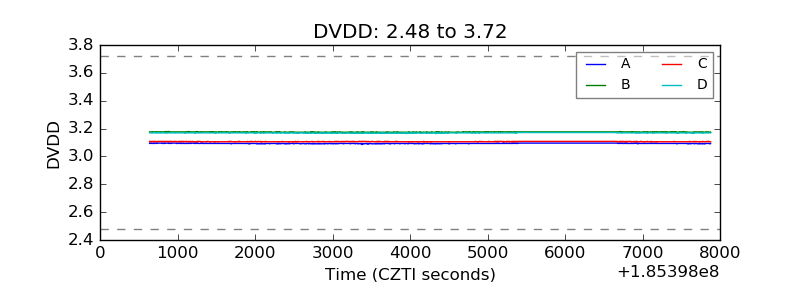 |
| Temperature 1 | 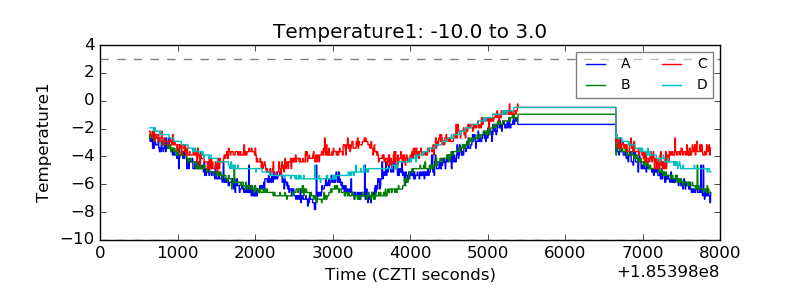 |
| Veto HV Monitor | 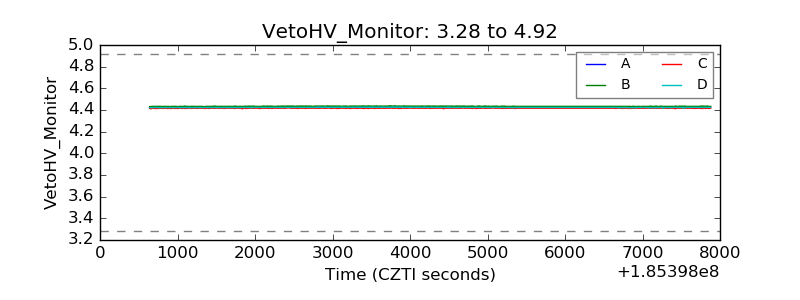 |
| Veto LLD | 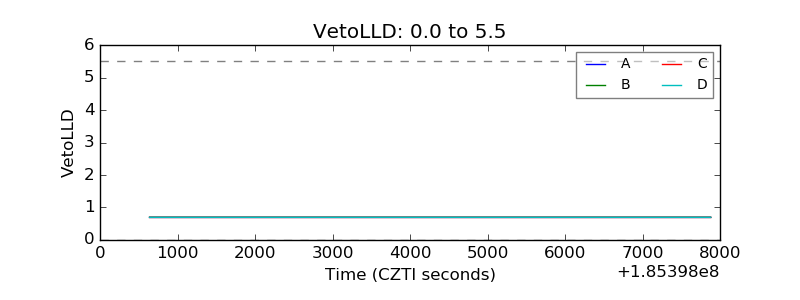 |
| Alpha Counter | 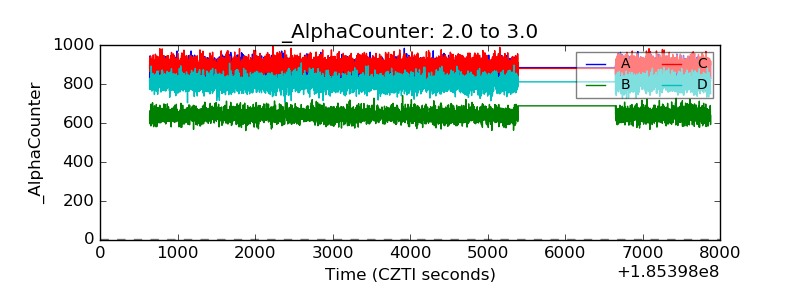 |
| _CPM_Rate | 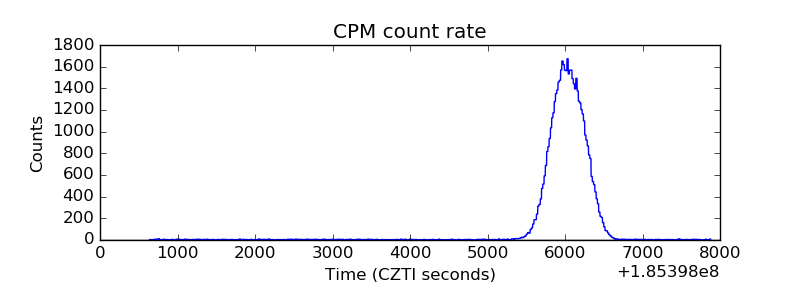 |
| CZT Counter | 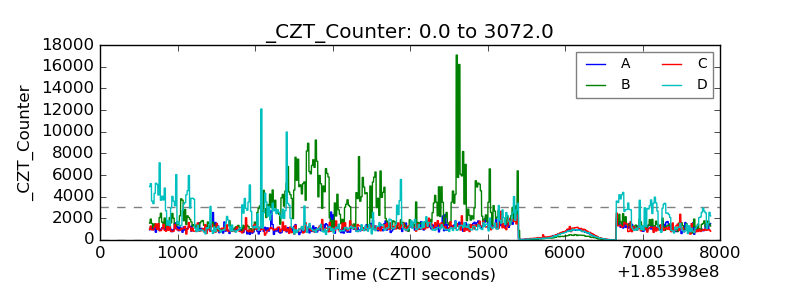 |
| +2.5 Volts monitor | 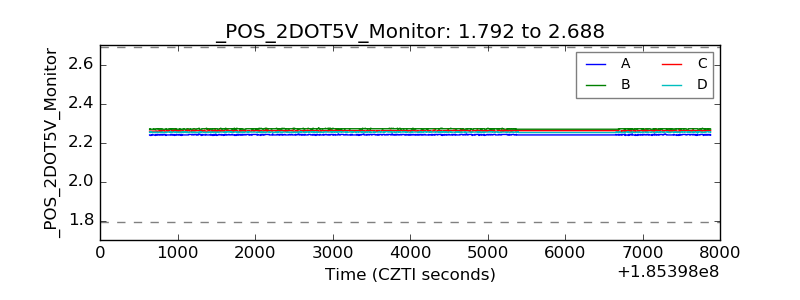 |
| +5 Volts monitor |  |
| _ROLL_ROT |  |
| _Roll_DEC |  |
| _Roll_RA | 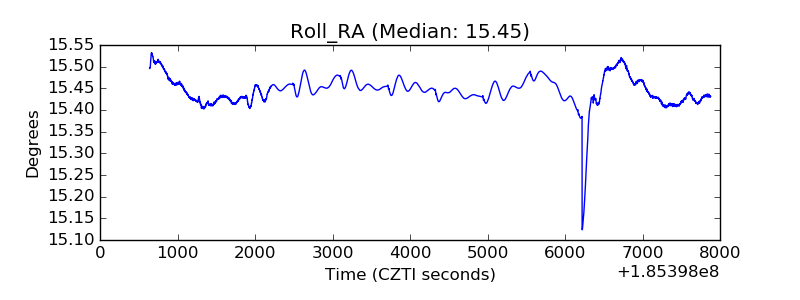 |
| Veto Counter | 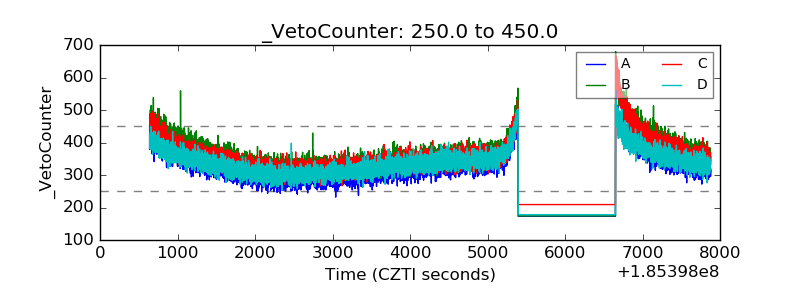 |