| Param | Original file | Final file |
|---|---|---|
| Filename | modeM0/AS1P01_010T01_9000000108_00738cztM0_level2.evt | modeM0/AS1P01_010T01_9000000108_00738cztM0_level2_quad_clean.evt |
| Size (bytes) | 1,131,537,600 | 92,047,680 |
| Size | 1.1 GB | 87.8 MB |
| Events in quadrant A | 7,724,831 | 600,922 |
| Events in quadrant B | 9,027,740 | 604,049 |
| Events in quadrant C | 7,207,111 | 593,690 |
| Events in quadrant D | 9,888,853 | 545,095 |
| Mode SS | |||
|---|---|---|---|
| Quadrant | BADHDUFLAG | Total packets | Discarded packets |
| A | 0 | 130 | 0 |
| B | 0 | 130 | 0 |
| C | 0 | 130 | 0 |
| D | 0 | 130 | 0 |
| Mode M0 | |||
|---|---|---|---|
| Quadrant | BADHDUFLAG | Total packets | Discarded packets |
| A | 0 | 27455 | 0 |
| B | 0 | 31306 | 0 |
| C | 0 | 25920 | 0 |
| D | 0 | 33927 | 0 |
| Mode M9 | |||
|---|---|---|---|
| Quadrant | BADHDUFLAG | Total packets | Discarded packets |
| A | 0 | 19 | 0 |
| B | 0 | 19 | 0 |
| C | 0 | 19 | 0 |
| D | 0 | 19 | 0 |
| Quadrant | Total seconds | Saturated seconds | Saturation percentage |
|---|---|---|---|
| A | 6353 | 14 | 0.220368% |
| B | 6352 | 172 | 2.707809% |
| C | 6352 | 6 | 0.094458% |
| D | 6352 | 531 | 8.359572% |
Noise dominated data is calculated using 1-second bins in cleaned event files. If a bin has >2000 counts, and if more than 50% of those come from <1% of pixels, then it is considered to be noise-dominated and hence unusable.
| Quadrant | # 1 sec bins | Bins with >0 counts | Bins with >2000 counts | High rate bins dominated by noise | Noise dominated (total time) | Noise dominated (detector-on time) | Marked lightcurve |
|---|---|---|---|---|---|---|---|
| A | 7578 | 6354 | 242 | 242 | 3.19% | 3.81% | 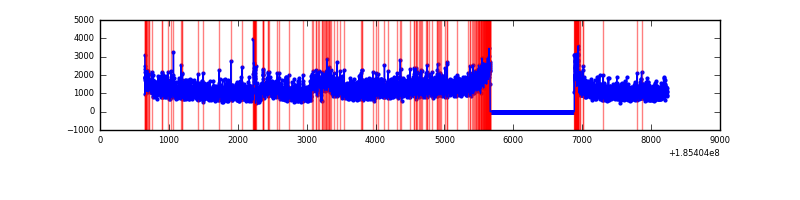 |
| B | 7577 | 6353 | 860 | 860 | 11.35% | 13.54% | 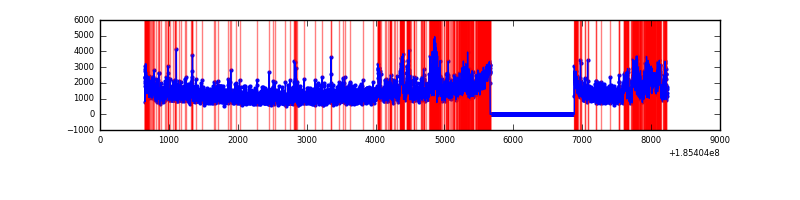 |
| C | 7577 | 6353 | 140 | 140 | 1.85% | 2.20% |  |
| D | 7577 | 6353 | 1745 | 1745 | 23.03% | 27.47% | 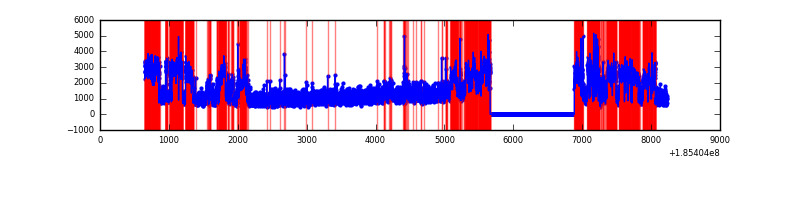 |
Top three noisy pixels from each quadrant. If the there are fewer than three noisy pixels in the level2.evt file, extra rows are filled as -1
| Pixel properties | Quadrant properties | ||||||
|---|---|---|---|---|---|---|---|
| Quadrant | DetID | PixID | Counts | Sigma | Mean | Median | Sigma |
| A | 15 | 171 | 368558 | 805.59 | 1905 | 1915 | 455.1 |
| A | 10 | 230 | 41420 | 86.8 | 1905 | 1915 | 455.1 |
| A | 11 | 79 | 7907 | 13.17 | 1905 | 1915 | 455.1 |
| B | 8 | 38 | 1097597 | 2334.87 | 2010 | 2017 | 469.2 |
| B | 7 | 221 | 186296 | 392.73 | 2010 | 2017 | 469.2 |
| B | 5 | 191 | 24113 | 47.09 | 2010 | 2017 | 469.2 |
| C | 15 | 241 | 37930 | 71.73 | 1819 | 1886 | 502.5 |
| C | 3 | 111 | 25555 | 47.1 | 1819 | 1886 | 502.5 |
| C | 9 | 52 | 15567 | 27.23 | 1819 | 1886 | 502.5 |
| D | 13 | 25 | 2526325 | 4796.8 | 1707 | 1766 | 526.3 |
| D | 6 | 226 | 341485 | 645.48 | 1707 | 1766 | 526.3 |
| D | 7 | 207 | 263441 | 497.2 | 1707 | 1766 | 526.3 |
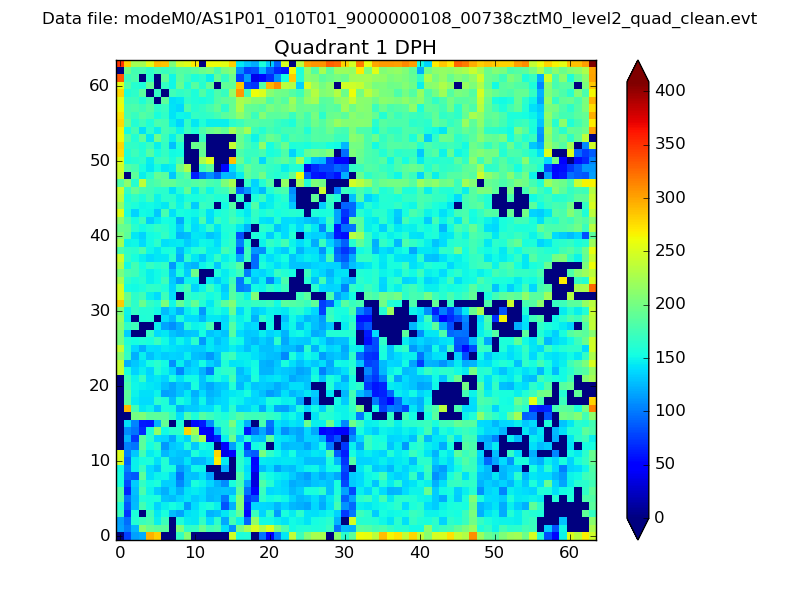
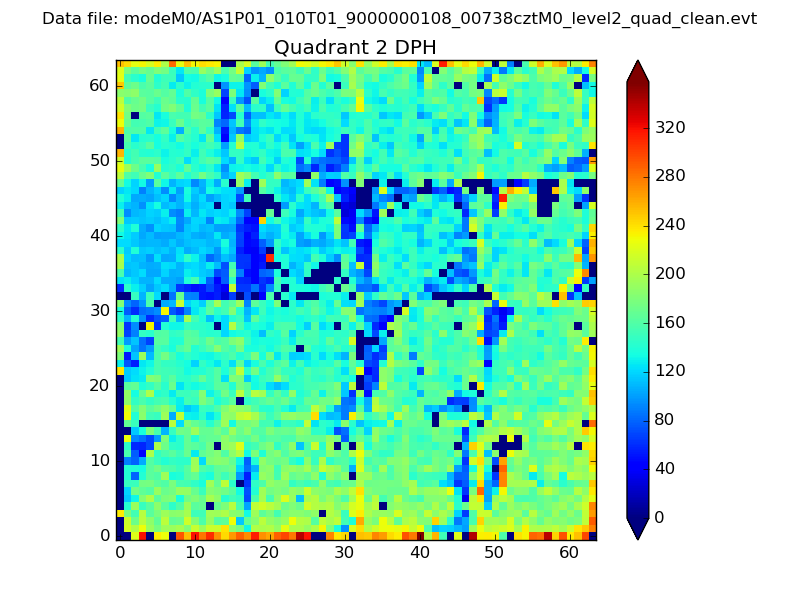
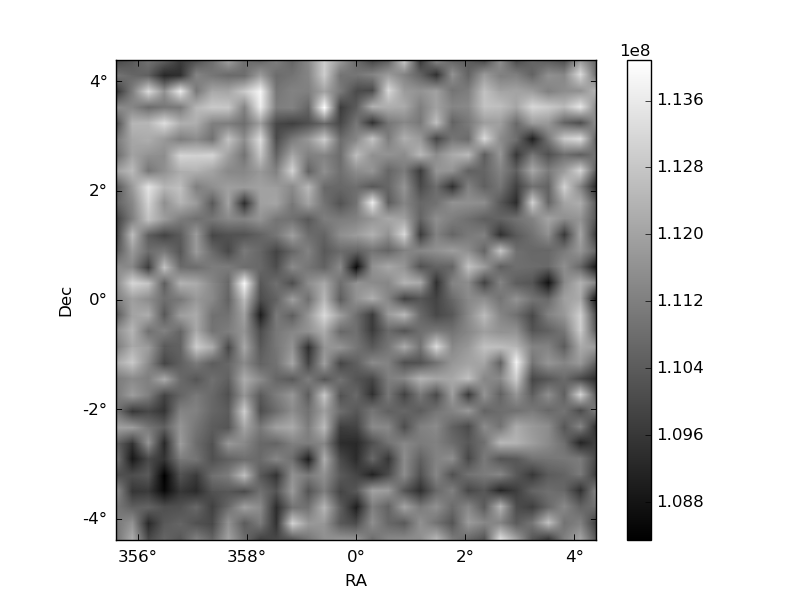
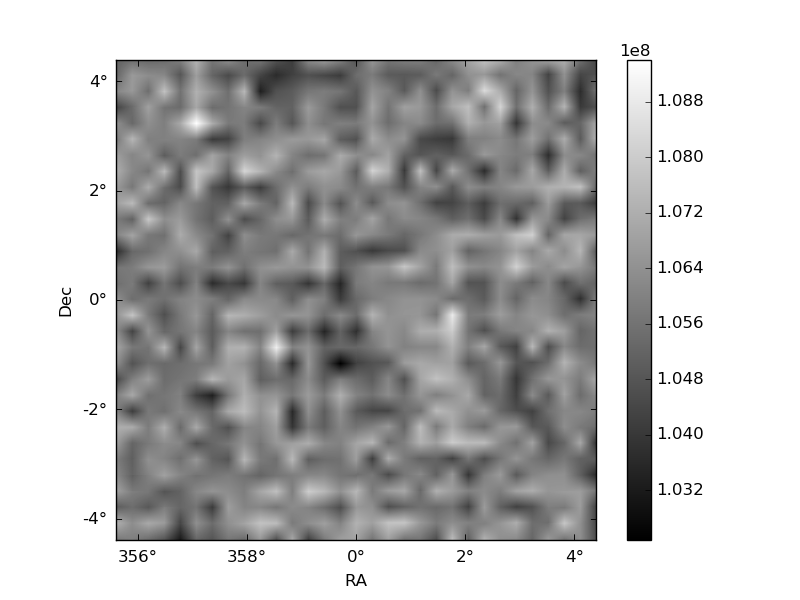
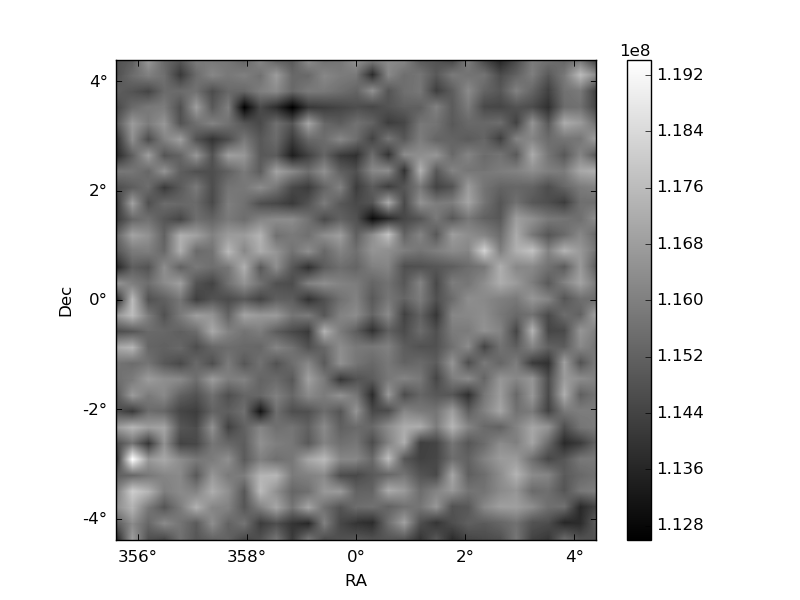
Histogram calculated using DETX and DETY for each event in the final _common_clean file
| Quadrant A | 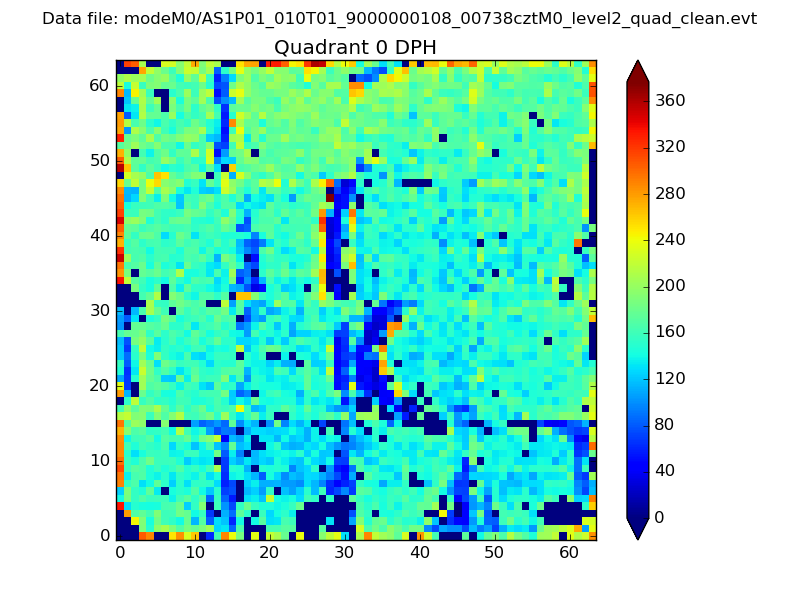 |
 |
Quadrant B |
|---|---|---|---|
| Quadrant D |  |
 |
Quadrant C |
| Plot type | Count rate plots | Images |
|---|---|---|
| Comparison with Poisson distribution Blue bars denote a histogram of data divided into 1 sec bins. Red curve is a Poisson curve with rate = median count rate of data. |
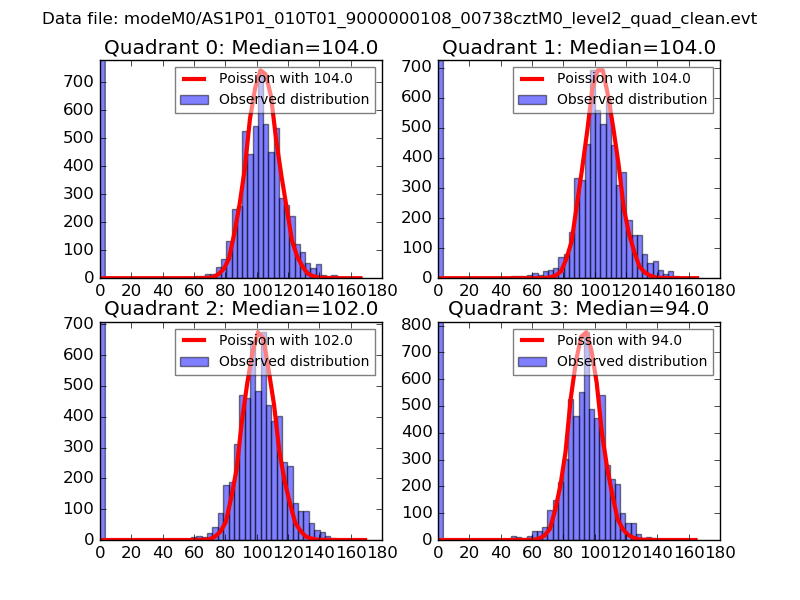 |
 |
| Quadrant-wise count rates Data is divided into 100 sec bins |
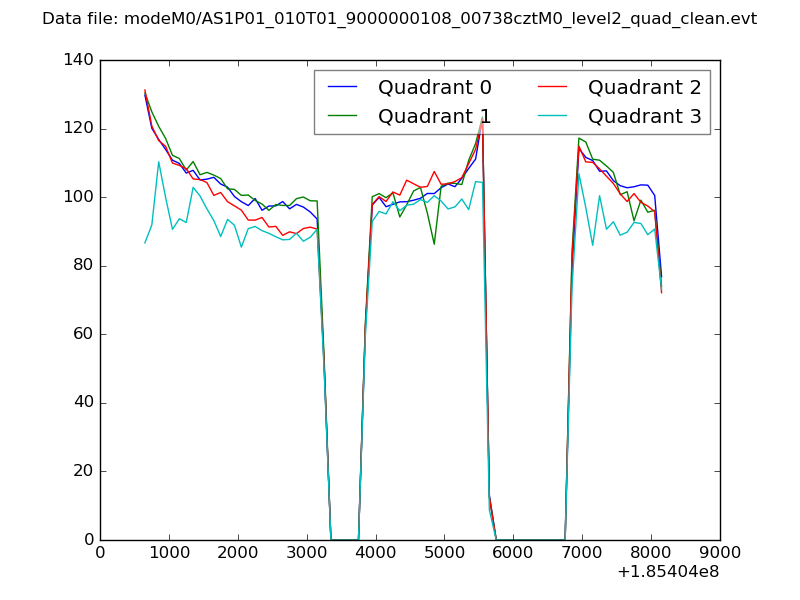 |
|
| Module-wise count rates for Quadrant A Data is divided into 100 sec bins |
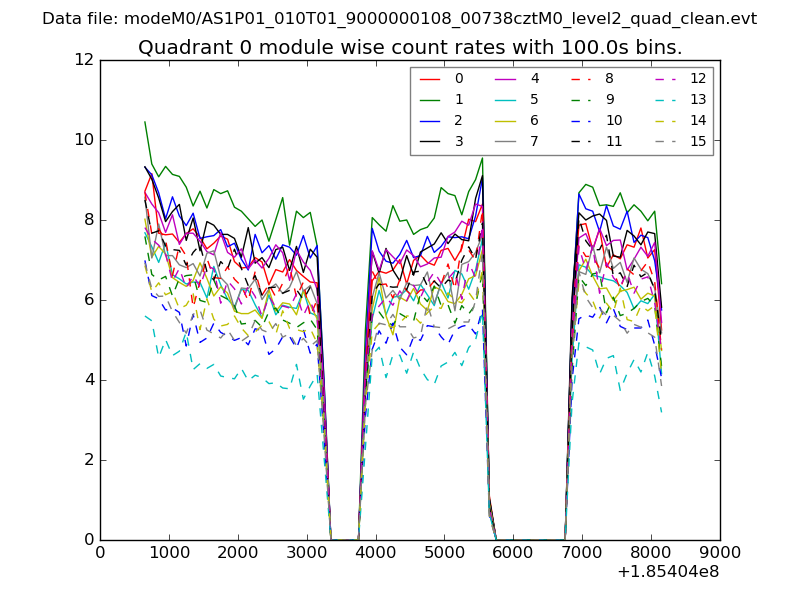 |
 |
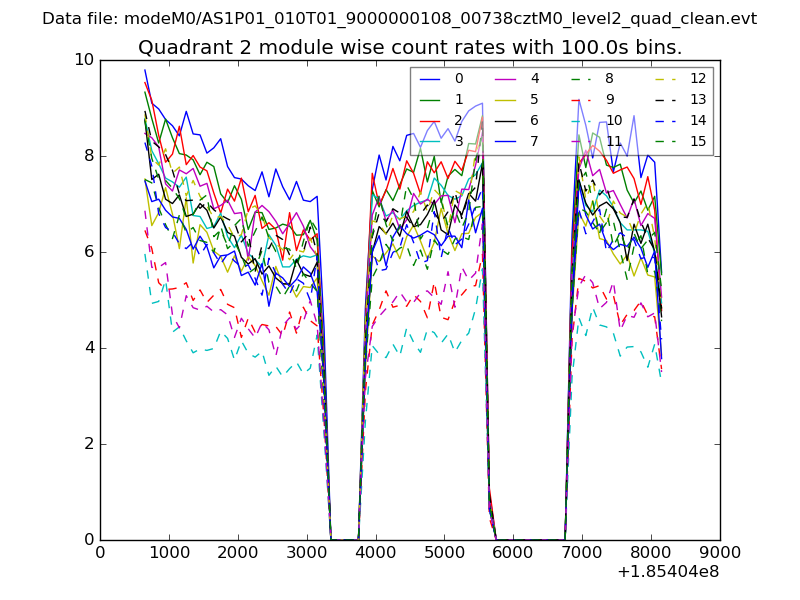
| Module-wise count rates for Quadrant B Data is divided into 100 sec bins |
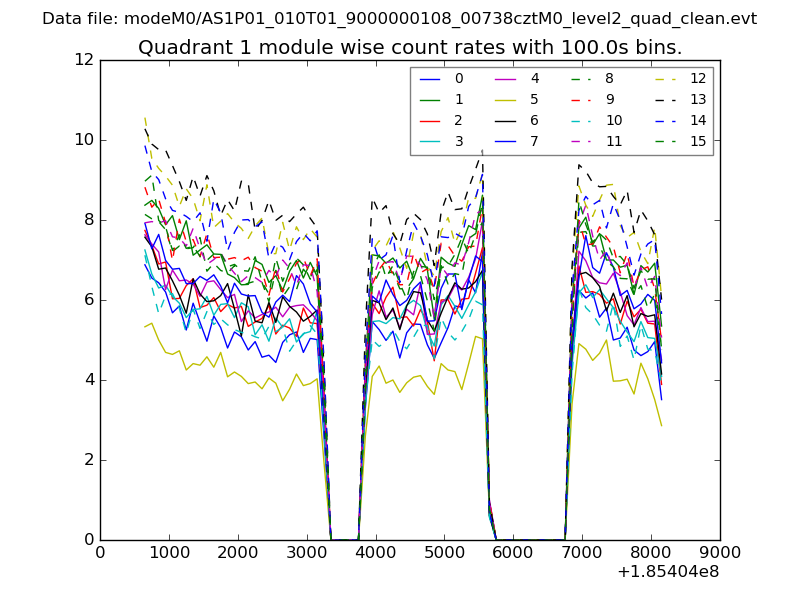 |
 |
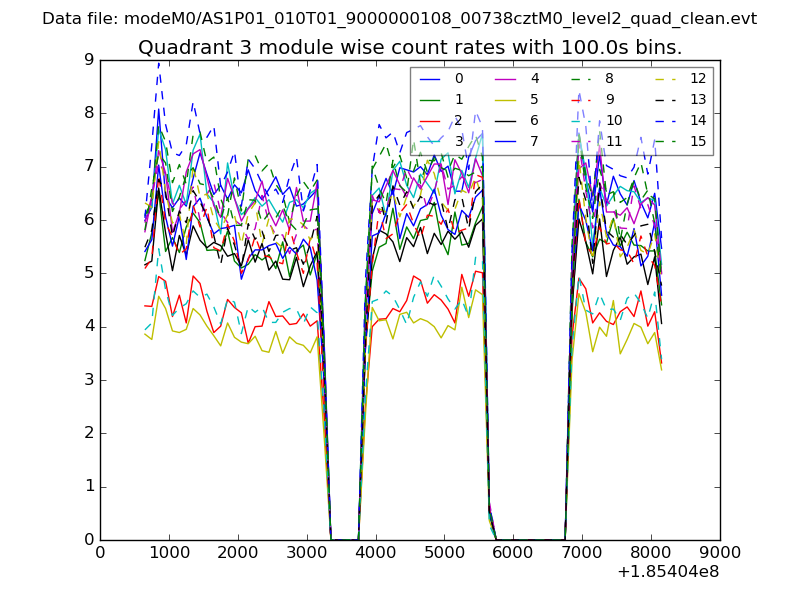
| Module-wise count rates for Quadrant C Data is divided into 100 sec bins |
 |
 |
| Module-wise count rates for Quadrant D Data is divided into 100 sec bins |
 |
 |
| Parameter | Plot |
|---|---|
| CZT HV Monitor | 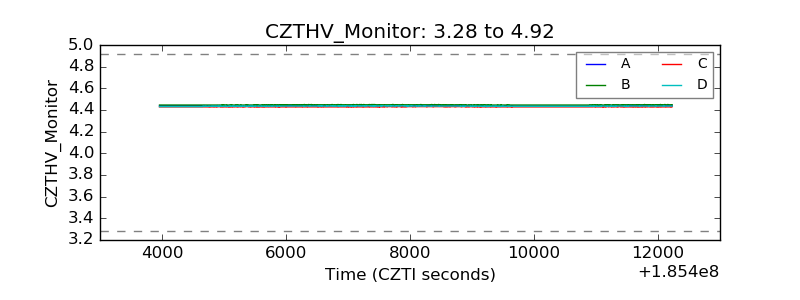 |
| D_VDD | 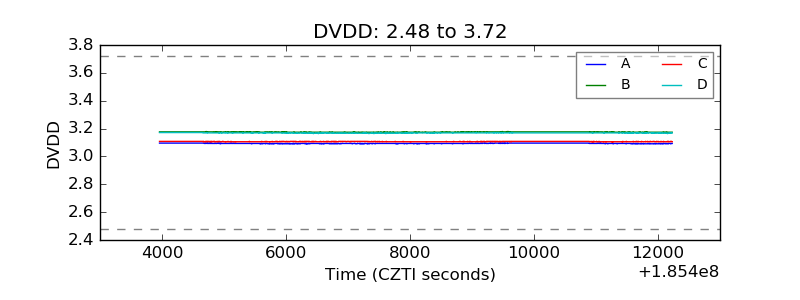 |
| Temperature 1 | 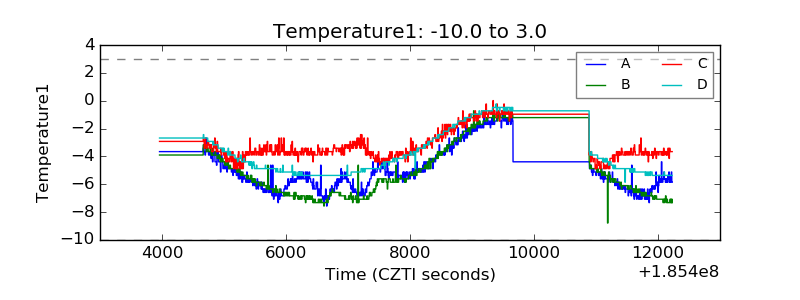 |
| Veto HV Monitor | 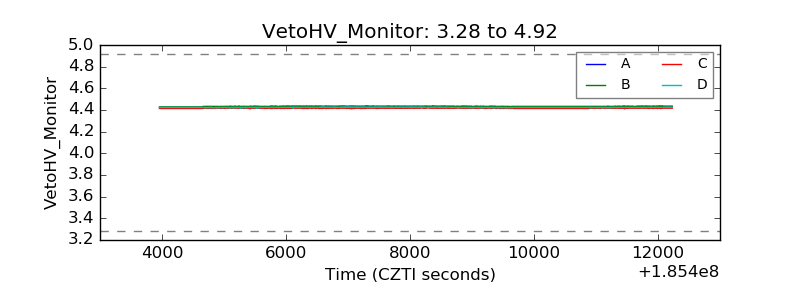 |
| Veto LLD | 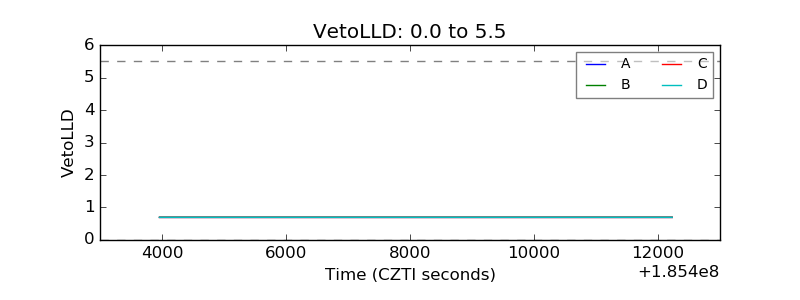 |
| Alpha Counter | 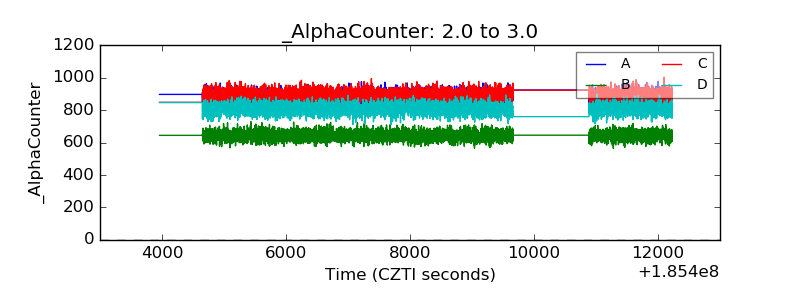 |
| _CPM_Rate | 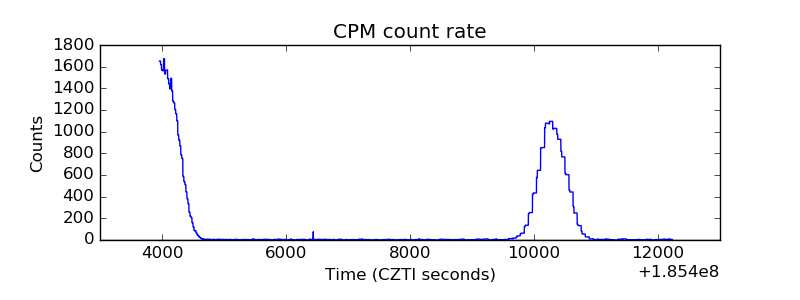 |
| CZT Counter | 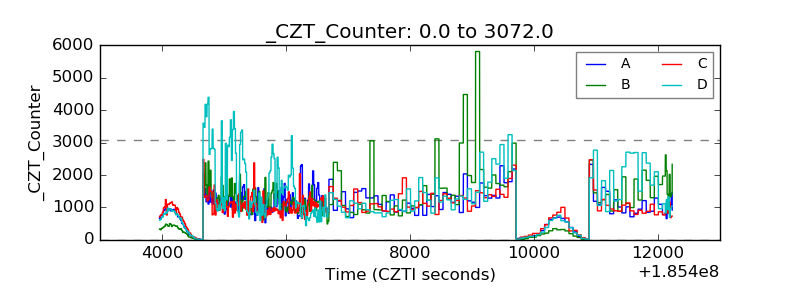 |
| +2.5 Volts monitor | 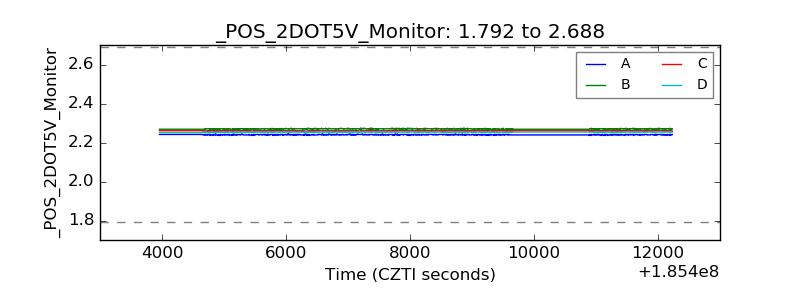 |
| +5 Volts monitor |  |
| _ROLL_ROT | 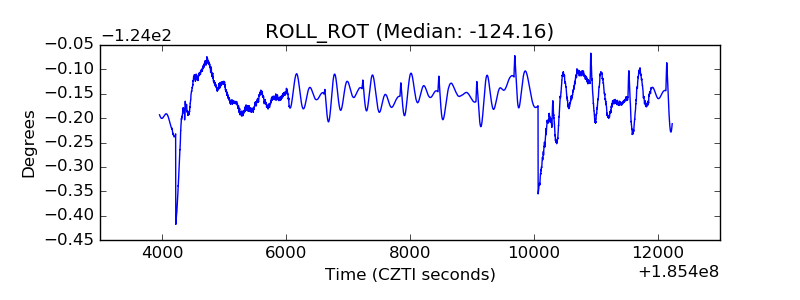 |
| _Roll_DEC | 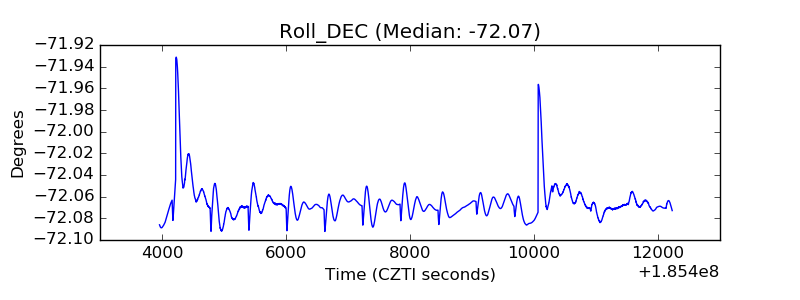 |
| _Roll_RA | 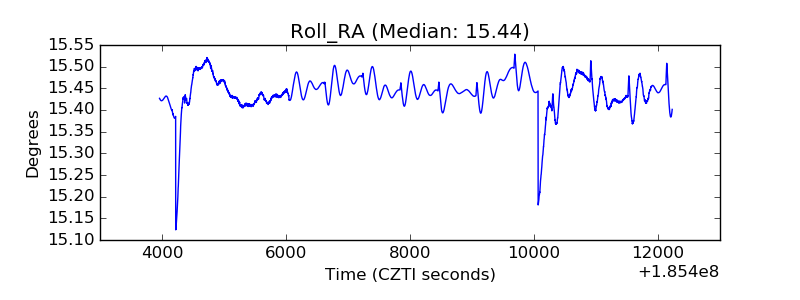 |
| Veto Counter | 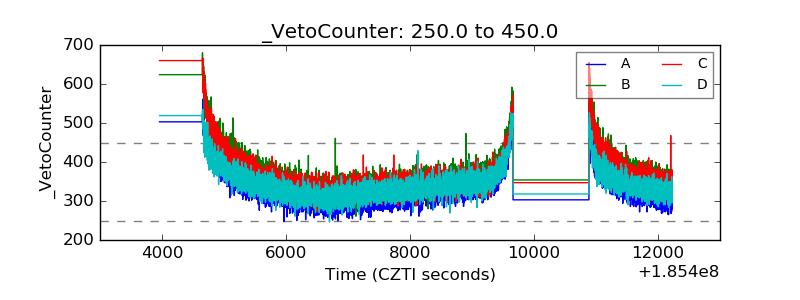 |