| Param | Original file | Final file |
|---|---|---|
| Filename | modeM0/AS1P01_010T01_9000000108_00739cztM0_level2.evt | modeM0/AS1P01_010T01_9000000108_00739cztM0_level2_quad_clean.evt |
| Size (bytes) | 1,216,480,320 | 95,564,160 |
| Size | 1.1 GB | 91.1 MB |
| Events in quadrant A | 7,755,906 | 623,462 |
| Events in quadrant B | 10,821,037 | 615,577 |
| Events in quadrant C | 7,662,509 | 612,768 |
| Events in quadrant D | 10,156,708 | 572,189 |
| Mode SS | |||
|---|---|---|---|
| Quadrant | BADHDUFLAG | Total packets | Discarded packets |
| A | 0 | 138 | 0 |
| B | 0 | 138 | 0 |
| C | 0 | 138 | 0 |
| D | 0 | 138 | 0 |
| Mode M0 | |||
|---|---|---|---|
| Quadrant | BADHDUFLAG | Total packets | Discarded packets |
| A | 0 | 27847 | 0 |
| B | 0 | 36931 | 0 |
| C | 0 | 27544 | 0 |
| D | 0 | 34983 | 0 |
| Mode M9 | |||
|---|---|---|---|
| Quadrant | BADHDUFLAG | Total packets | Discarded packets |
| A | 0 | 15 | 0 |
| B | 0 | 15 | 0 |
| C | 0 | 15 | 0 |
| D | 0 | 15 | 0 |
| Quadrant | Total seconds | Saturated seconds | Saturation percentage |
|---|---|---|---|
| A | 6737 | 17 | 0.252338% |
| B | 6737 | 306 | 4.542081% |
| C | 6736 | 5 | 0.074228% |
| D | 6736 | 471 | 6.992280% |
Noise dominated data is calculated using 1-second bins in cleaned event files. If a bin has >2000 counts, and if more than 50% of those come from <1% of pixels, then it is considered to be noise-dominated and hence unusable.
| Quadrant | # 1 sec bins | Bins with >0 counts | Bins with >2000 counts | High rate bins dominated by noise | Noise dominated (total time) | Noise dominated (detector-on time) | Marked lightcurve |
|---|---|---|---|---|---|---|---|
| A | 7882 | 6738 | 182 | 182 | 2.31% | 2.70% | 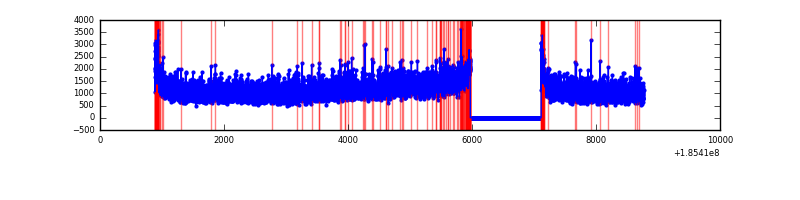 |
| B | 7882 | 6738 | 1419 | 1419 | 18.00% | 21.06% | 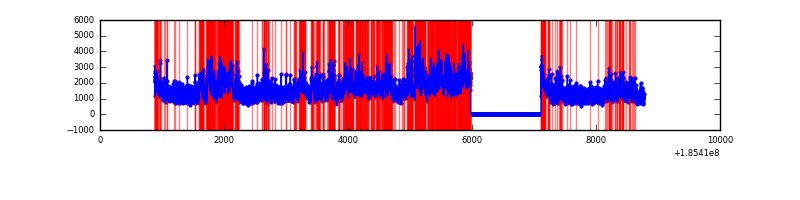 |
| C | 7881 | 6737 | 124 | 124 | 1.57% | 1.84% | 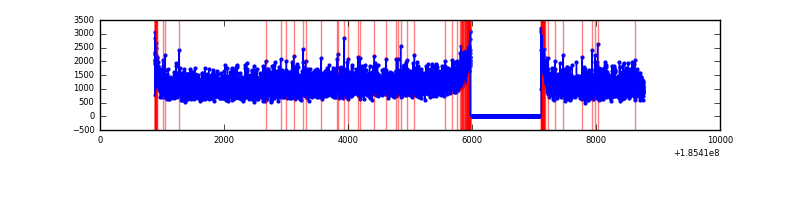 |
| D | 7881 | 6737 | 1513 | 1513 | 19.20% | 22.46% | 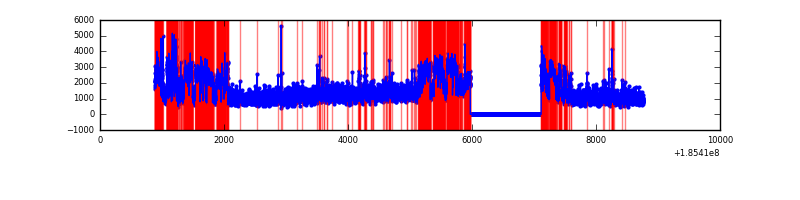 |
Top three noisy pixels from each quadrant. If the there are fewer than three noisy pixels in the level2.evt file, extra rows are filled as -1
| Pixel properties | Quadrant properties | ||||||
|---|---|---|---|---|---|---|---|
| Quadrant | DetID | PixID | Counts | Sigma | Mean | Median | Sigma |
| A | 10 | 230 | 45774 | 91.53 | 1997 | 2010 | 478.1 |
| A | 15 | 171 | 30278 | 59.12 | 1997 | 2010 | 478.1 |
| A | 11 | 79 | 9421 | 15.5 | 1997 | 2010 | 478.1 |
| B | 8 | 38 | 2597630 | 5348.76 | 2100 | 2106 | 485.3 |
| B | 7 | 221 | 176661 | 359.72 | 2100 | 2106 | 485.3 |
| B | 0 | 220 | 25572 | 48.36 | 2100 | 2106 | 485.3 |
| C | 15 | 241 | 41842 | 74.81 | 1927 | 1995 | 532.6 |
| C | 9 | 52 | 37970 | 67.54 | 1927 | 1995 | 532.6 |
| C | 3 | 111 | 29194 | 51.07 | 1927 | 1995 | 532.6 |
| D | 13 | 25 | 2073353 | 3699.21 | 1824 | 1885 | 560.0 |
| D | 6 | 226 | 446697 | 794.34 | 1824 | 1885 | 560.0 |
| D | 7 | 207 | 324521 | 576.16 | 1824 | 1885 | 560.0 |
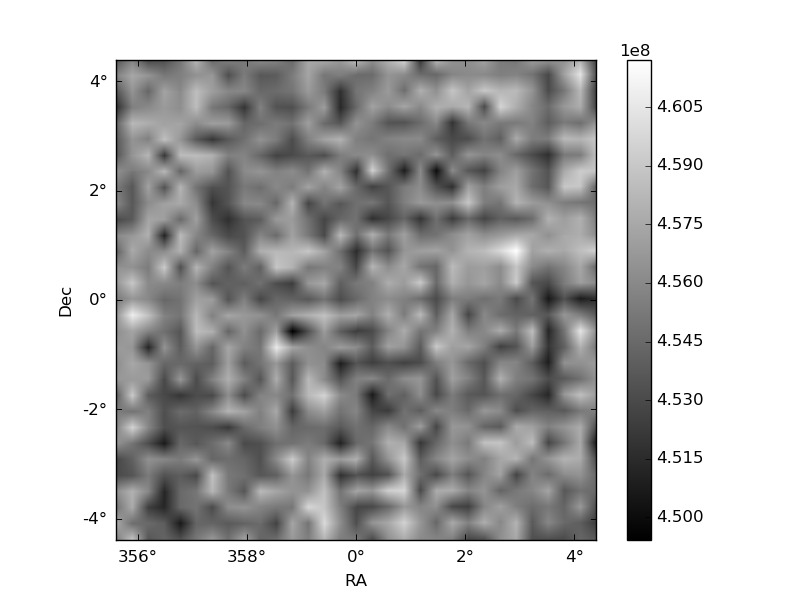
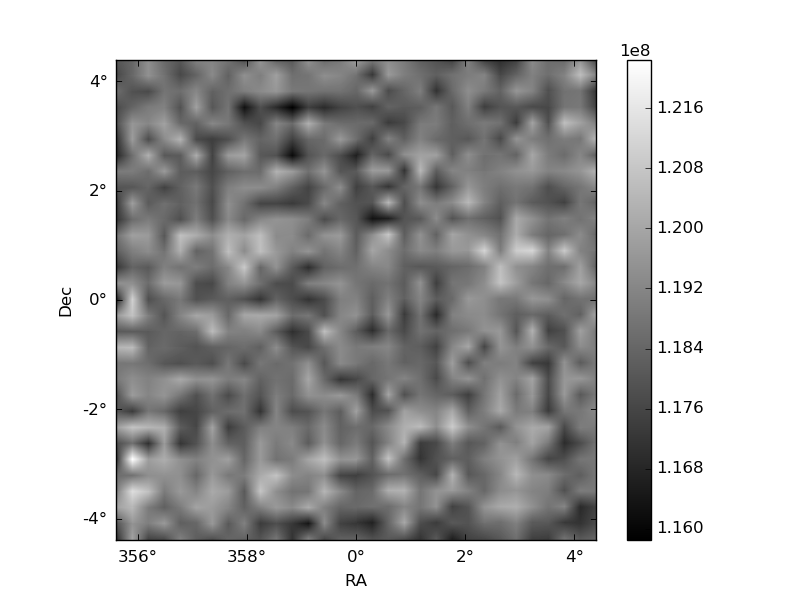
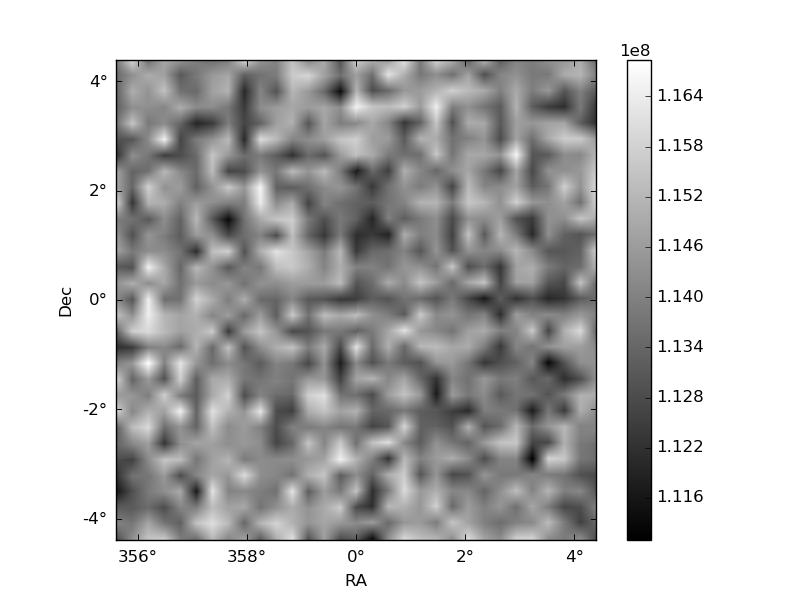
Histogram calculated using DETX and DETY for each event in the final _common_clean file
| Quadrant A | 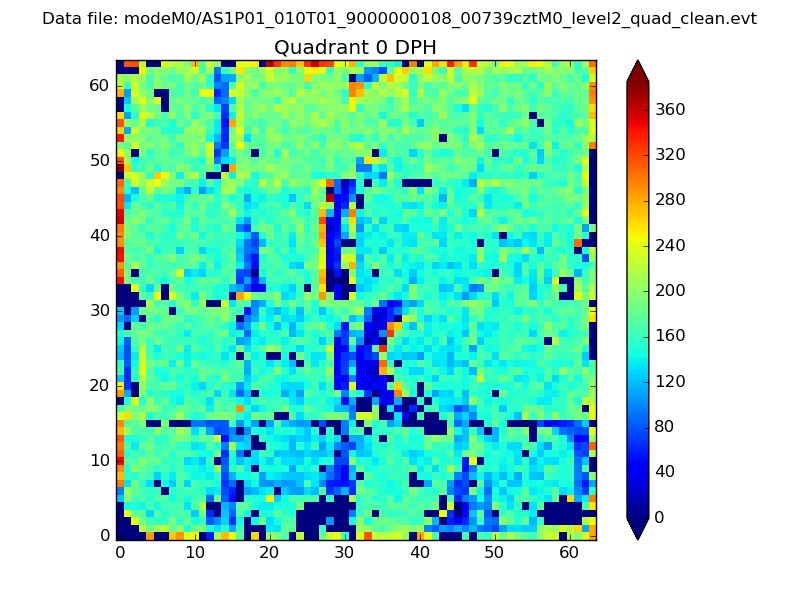 |
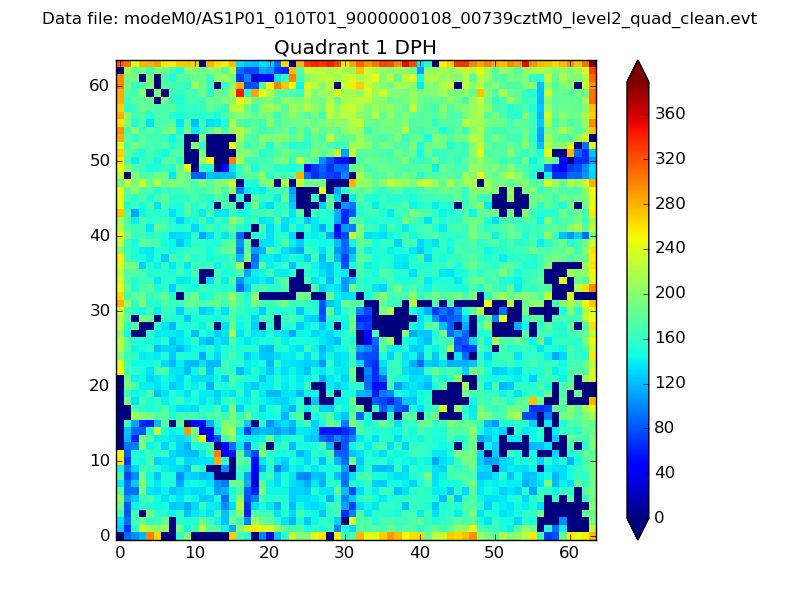 |
Quadrant B |
|---|---|---|---|
| Quadrant D | 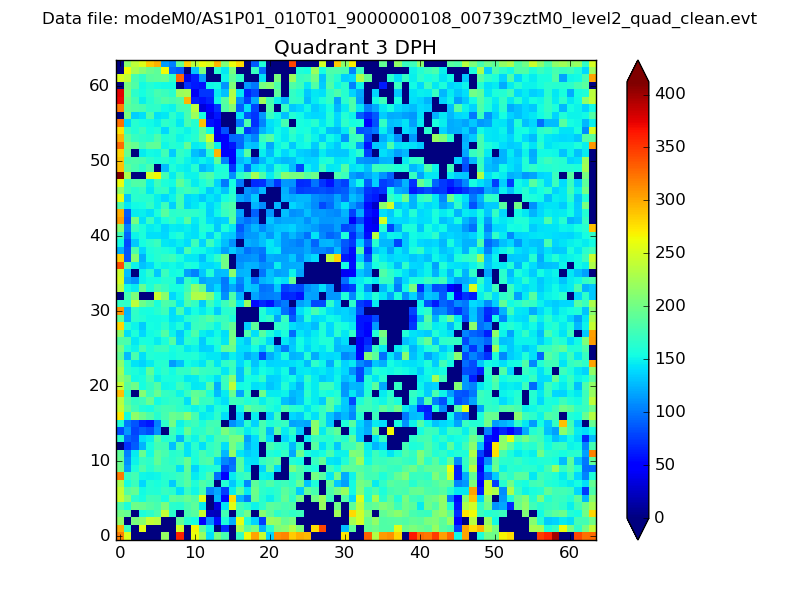 |
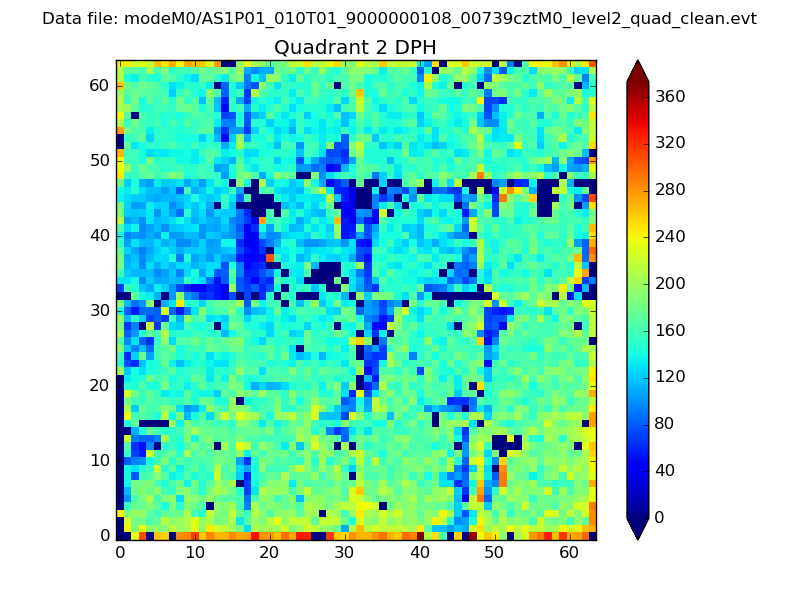 |
Quadrant C |
| Plot type | Count rate plots | Images |
|---|---|---|
| Comparison with Poisson distribution Blue bars denote a histogram of data divided into 1 sec bins. Red curve is a Poisson curve with rate = median count rate of data. |
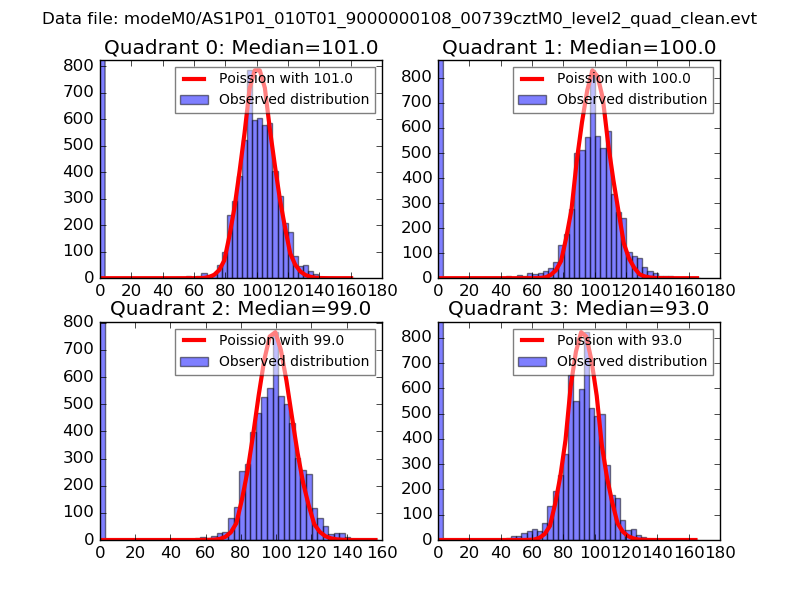 |
 |
| Quadrant-wise count rates Data is divided into 100 sec bins |
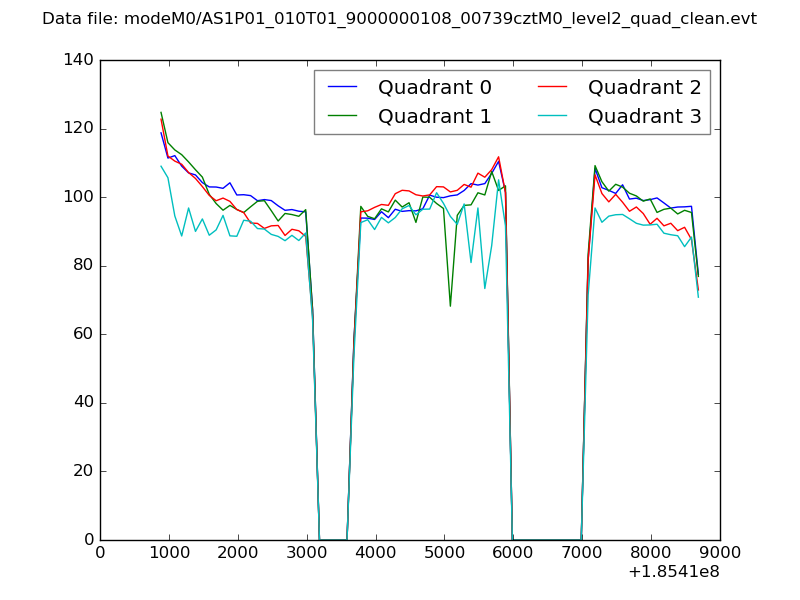 |
|
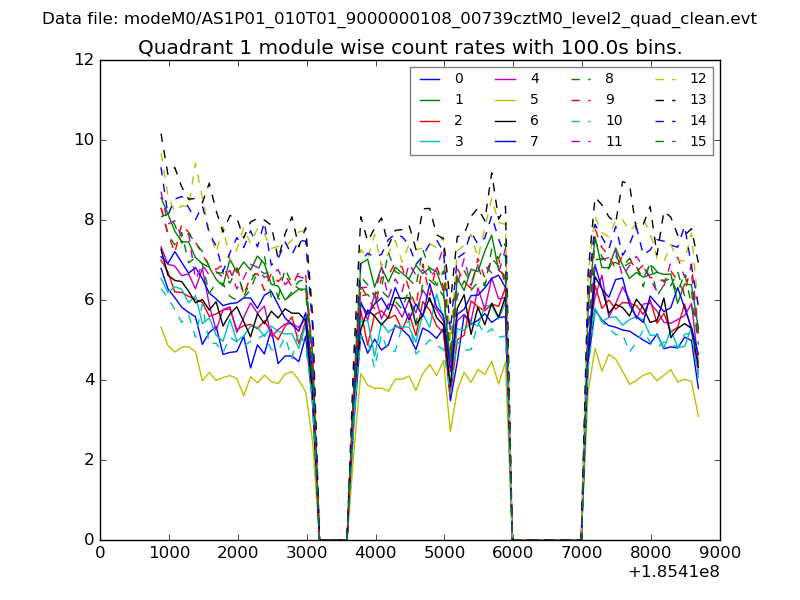
| Module-wise count rates for Quadrant A Data is divided into 100 sec bins |
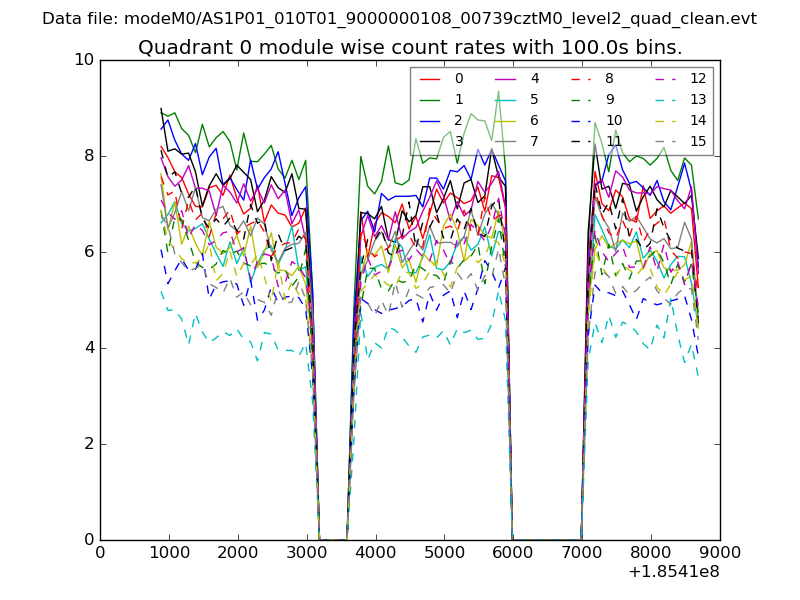 |
 |
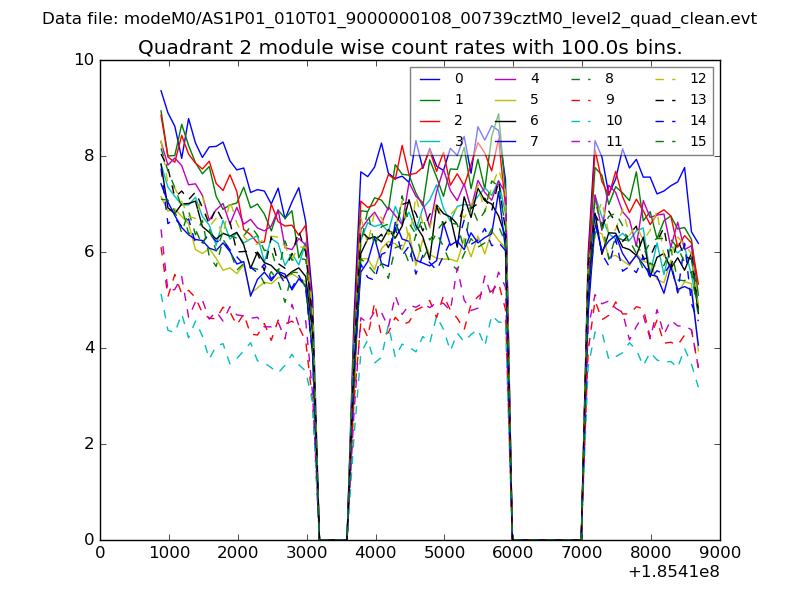
| Module-wise count rates for Quadrant B Data is divided into 100 sec bins |
 |
 |
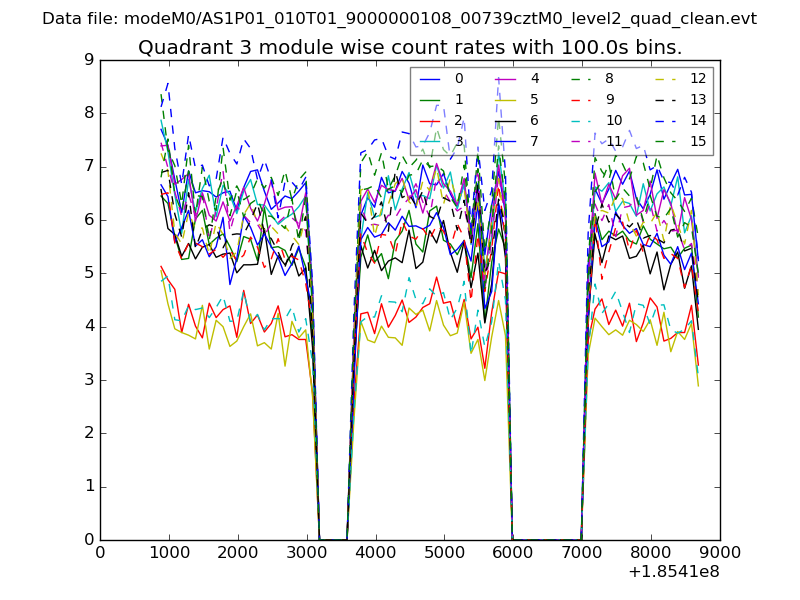
| Module-wise count rates for Quadrant C Data is divided into 100 sec bins |
 |
 |
| Module-wise count rates for Quadrant D Data is divided into 100 sec bins |
 |
 |
| Parameter | Plot |
|---|---|
| CZT HV Monitor | 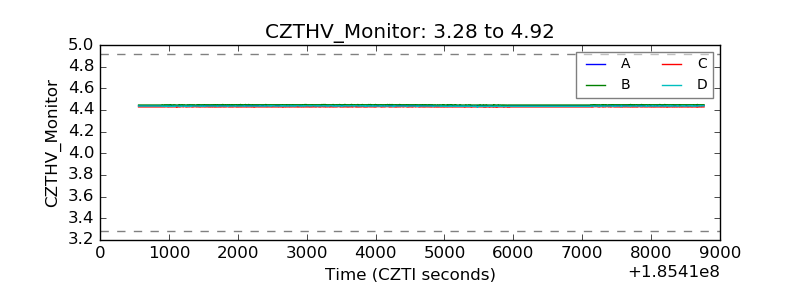 |
| D_VDD | 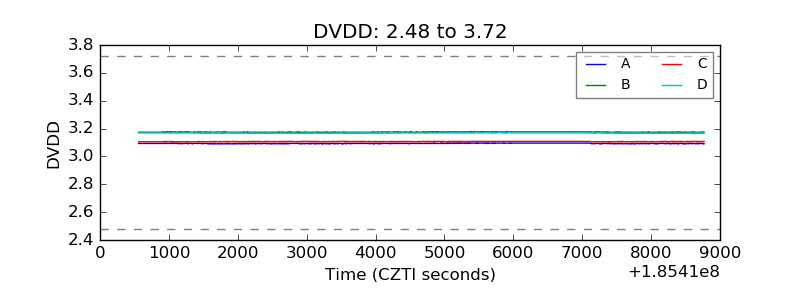 |
| Temperature 1 | 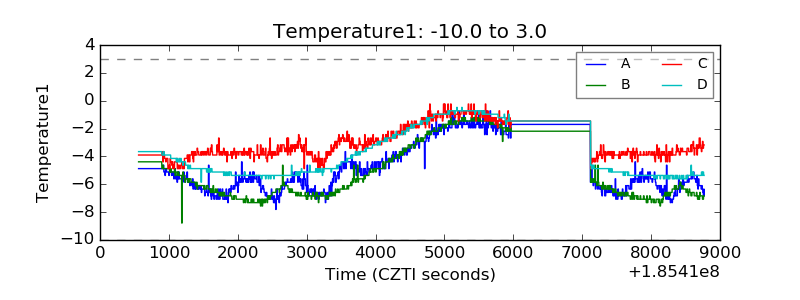 |
| Veto HV Monitor |  |
| Veto LLD | 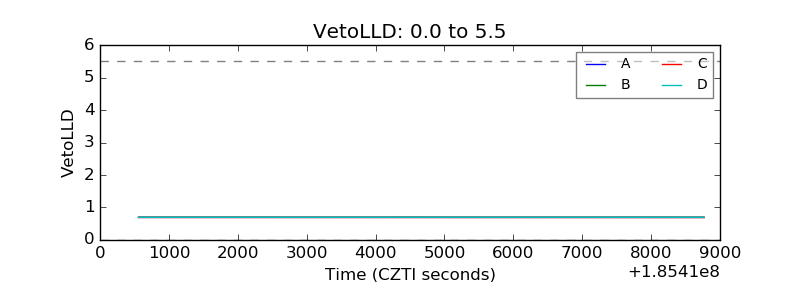 |
| Alpha Counter | 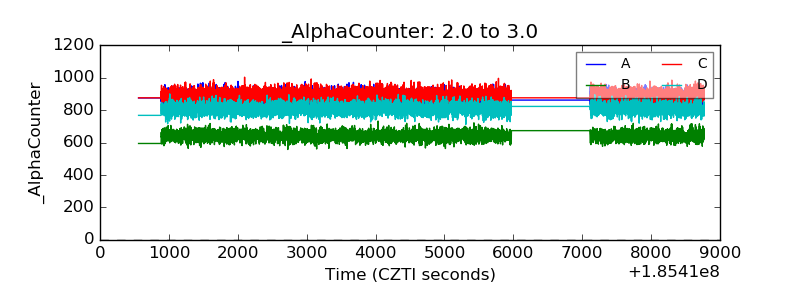 |
| _CPM_Rate | 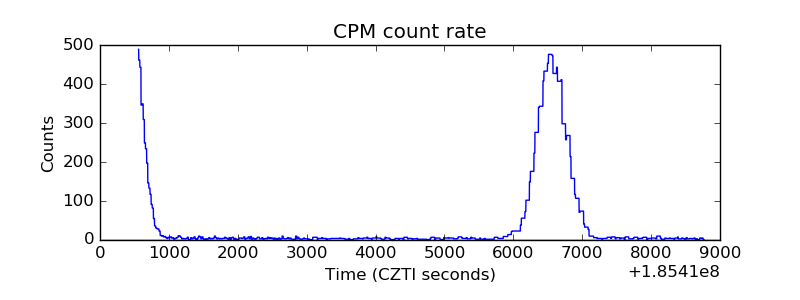 |
| CZT Counter | 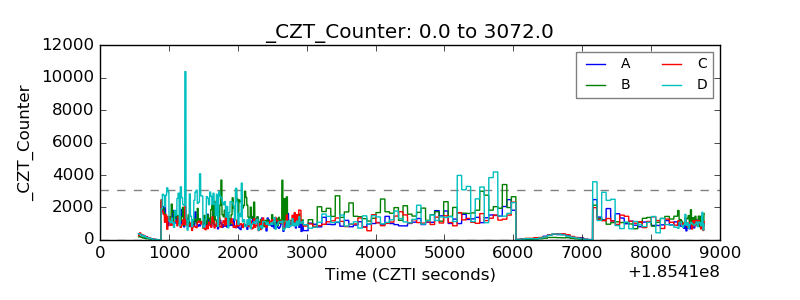 |
| +2.5 Volts monitor | 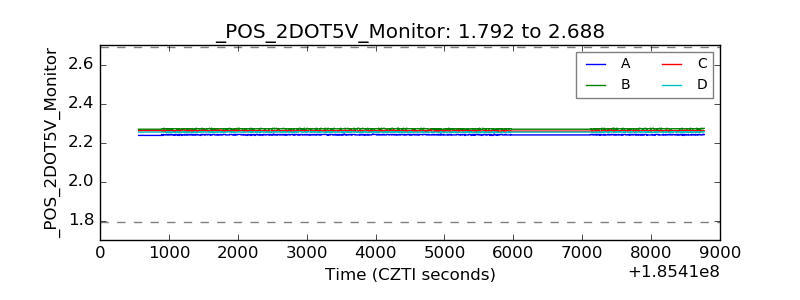 |
| +5 Volts monitor |  |
| _ROLL_ROT | 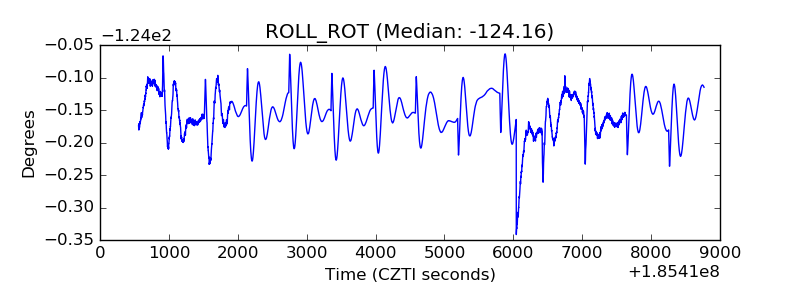 |
| _Roll_DEC | 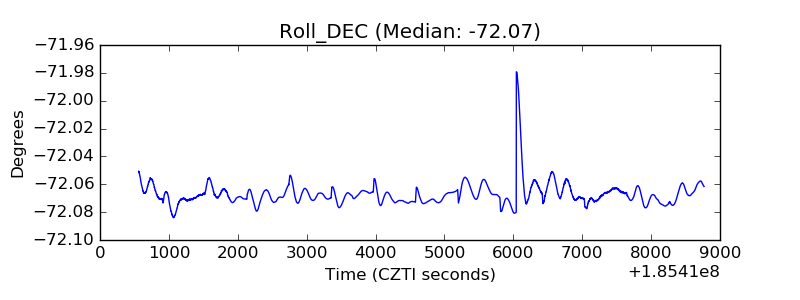 |
| _Roll_RA | 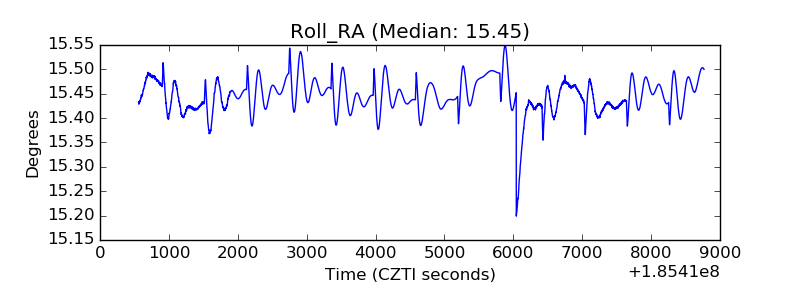 |
| Veto Counter | 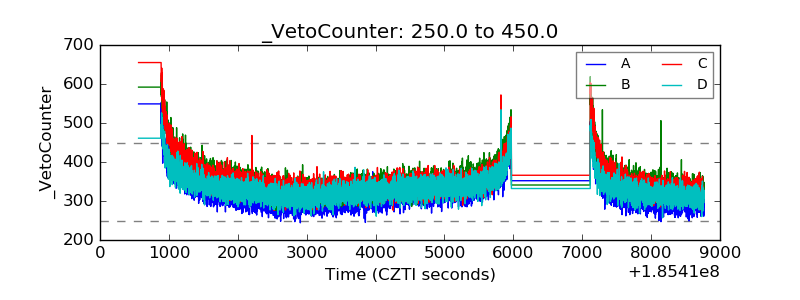 |