| Param | Original file | Final file |
|---|---|---|
| Filename | modeM0/AS1P01_010T01_9000000108_00741cztM0_level2.evt | modeM0/AS1P01_010T01_9000000108_00741cztM0_level2_quad_clean.evt |
| Size (bytes) | 474,410,880 | 35,729,280 |
| Size | 452.4 MB | 34.1 MB |
| Events in quadrant A | 3,220,173 | 220,557 |
| Events in quadrant B | 3,620,811 | 222,405 |
| Events in quadrant C | 3,294,632 | 220,625 |
| Events in quadrant D | 4,035,638 | 208,831 |
| Mode SS | |||
|---|---|---|---|
| Quadrant | BADHDUFLAG | Total packets | Discarded packets |
| A | 0 | 58 | 0 |
| B | 0 | 58 | 0 |
| C | 0 | 58 | 0 |
| D | 0 | 58 | 0 |
| Mode M0 | |||
|---|---|---|---|
| Quadrant | BADHDUFLAG | Total packets | Discarded packets |
| A | 0 | 11636 | 0 |
| B | 0 | 12852 | 0 |
| C | 0 | 11852 | 0 |
| D | 0 | 14085 | 0 |
| Quadrant | Total seconds | Saturated seconds | Saturation percentage |
|---|---|---|---|
| A | 2931 | 0 | 0.000000% |
| B | 2932 | 72 | 2.455662% |
| C | 2932 | 0 | 0.000000% |
| D | 2932 | 77 | 2.626194% |
Noise dominated data is calculated using 1-second bins in cleaned event files. If a bin has >2000 counts, and if more than 50% of those come from <1% of pixels, then it is considered to be noise-dominated and hence unusable.
| Quadrant | # 1 sec bins | Bins with >0 counts | Bins with >2000 counts | High rate bins dominated by noise | Noise dominated (total time) | Noise dominated (detector-on time) | Marked lightcurve |
|---|---|---|---|---|---|---|---|
| A | 2931 | 2931 | 10 | 10 | 0.34% | 0.34% | 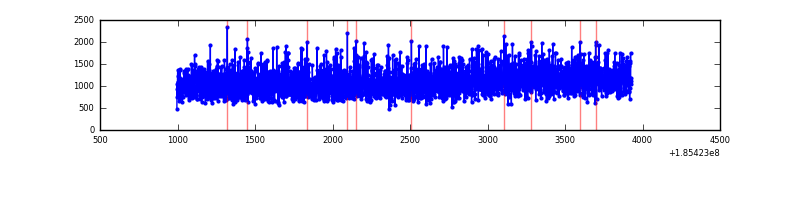 |
| B | 2932 | 2932 | 147 | 147 | 5.01% | 5.01% | 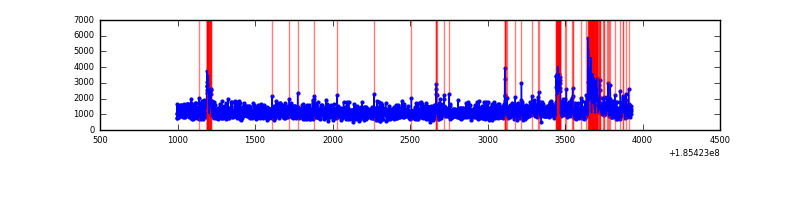 |
| C | 2932 | 2932 | 14 | 14 | 0.48% | 0.48% | 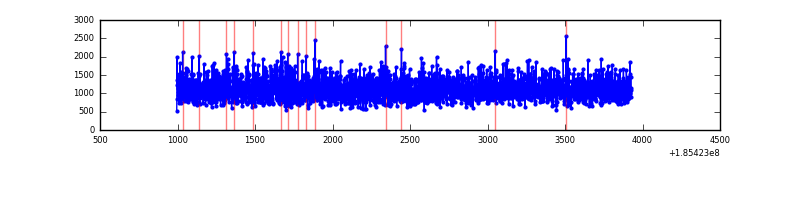 |
| D | 2932 | 2932 | 390 | 390 | 13.30% | 13.30% | 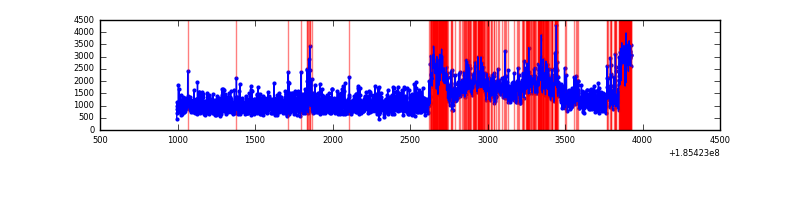 |
Top three noisy pixels from each quadrant. If the there are fewer than three noisy pixels in the level2.evt file, extra rows are filled as -1
| Pixel properties | Quadrant properties | ||||||
|---|---|---|---|---|---|---|---|
| Quadrant | DetID | PixID | Counts | Sigma | Mean | Median | Sigma |
| A | 11 | 79 | 3112 | 11.19 | 838 | 844 | 202.8 |
| A | 3 | 111 | 2551 | 8.42 | 838 | 844 | 202.8 |
| A | 12 | 189 | 2259 | 6.98 | 838 | 844 | 202.8 |
| B | 8 | 38 | 267784 | 1298.87 | 863 | 867 | 205.5 |
| B | 7 | 221 | 51247 | 245.16 | 863 | 867 | 205.5 |
| B | 5 | 191 | 12017 | 54.26 | 863 | 867 | 205.5 |
| C | 15 | 241 | 18974 | 78.48 | 829 | 855 | 230.9 |
| C | 3 | 111 | 12658 | 51.12 | 829 | 855 | 230.9 |
| C | 9 | 52 | 11744 | 47.17 | 829 | 855 | 230.9 |
| D | 6 | 226 | 681910 | 2729.94 | 803 | 830 | 249.5 |
| D | 13 | 25 | 157916 | 629.64 | 803 | 830 | 249.5 |
| D | 1 | 4 | 81257 | 322.37 | 803 | 830 | 249.5 |
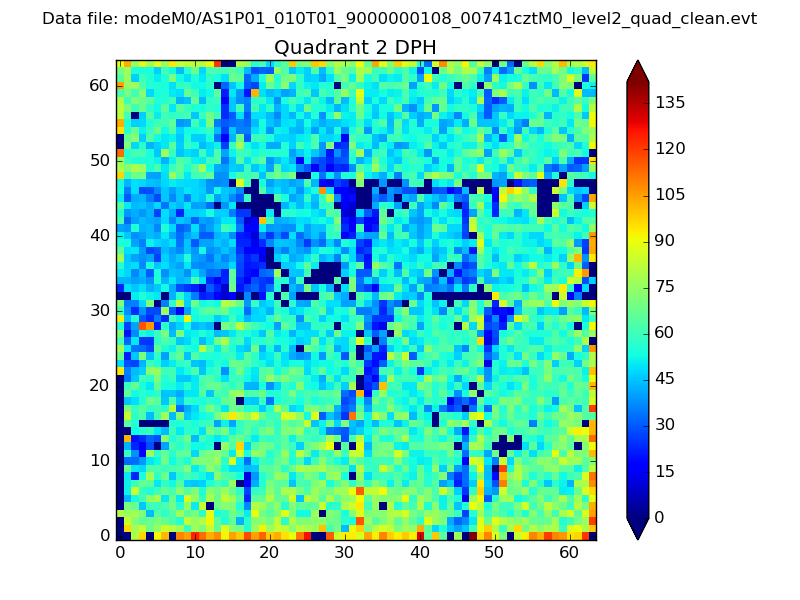
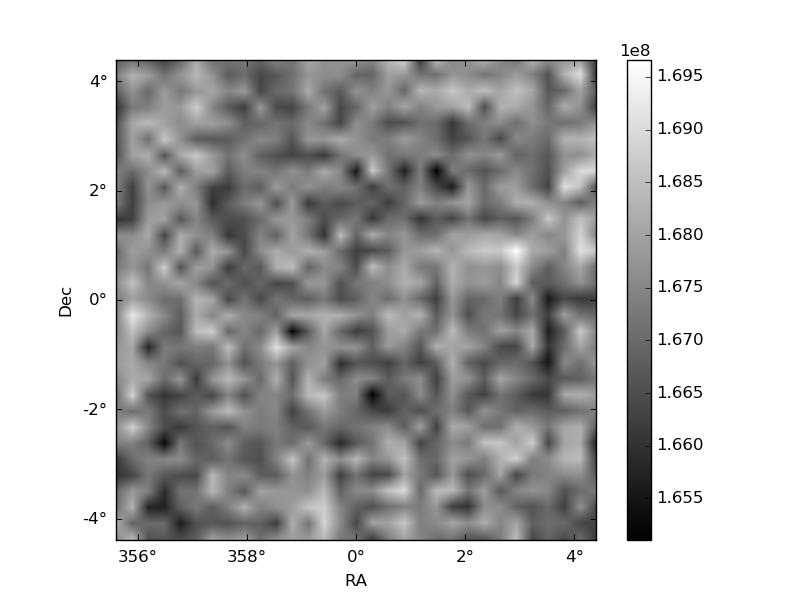
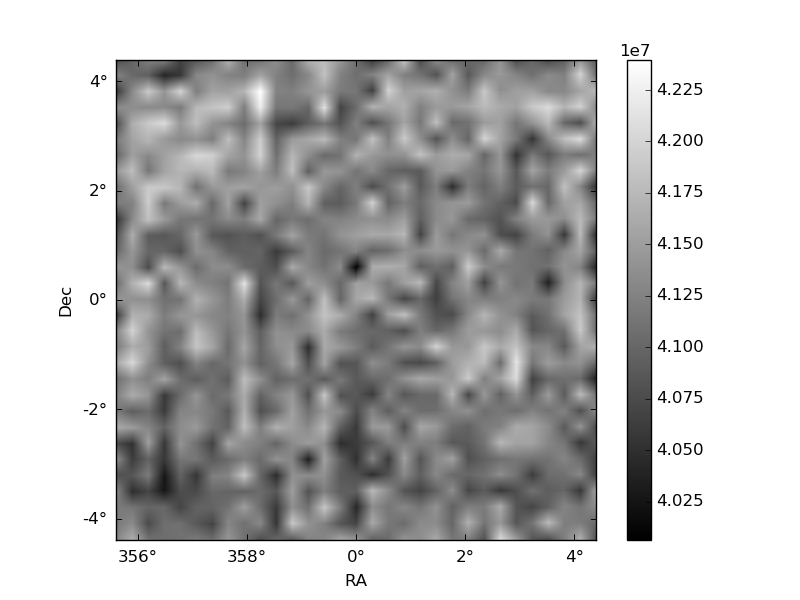
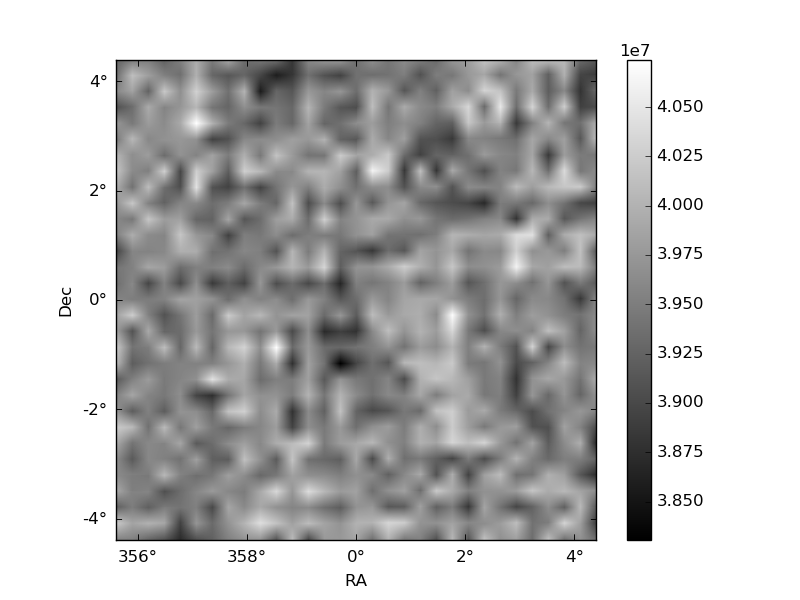
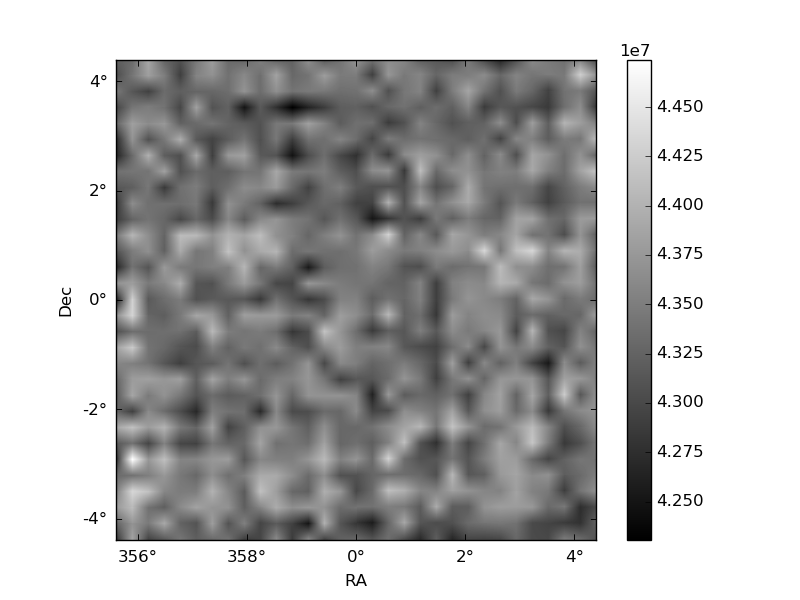
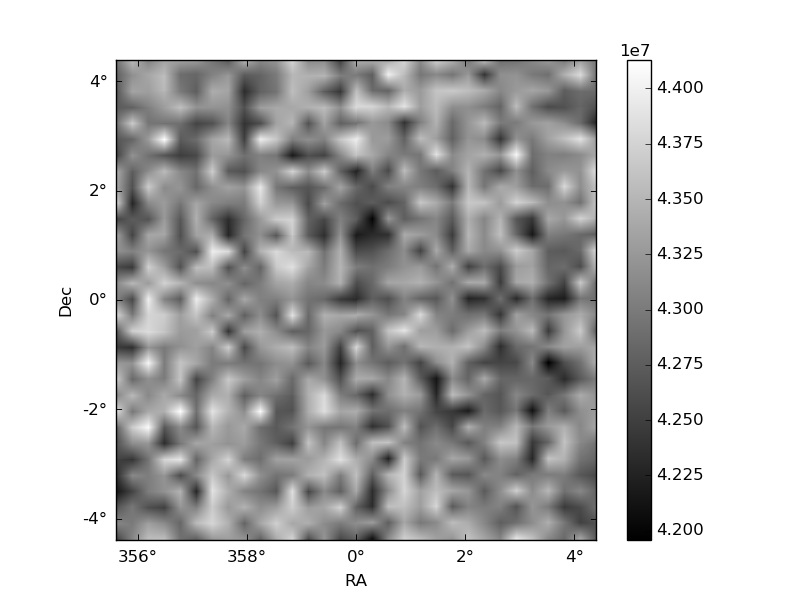
Histogram calculated using DETX and DETY for each event in the final _common_clean file
| Quadrant A | 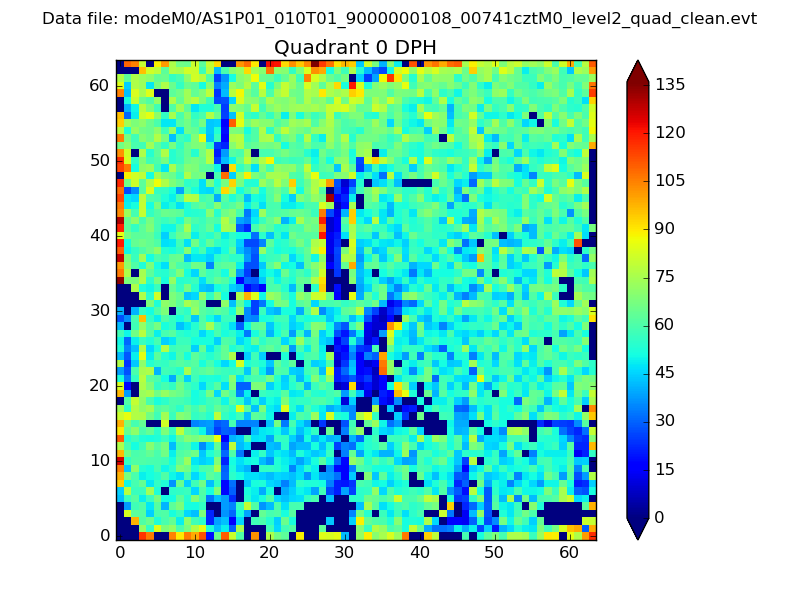 |
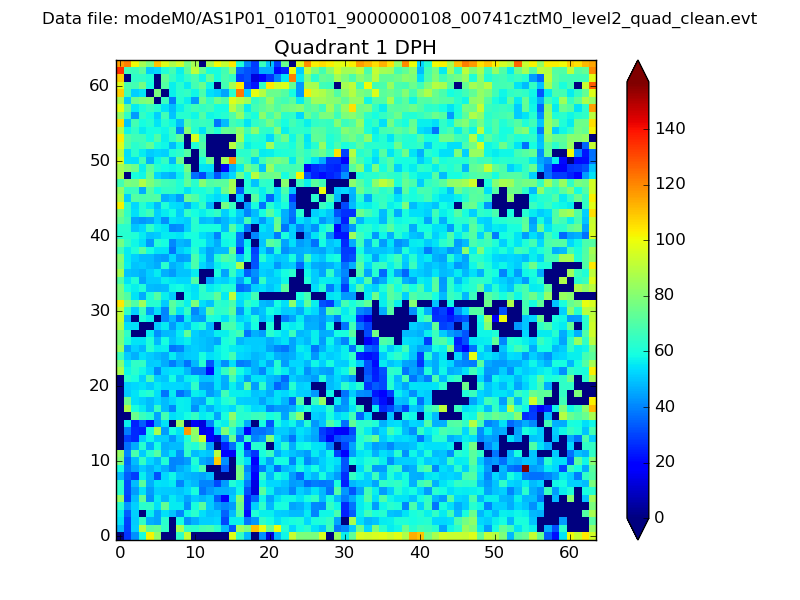 |
Quadrant B |
|---|---|---|---|
| Quadrant D | 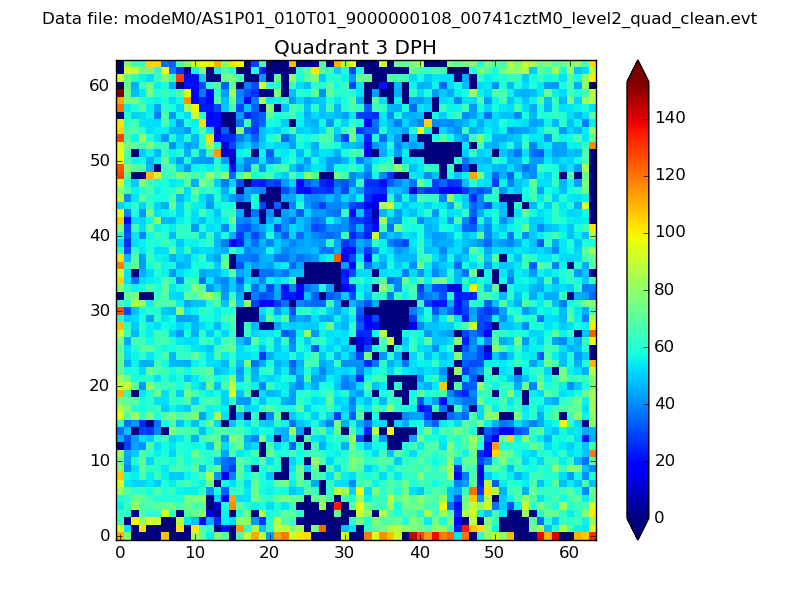 |
 |
Quadrant C |
| Plot type | Count rate plots | Images |
|---|---|---|
| Comparison with Poisson distribution Blue bars denote a histogram of data divided into 1 sec bins. Red curve is a Poisson curve with rate = median count rate of data. |
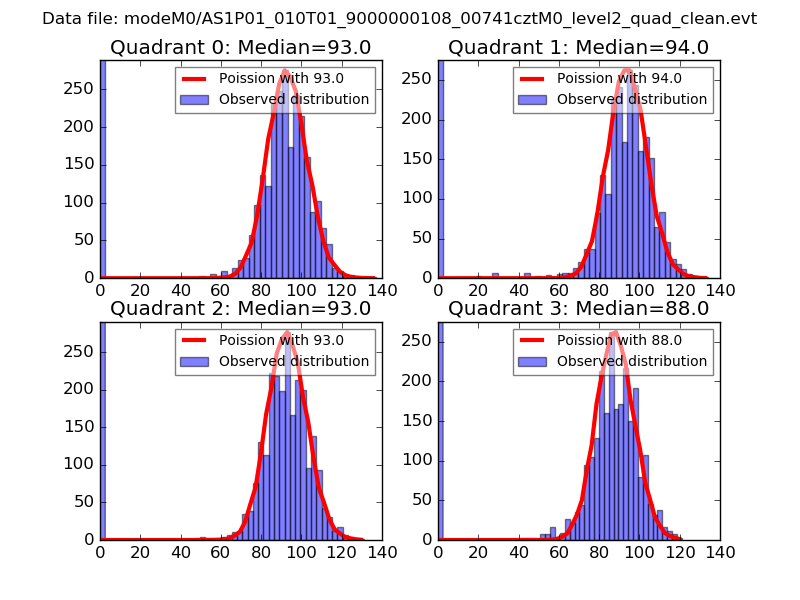 |
 |
| Quadrant-wise count rates Data is divided into 100 sec bins |
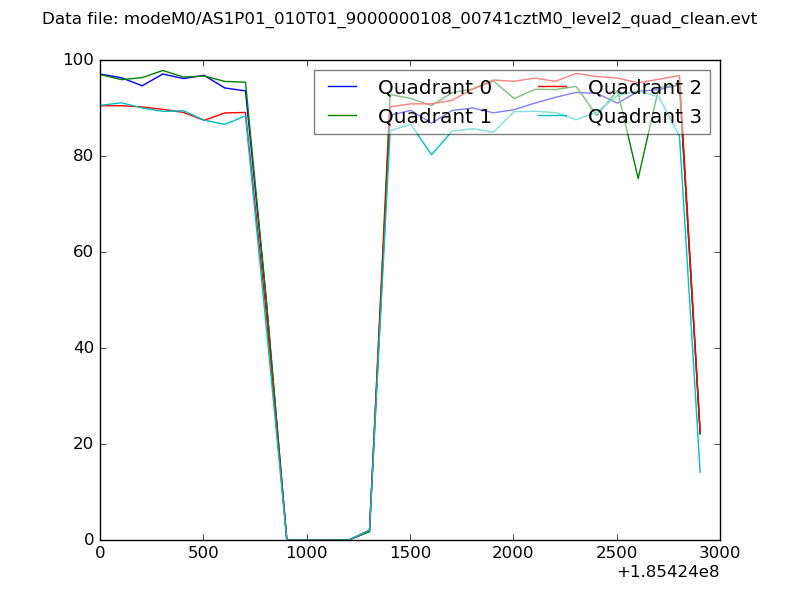 |
|
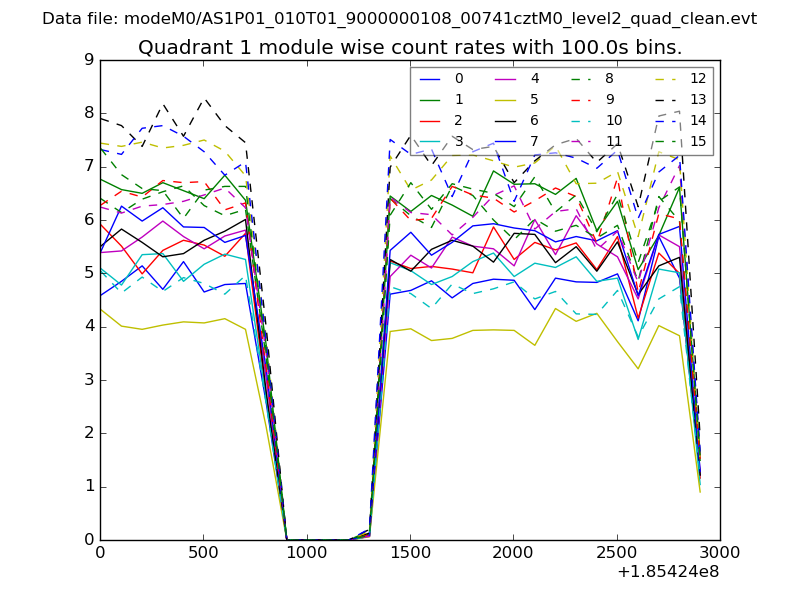
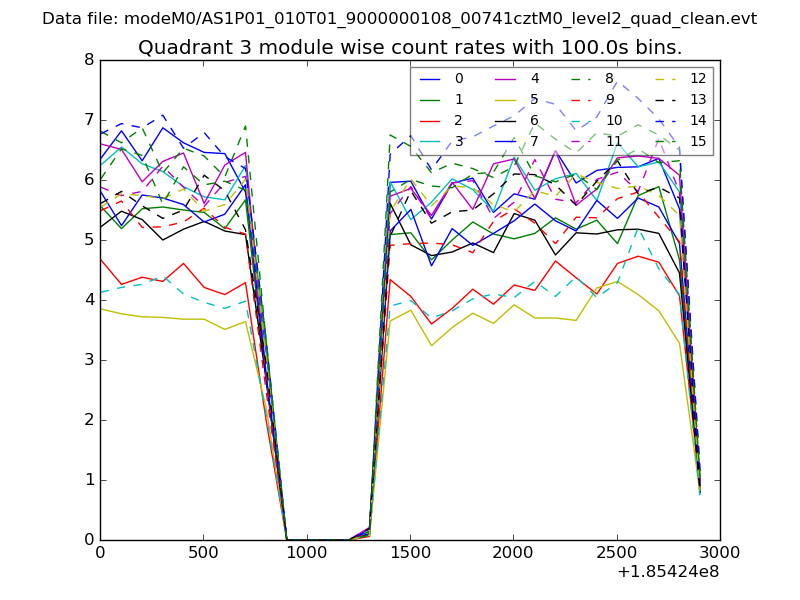
| Module-wise count rates for Quadrant A Data is divided into 100 sec bins |
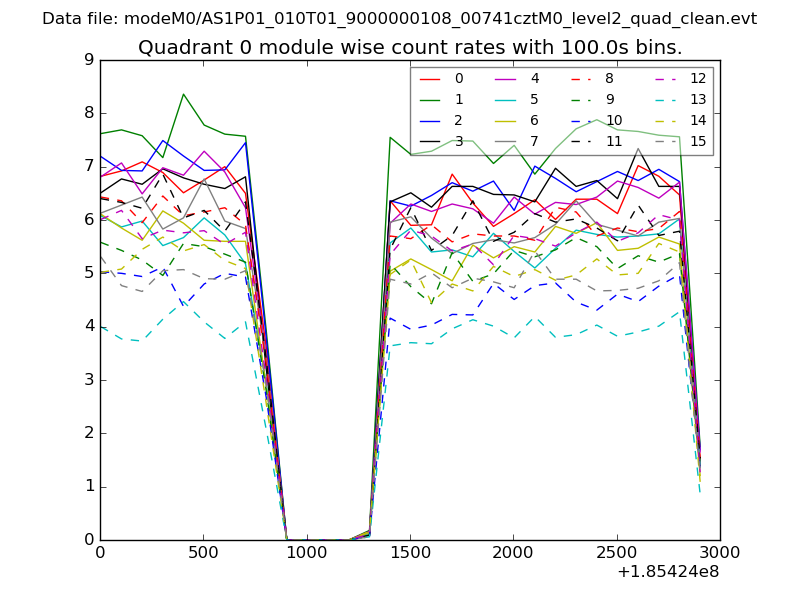 |
 |
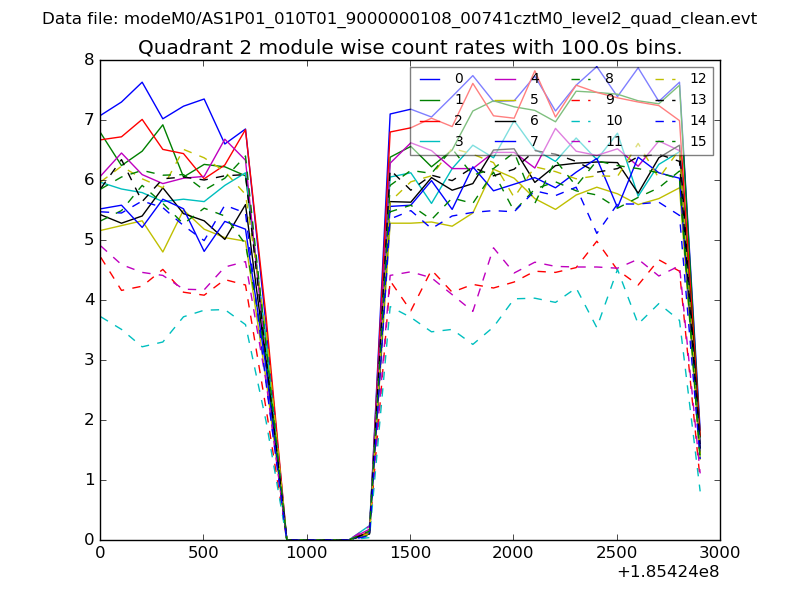
| Module-wise count rates for Quadrant B Data is divided into 100 sec bins |
 |
 |
| Module-wise count rates for Quadrant C Data is divided into 100 sec bins |
 |
 |
| Module-wise count rates for Quadrant D Data is divided into 100 sec bins |
 |
 |
| Parameter | Plot |
|---|---|
| CZT HV Monitor | 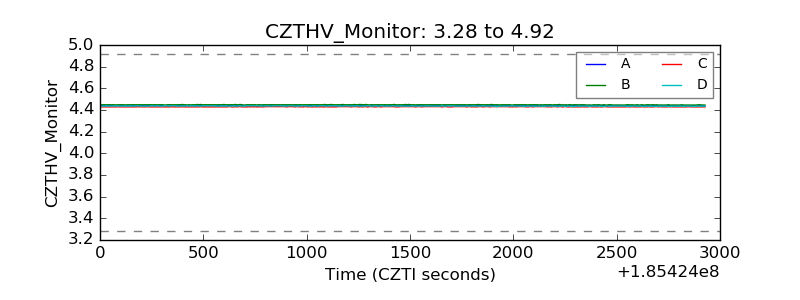 |
| D_VDD | 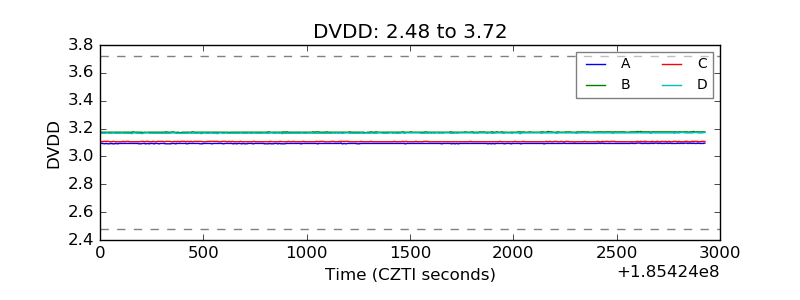 |
| Temperature 1 | 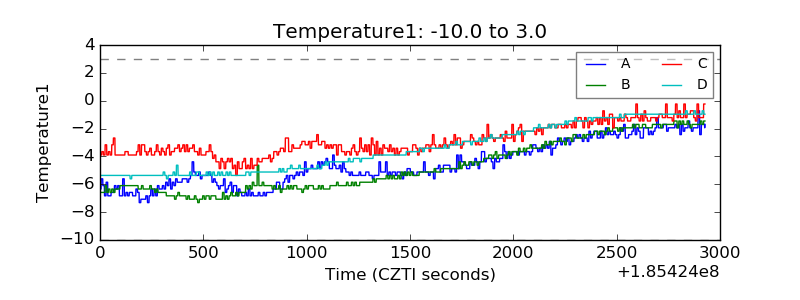 |
| Veto HV Monitor | 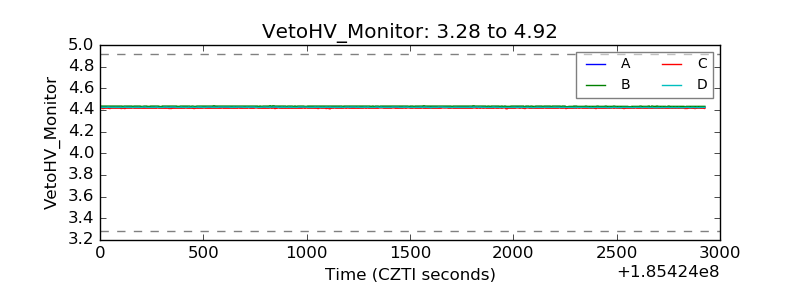 |
| Veto LLD | 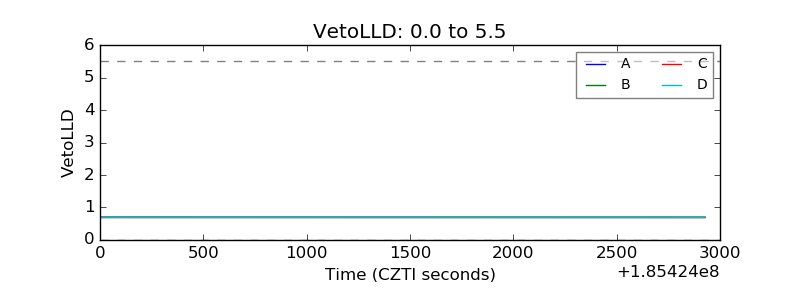 |
| Alpha Counter | 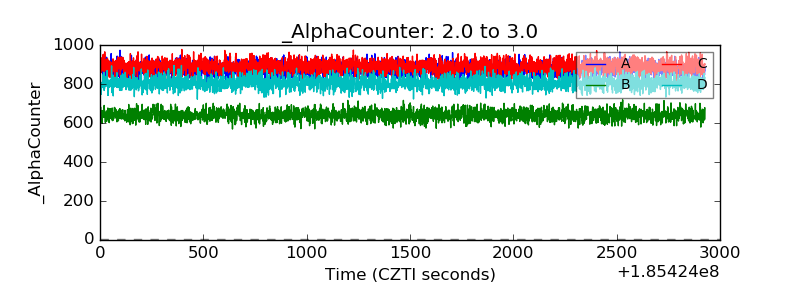 |
| _CPM_Rate | 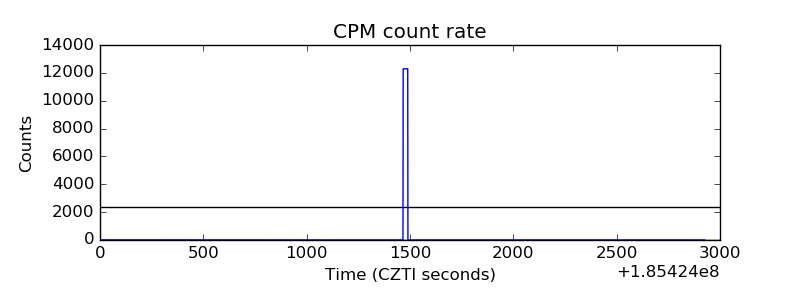 |
| CZT Counter | 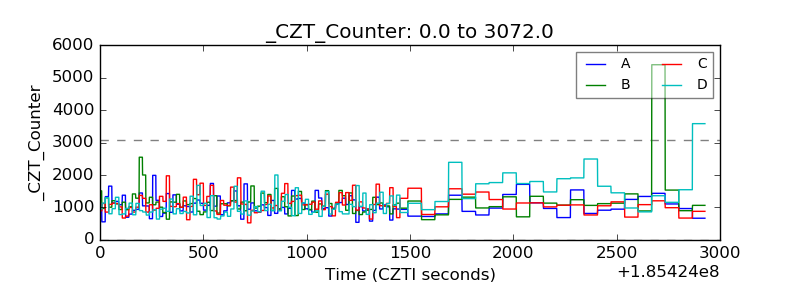 |
| +2.5 Volts monitor |  |
| +5 Volts monitor |  |
| _ROLL_ROT | 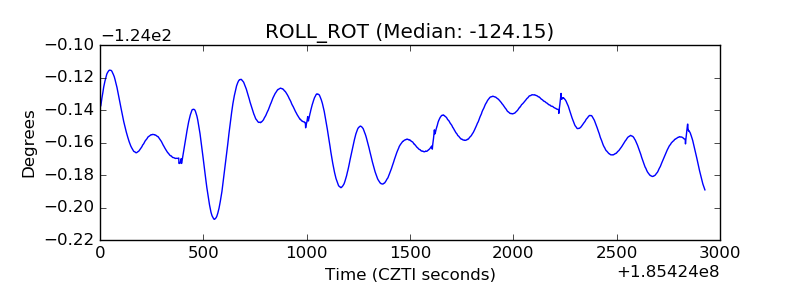 |
| _Roll_DEC | 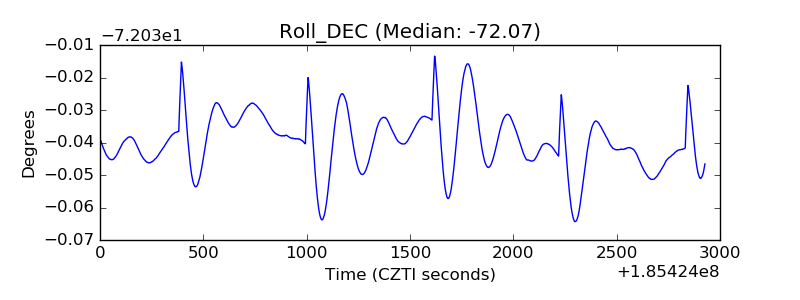 |
| _Roll_RA | 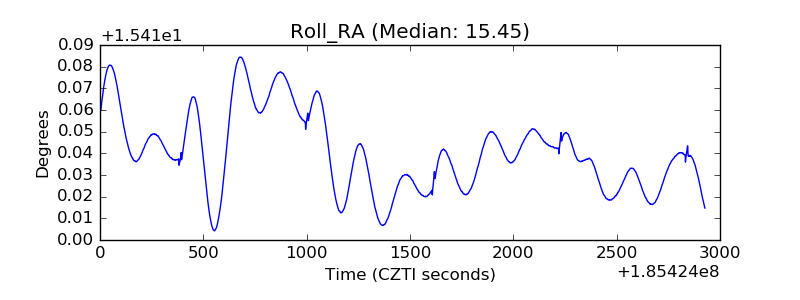 |
| Veto Counter | 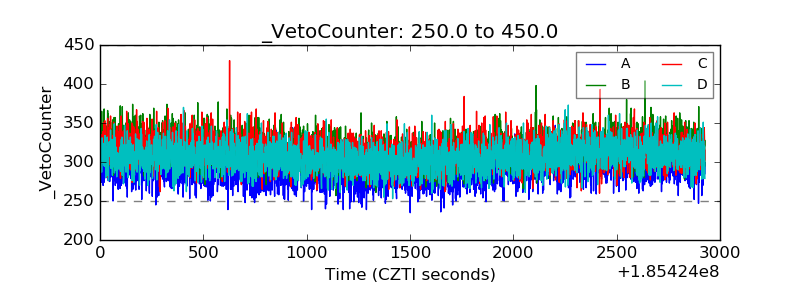 |