| Param | Original file | Final file |
|---|---|---|
| Filename | modeM0/AS1P01_010T01_9000000108_00742cztM0_level2.evt | modeM0/AS1P01_010T01_9000000108_00742cztM0_level2_quad_clean.evt |
| Size (bytes) | 1,326,029,760 | 95,544,000 |
| Size | 1.2 GB | 91.1 MB |
| Events in quadrant A | 8,981,949 | 607,364 |
| Events in quadrant B | 9,970,334 | 610,708 |
| Events in quadrant C | 8,922,192 | 601,098 |
| Events in quadrant D | 11,796,826 | 559,846 |
| Mode SS | |||
|---|---|---|---|
| Quadrant | BADHDUFLAG | Total packets | Discarded packets |
| A | 0 | 148 | 0 |
| B | 0 | 148 | 0 |
| C | 0 | 148 | 0 |
| D | 0 | 148 | 0 |
| Mode M0 | |||
|---|---|---|---|
| Quadrant | BADHDUFLAG | Total packets | Discarded packets |
| A | 0 | 31871 | 0 |
| B | 0 | 34837 | 0 |
| C | 0 | 31701 | 0 |
| D | 0 | 40332 | 0 |
| Quadrant | Total seconds | Saturated seconds | Saturation percentage |
|---|---|---|---|
| A | 7388 | 45 | 0.609096% |
| B | 7388 | 107 | 1.448295% |
| C | 7388 | 33 | 0.446670% |
| D | 7388 | 594 | 8.040065% |
Noise dominated data is calculated using 1-second bins in cleaned event files. If a bin has >2000 counts, and if more than 50% of those come from <1% of pixels, then it is considered to be noise-dominated and hence unusable.
| Quadrant | # 1 sec bins | Bins with >0 counts | Bins with >2000 counts | High rate bins dominated by noise | Noise dominated (total time) | Noise dominated (detector-on time) | Marked lightcurve |
|---|---|---|---|---|---|---|---|
| A | 7388 | 7388 | 417 | 417 | 5.64% | 5.64% | 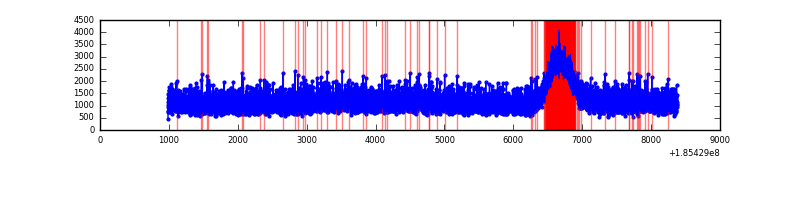 |
| B | 7388 | 7388 | 687 | 687 | 9.30% | 9.30% | 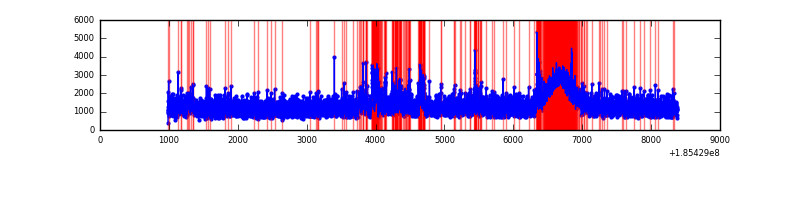 |
| C | 7388 | 7388 | 417 | 417 | 5.64% | 5.64% | 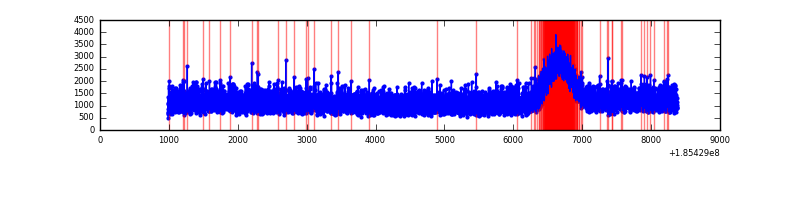 |
| D | 7388 | 7388 | 1800 | 1800 | 24.36% | 24.36% | 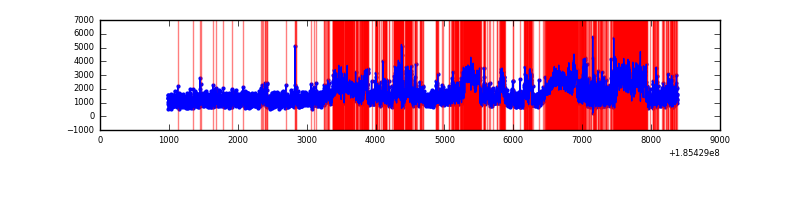 |
Top three noisy pixels from each quadrant. If the there are fewer than three noisy pixels in the level2.evt file, extra rows are filled as -1
| Pixel properties | Quadrant properties | ||||||
|---|---|---|---|---|---|---|---|
| Quadrant | DetID | PixID | Counts | Sigma | Mean | Median | Sigma |
| A | 15 | 233 | 14255 | 20.94 | 2334 | 2347 | 568.8 |
| A | 11 | 79 | 9853 | 13.2 | 2334 | 2347 | 568.8 |
| A | 12 | 189 | 8527 | 10.87 | 2334 | 2347 | 568.8 |
| B | 8 | 38 | 456095 | 784.05 | 2439 | 2446 | 578.6 |
| B | 5 | 191 | 101173 | 170.63 | 2439 | 2446 | 578.6 |
| B | 7 | 221 | 48352 | 79.34 | 2439 | 2446 | 578.6 |
| C | 3 | 111 | 45393 | 68.2 | 2250 | 2323 | 631.5 |
| C | 15 | 241 | 41467 | 61.98 | 2250 | 2323 | 631.5 |
| C | 3 | 79 | 34212 | 50.5 | 2250 | 2323 | 631.5 |
| D | 7 | 207 | 1318759 | 1989.24 | 2127 | 2203 | 661.8 |
| D | 10 | 85 | 1062864 | 1602.59 | 2127 | 2203 | 661.8 |
| D | 13 | 25 | 830248 | 1251.13 | 2127 | 2203 | 661.8 |
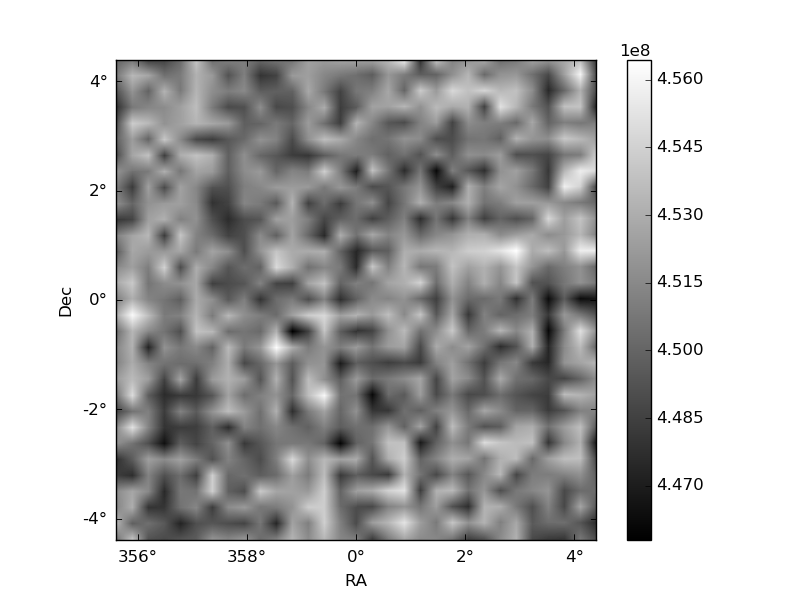
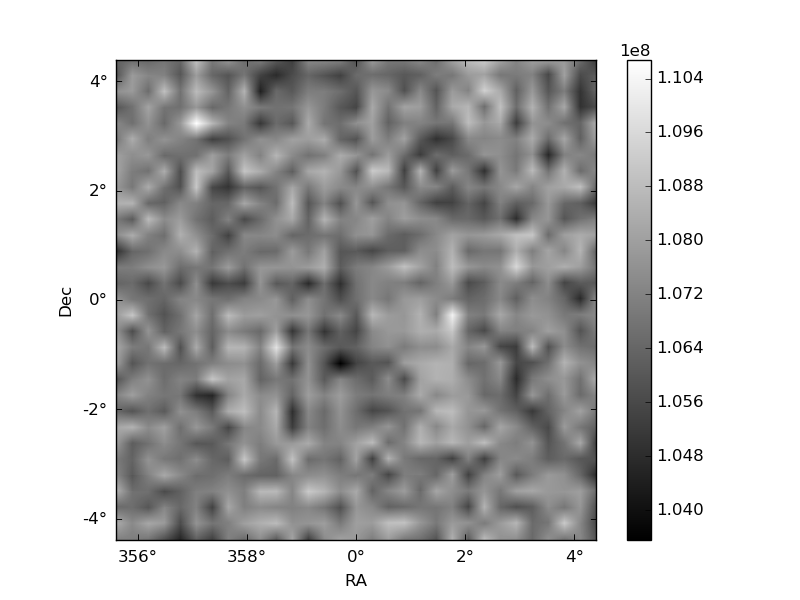
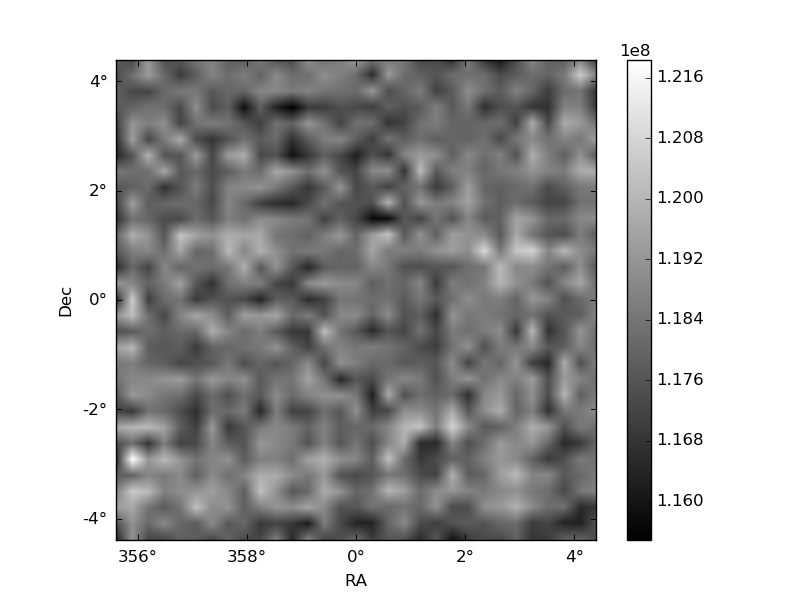
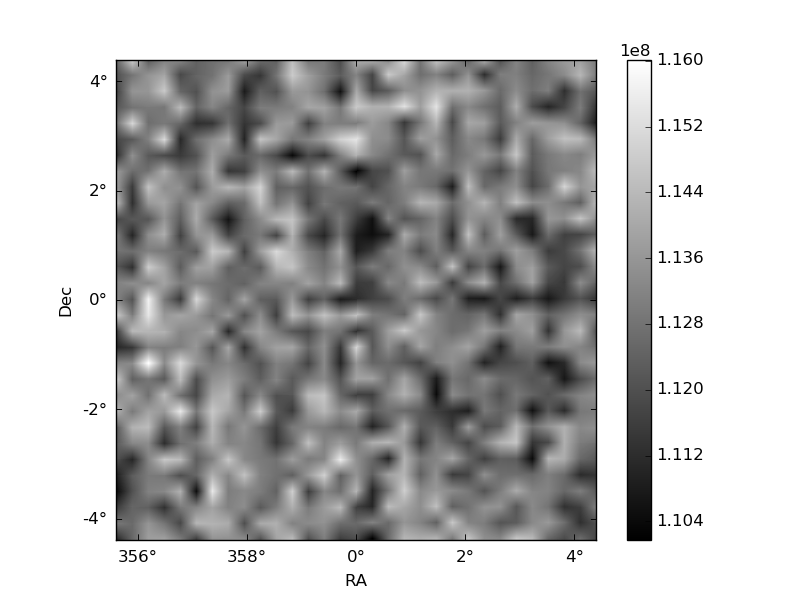
Histogram calculated using DETX and DETY for each event in the final _common_clean file
| Quadrant A | 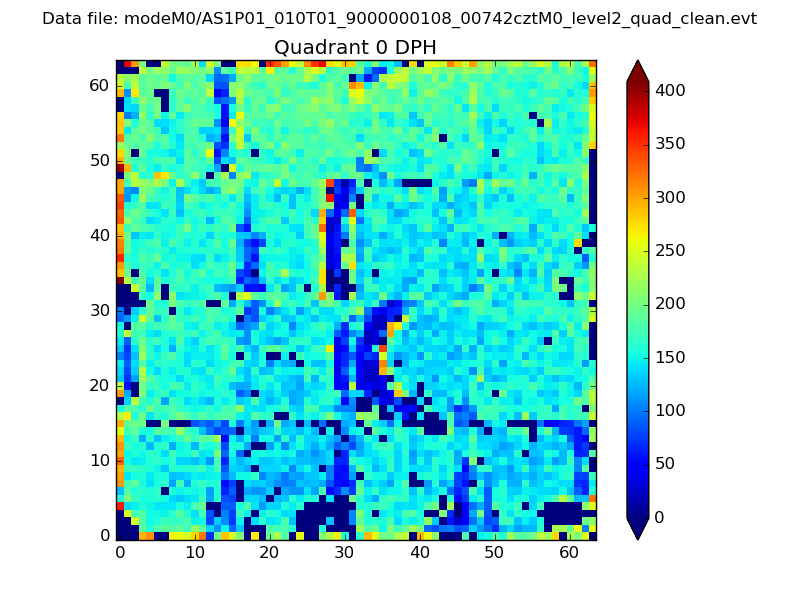 |
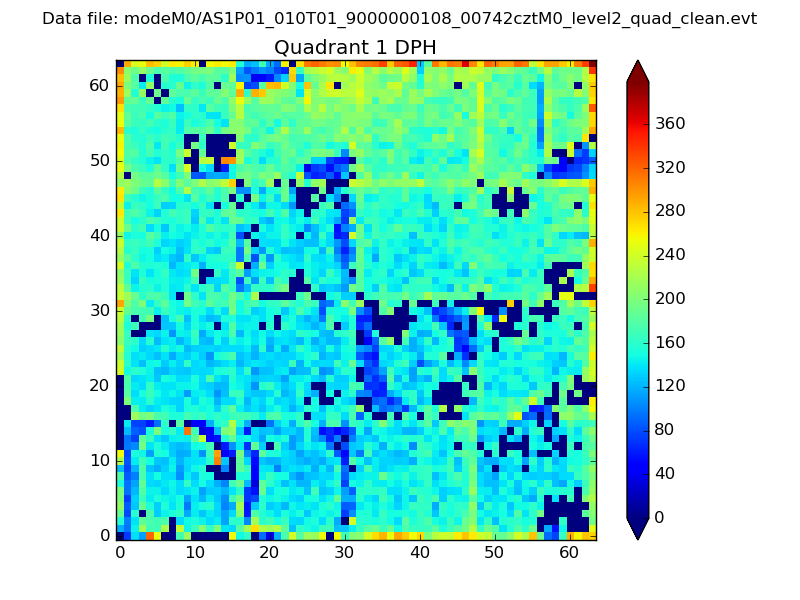 |
Quadrant B |
|---|---|---|---|
| Quadrant D |  |
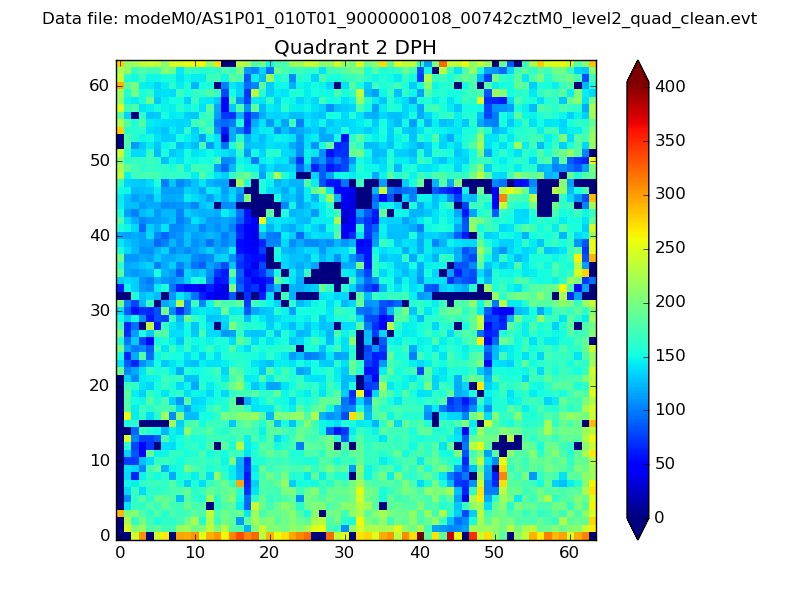 |
Quadrant C |
| Plot type | Count rate plots | Images |
|---|---|---|
| Comparison with Poisson distribution Blue bars denote a histogram of data divided into 1 sec bins. Red curve is a Poisson curve with rate = median count rate of data. |
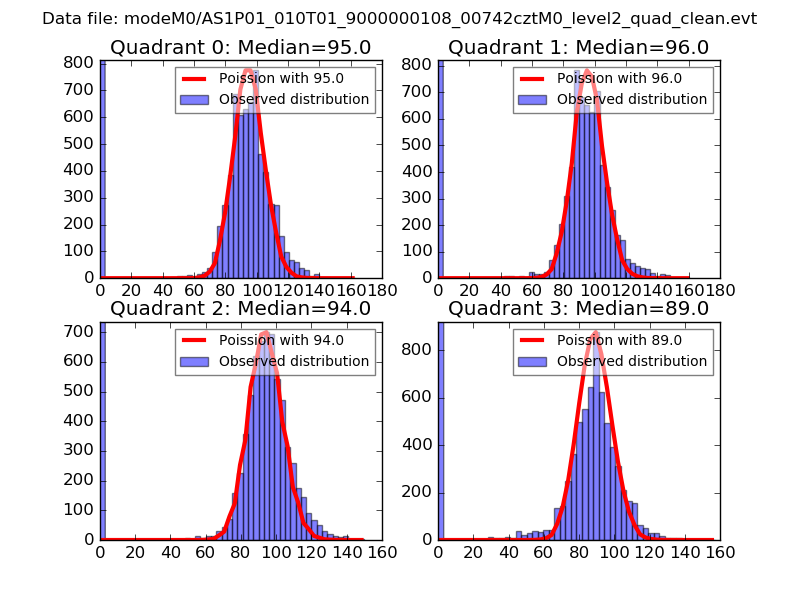 |
 |
| Quadrant-wise count rates Data is divided into 100 sec bins |
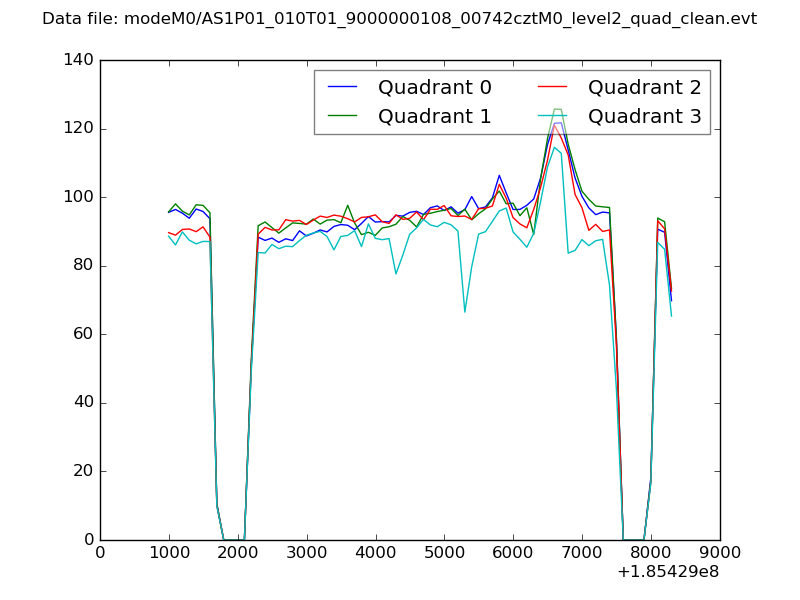 |
|
| Module-wise count rates for Quadrant A Data is divided into 100 sec bins |
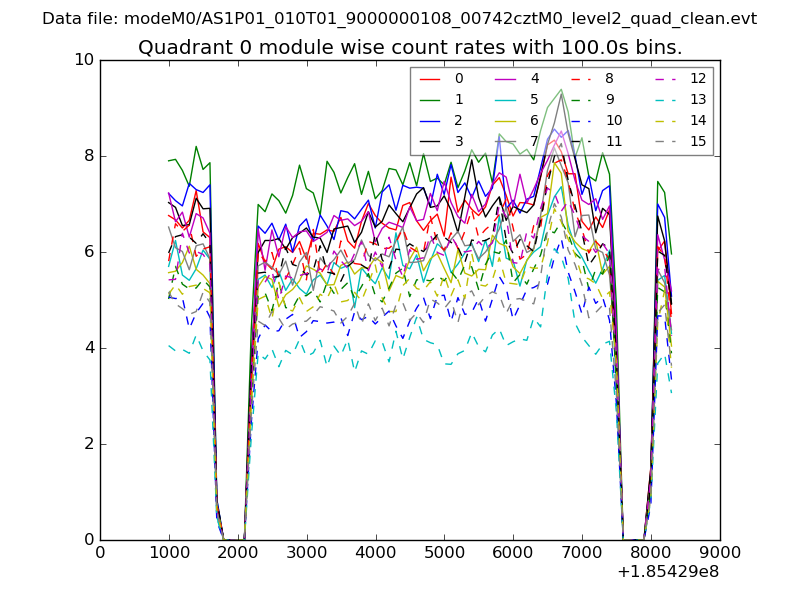 |
 |
| Module-wise count rates for Quadrant B Data is divided into 100 sec bins |
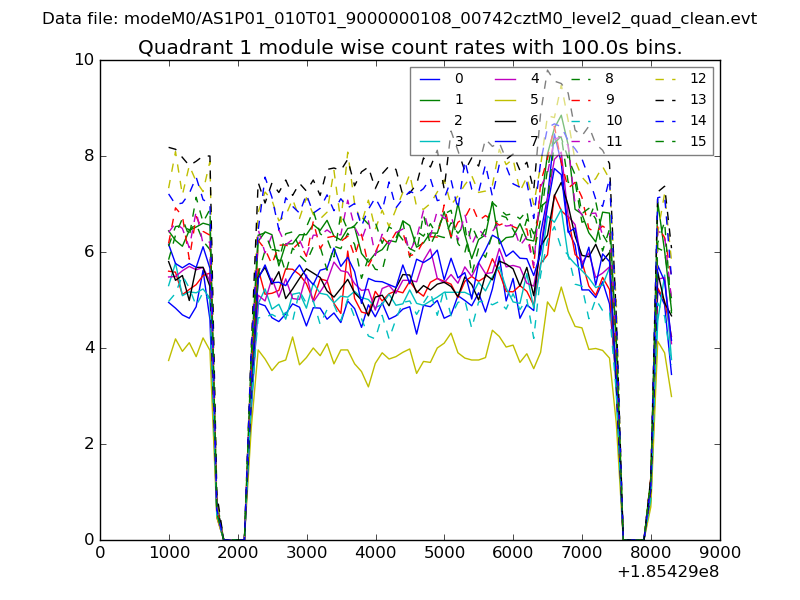 |
 |
| Module-wise count rates for Quadrant C Data is divided into 100 sec bins |
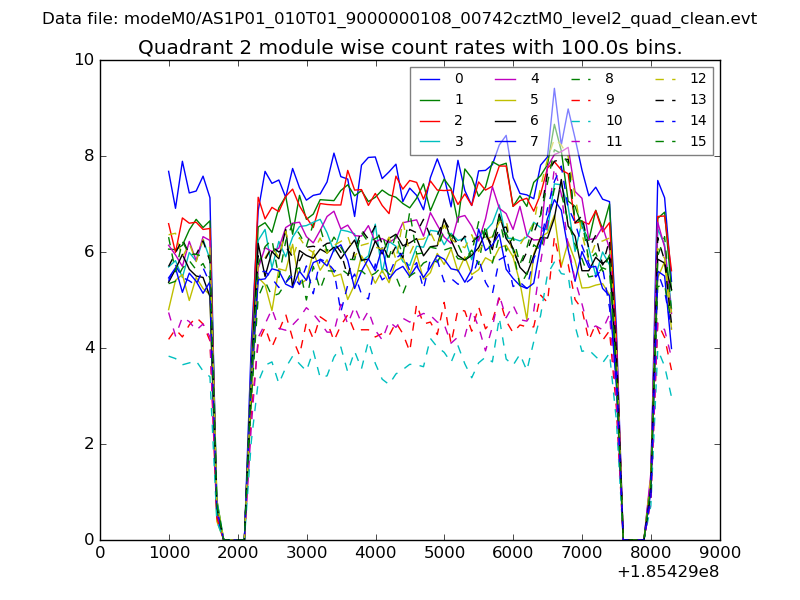 |
 |
| Module-wise count rates for Quadrant D Data is divided into 100 sec bins |
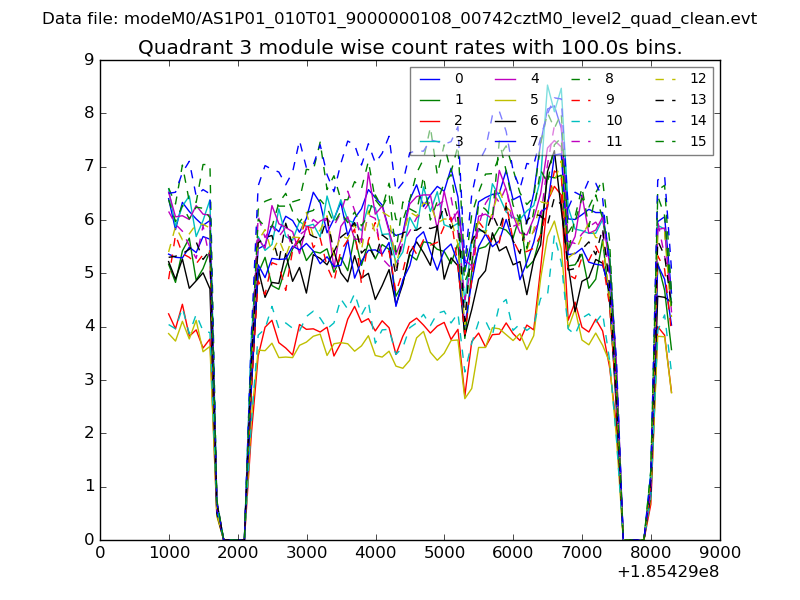 |
 |
| Parameter | Plot |
|---|---|
| CZT HV Monitor | 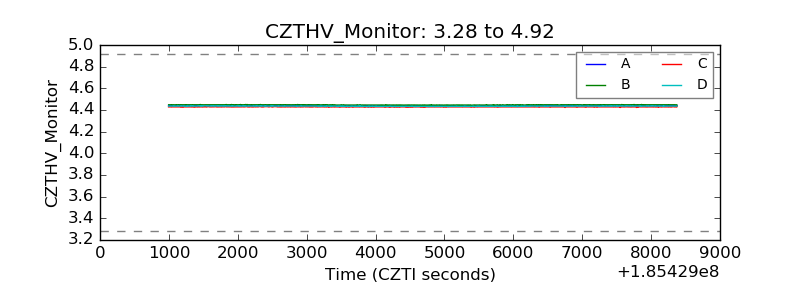 |
| D_VDD | 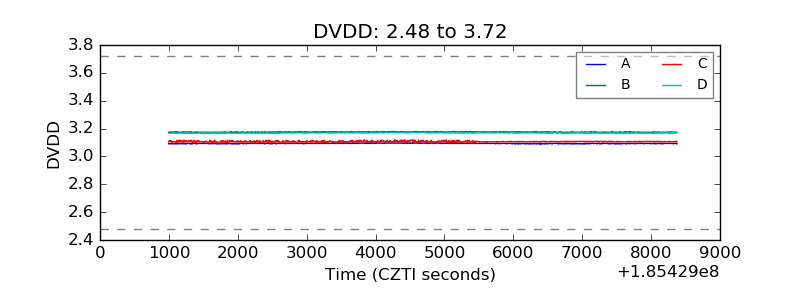 |
| Temperature 1 | 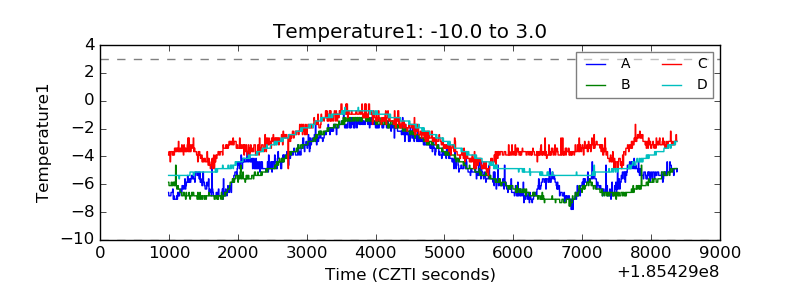 |
| Veto HV Monitor | 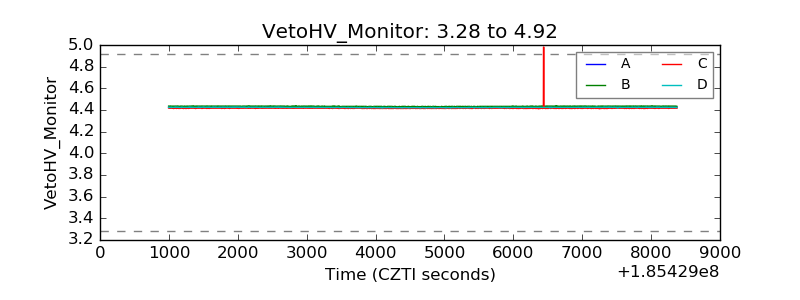 |
| Veto LLD | 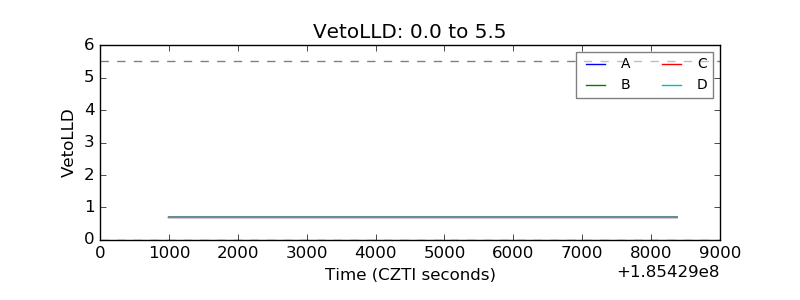 |
| Alpha Counter | 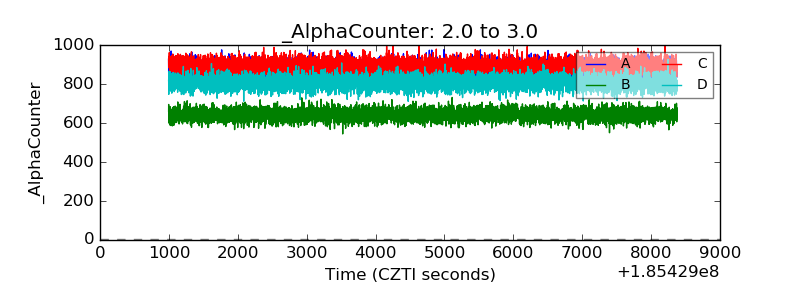 |
| _CPM_Rate | 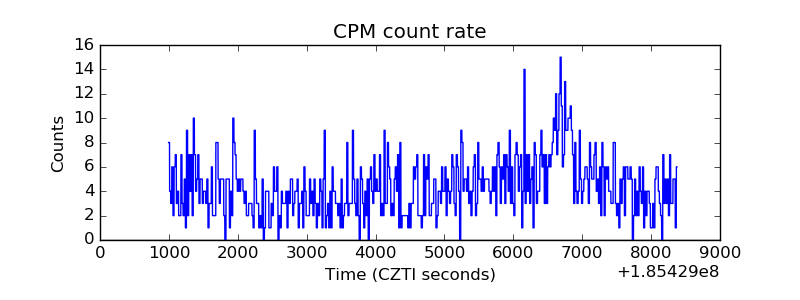 |
| CZT Counter | 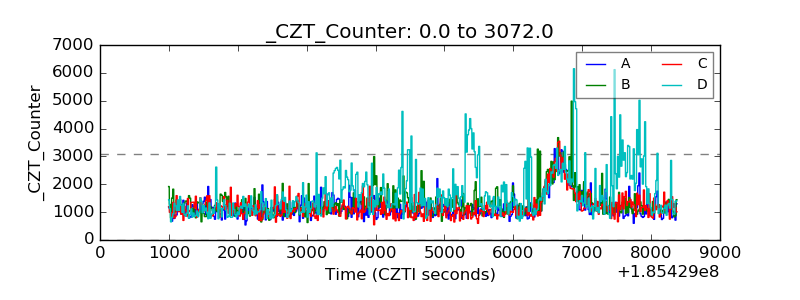 |
| +2.5 Volts monitor |  |
| +5 Volts monitor |  |
| _ROLL_ROT | 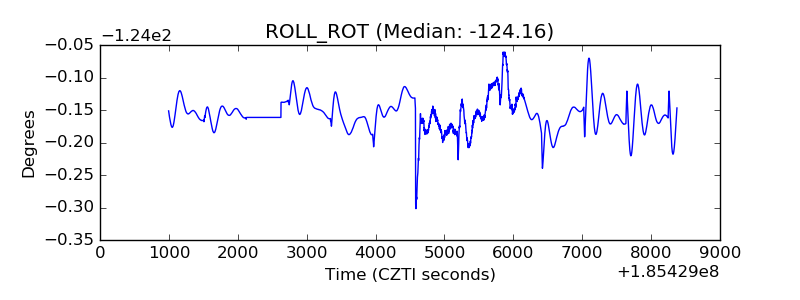 |
| _Roll_DEC | 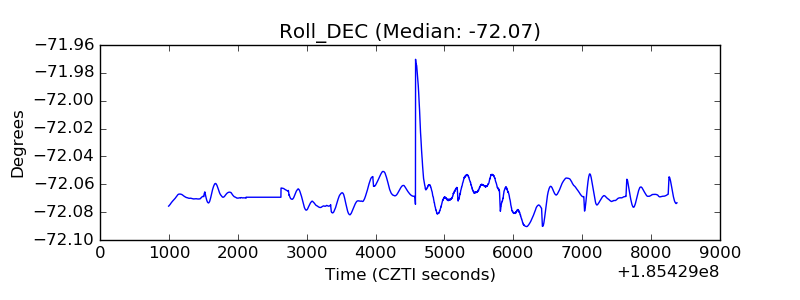 |
| _Roll_RA | 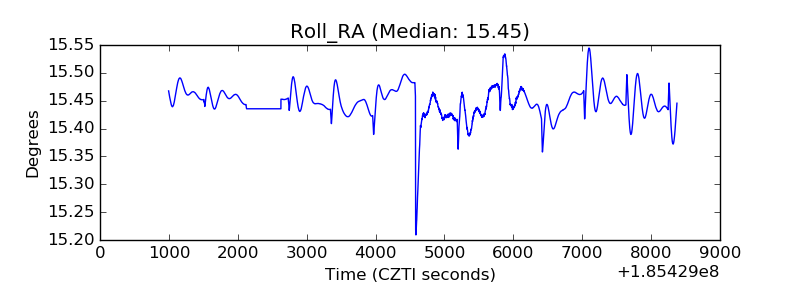 |
| Veto Counter | 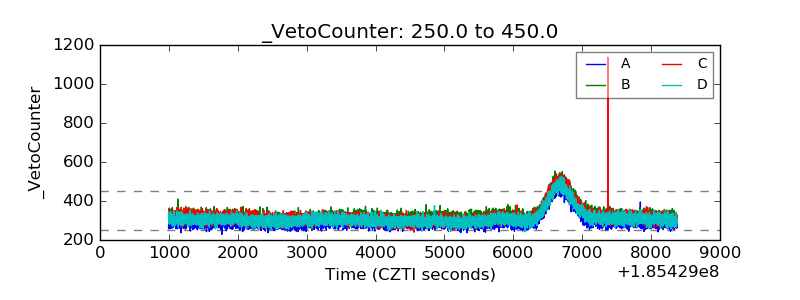 |