| Param | Original file | Final file |
|---|---|---|
| Filename | modeM0/AS1P01_010T01_9000000108_00743cztM0_level2.evt | modeM0/AS1P01_010T01_9000000108_00743cztM0_level2_quad_clean.evt |
| Size (bytes) | 1,325,940,480 | 92,076,480 |
| Size | 1.2 GB | 87.8 MB |
| Events in quadrant A | 8,942,680 | 583,422 |
| Events in quadrant B | 9,547,414 | 587,799 |
| Events in quadrant C | 8,709,297 | 583,178 |
| Events in quadrant D | 12,484,224 | 534,621 |
| Mode SS | |||
|---|---|---|---|
| Quadrant | BADHDUFLAG | Total packets | Discarded packets |
| A | 0 | 144 | 0 |
| B | 0 | 144 | 0 |
| C | 0 | 144 | 0 |
| D | 0 | 144 | 0 |
| Mode M0 | |||
|---|---|---|---|
| Quadrant | BADHDUFLAG | Total packets | Discarded packets |
| A | 0 | 31667 | 0 |
| B | 0 | 33435 | 0 |
| C | 0 | 30963 | 0 |
| D | 0 | 42272 | 0 |
| Quadrant | Total seconds | Saturated seconds | Saturation percentage |
|---|---|---|---|
| A | 7160 | 123 | 1.717877% |
| B | 7160 | 183 | 2.555866% |
| C | 7160 | 71 | 0.991620% |
| D | 7161 | 906 | 12.651864% |
Noise dominated data is calculated using 1-second bins in cleaned event files. If a bin has >2000 counts, and if more than 50% of those come from <1% of pixels, then it is considered to be noise-dominated and hence unusable.
| Quadrant | # 1 sec bins | Bins with >0 counts | Bins with >2000 counts | High rate bins dominated by noise | Noise dominated (total time) | Noise dominated (detector-on time) | Marked lightcurve |
|---|---|---|---|---|---|---|---|
| A | 7160 | 7160 | 468 | 468 | 6.54% | 6.54% |  |
| B | 7160 | 7160 | 652 | 652 | 9.11% | 9.11% |  |
| C | 7160 | 7160 | 432 | 432 | 6.03% | 6.03% | 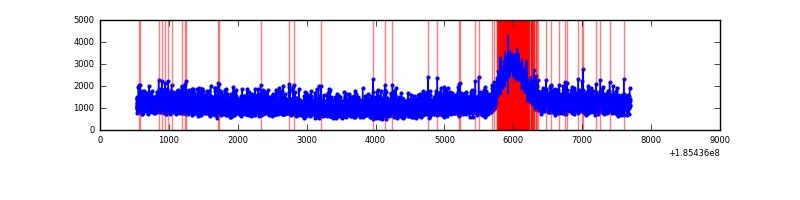 |
| D | 7161 | 7161 | 2247 | 2247 | 31.38% | 31.38% | 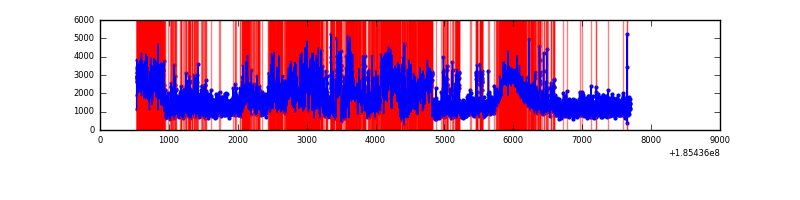 |
Top three noisy pixels from each quadrant. If the there are fewer than three noisy pixels in the level2.evt file, extra rows are filled as -1
| Pixel properties | Quadrant properties | ||||||
|---|---|---|---|---|---|---|---|
| Quadrant | DetID | PixID | Counts | Sigma | Mean | Median | Sigma |
| A | 15 | 17 | 49442 | 83.79 | 2313 | 2331 | 562.2 |
| A | 15 | 233 | 13691 | 20.2 | 2313 | 2331 | 562.2 |
| A | 11 | 79 | 10984 | 15.39 | 2313 | 2331 | 562.2 |
| B | 5 | 191 | 354082 | 623.19 | 2384 | 2395 | 564.3 |
| B | 5 | 176 | 46648 | 78.42 | 2384 | 2395 | 564.3 |
| B | 8 | 38 | 42200 | 70.53 | 2384 | 2395 | 564.3 |
| C | 15 | 241 | 42098 | 64.14 | 2199 | 2271 | 620.9 |
| C | 3 | 111 | 39649 | 60.19 | 2199 | 2271 | 620.9 |
| C | 3 | 79 | 31188 | 46.57 | 2199 | 2271 | 620.9 |
| D | 7 | 207 | 1963560 | 2999.29 | 2083 | 2157 | 654.0 |
| D | 13 | 25 | 1400081 | 2137.64 | 2083 | 2157 | 654.0 |
| D | 10 | 85 | 833894 | 1271.85 | 2083 | 2157 | 654.0 |
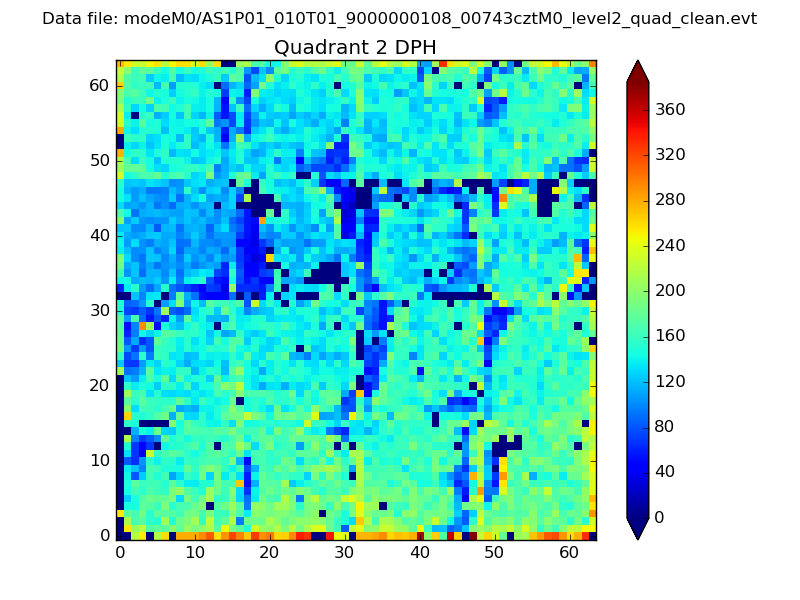
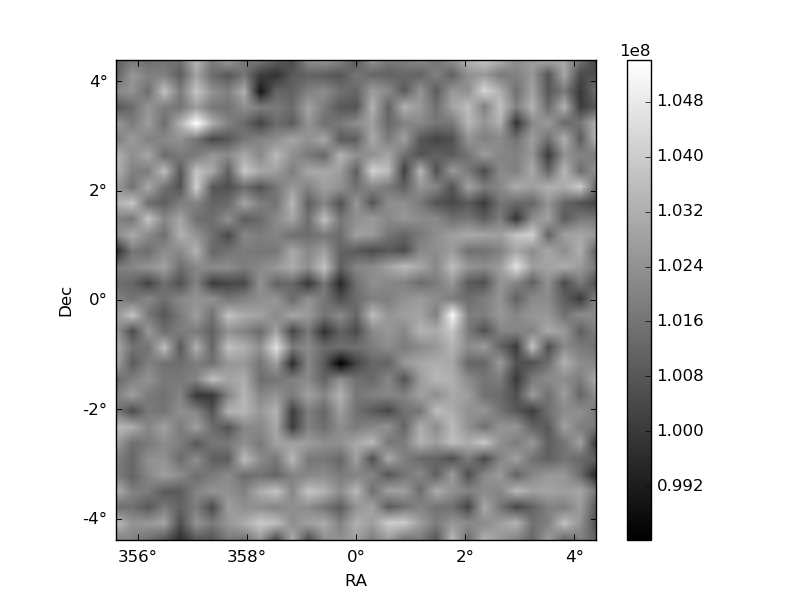
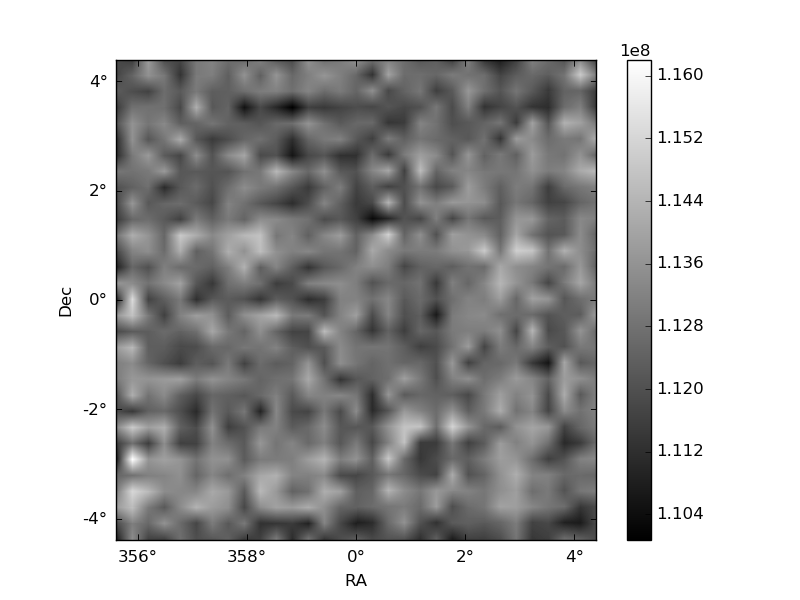
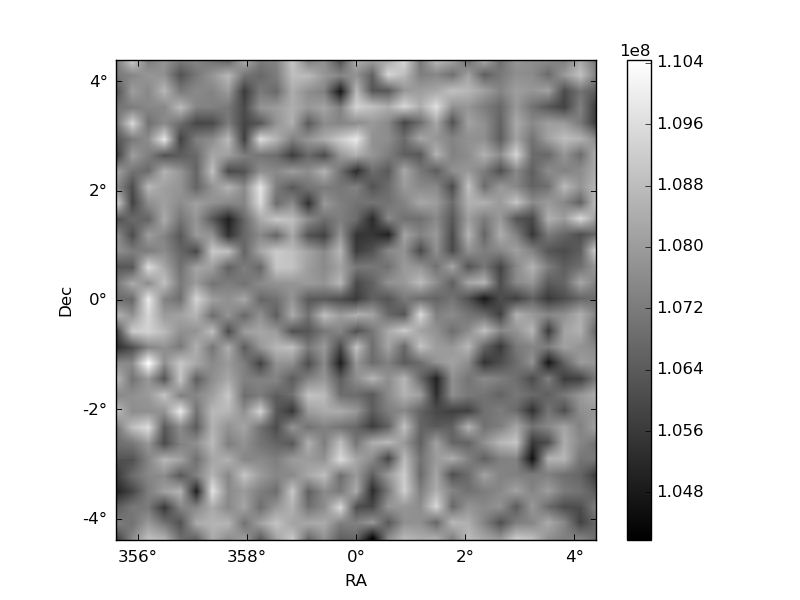
Histogram calculated using DETX and DETY for each event in the final _common_clean file
| Quadrant A | 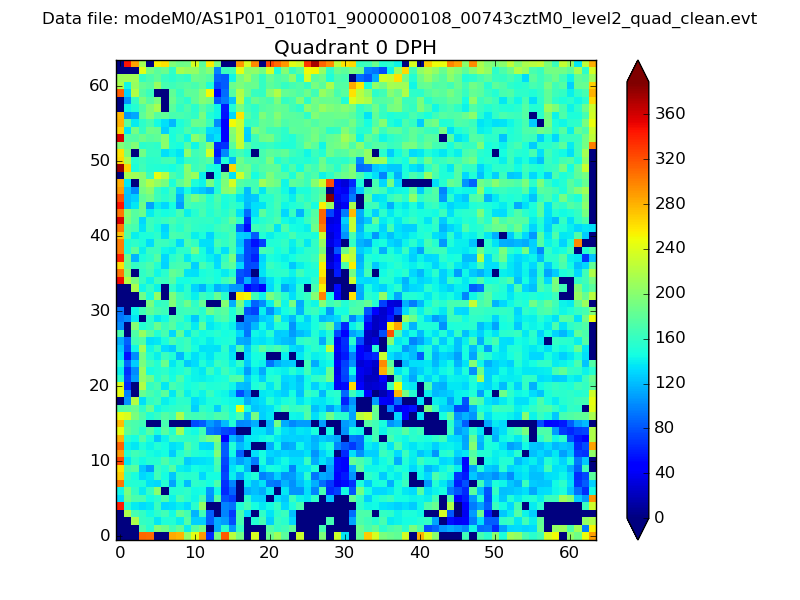 |
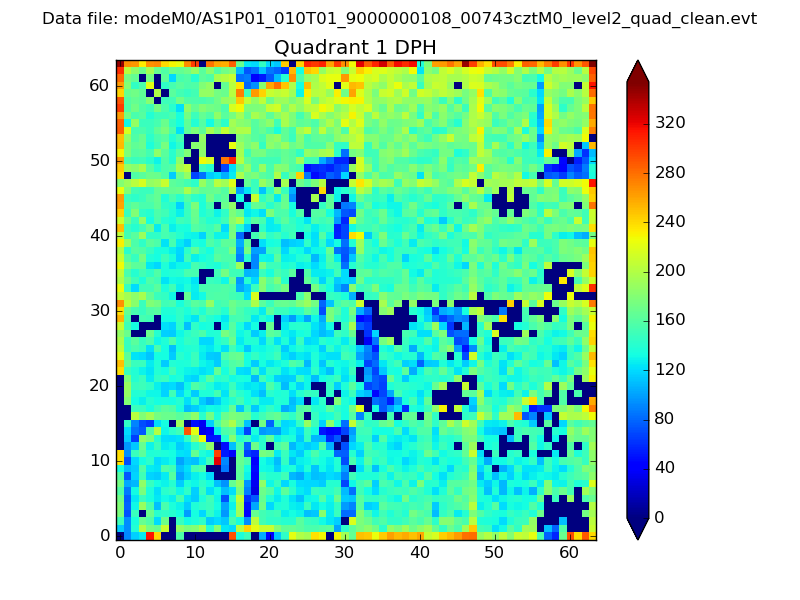 |
Quadrant B |
|---|---|---|---|
| Quadrant D | 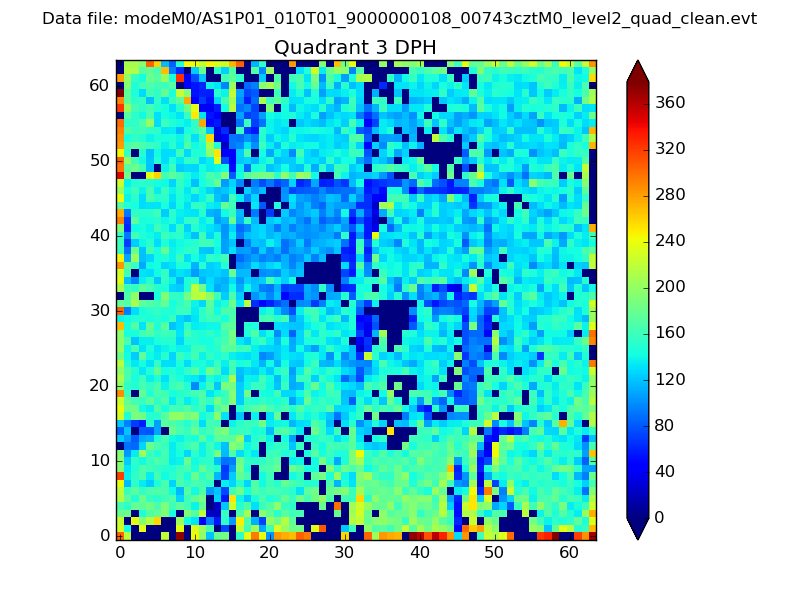 |
 |
Quadrant C |
| Plot type | Count rate plots | Images |
|---|---|---|
| Comparison with Poisson distribution Blue bars denote a histogram of data divided into 1 sec bins. Red curve is a Poisson curve with rate = median count rate of data. |
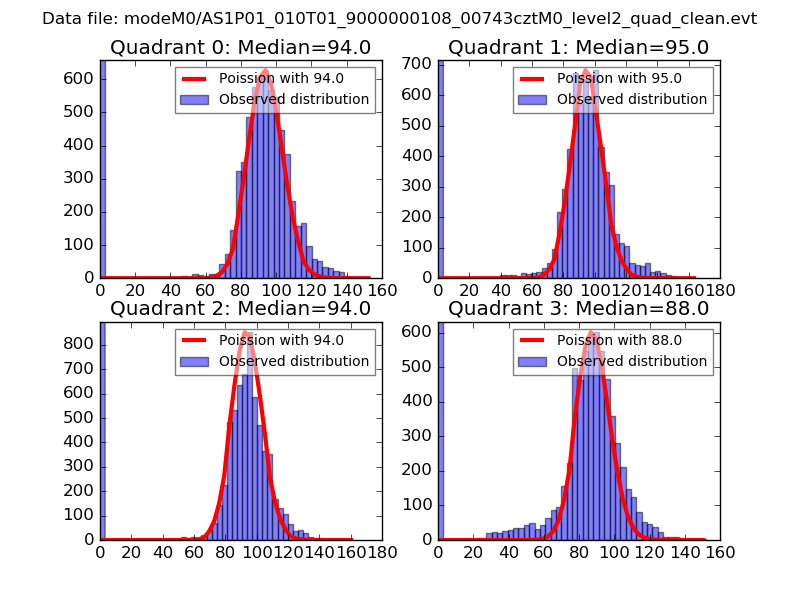 |
 |
| Quadrant-wise count rates Data is divided into 100 sec bins |
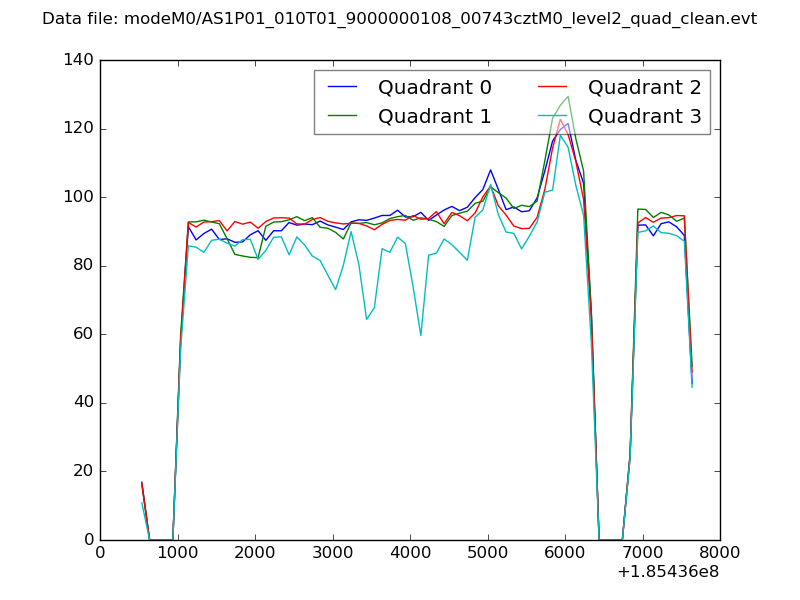 |
|
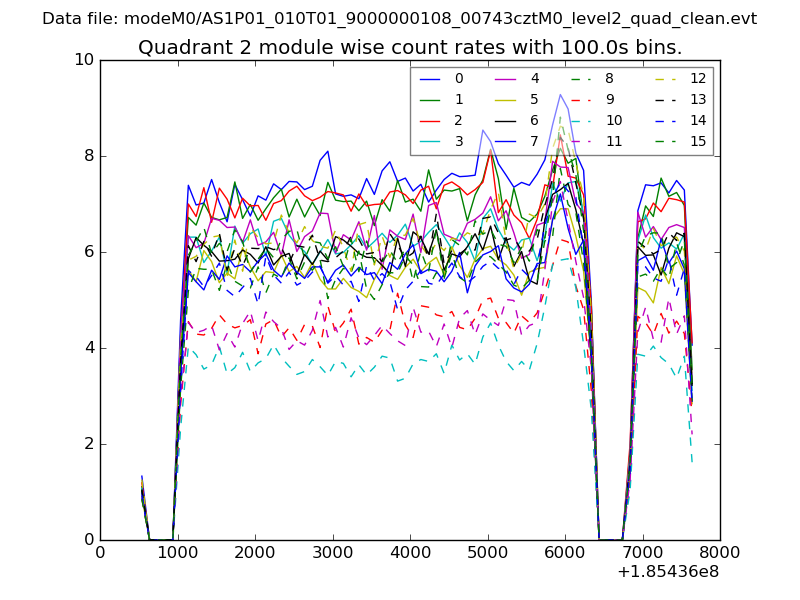
| Module-wise count rates for Quadrant A Data is divided into 100 sec bins |
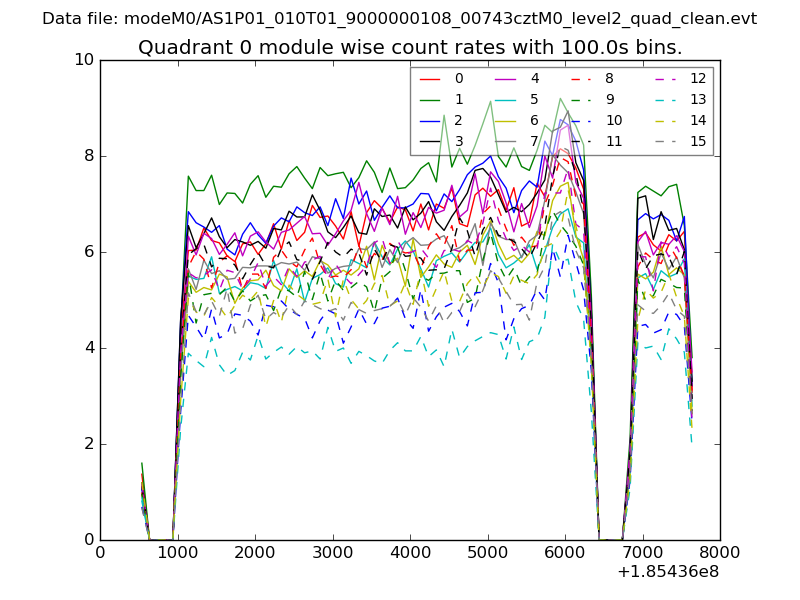 |
 |
| Module-wise count rates for Quadrant B Data is divided into 100 sec bins |
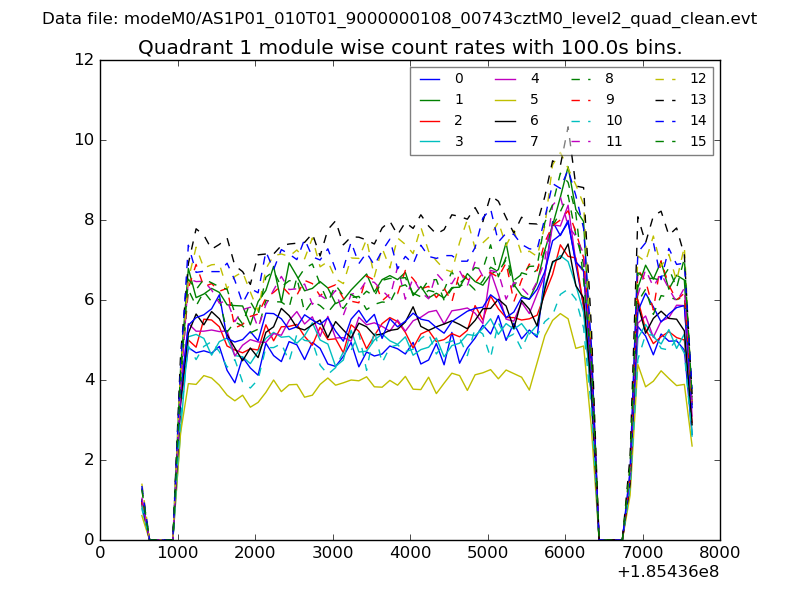 |
 |
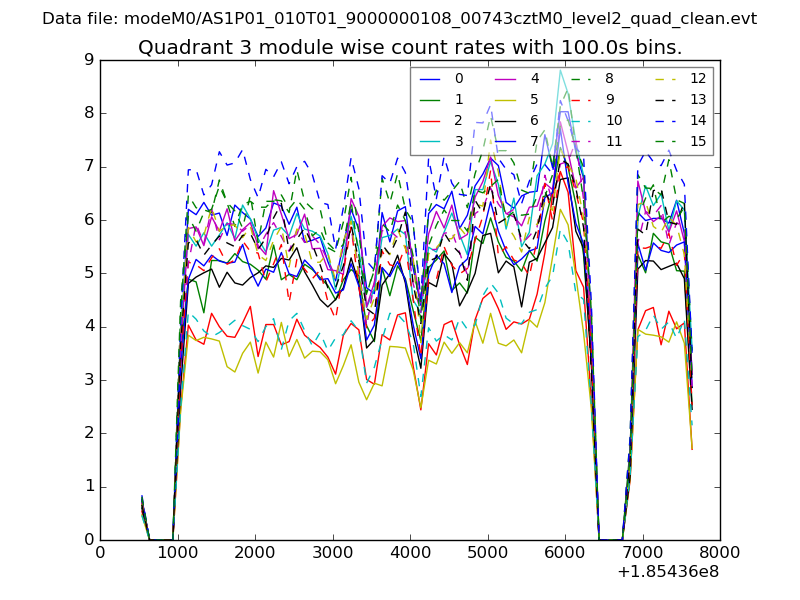
| Module-wise count rates for Quadrant C Data is divided into 100 sec bins |
 |
 |
| Module-wise count rates for Quadrant D Data is divided into 100 sec bins |
 |
 |
| Parameter | Plot |
|---|---|
| CZT HV Monitor | 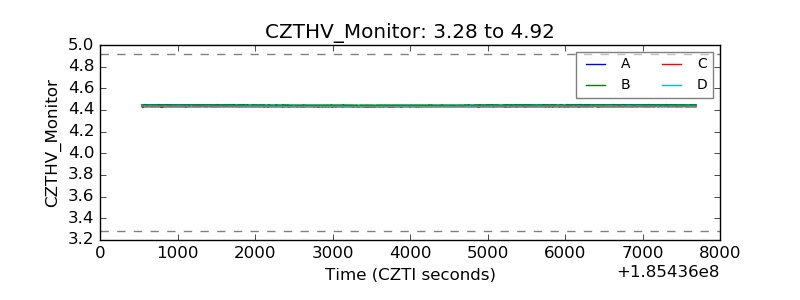 |
| D_VDD | 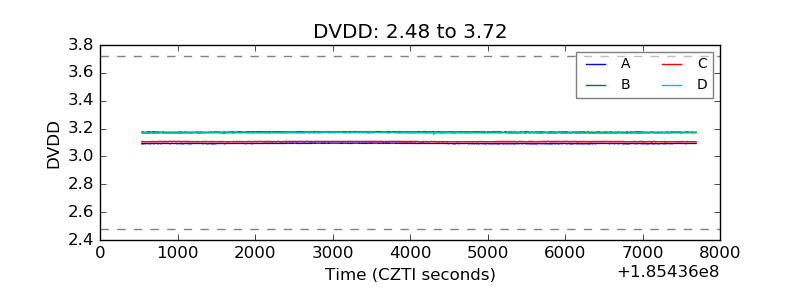 |
| Temperature 1 | 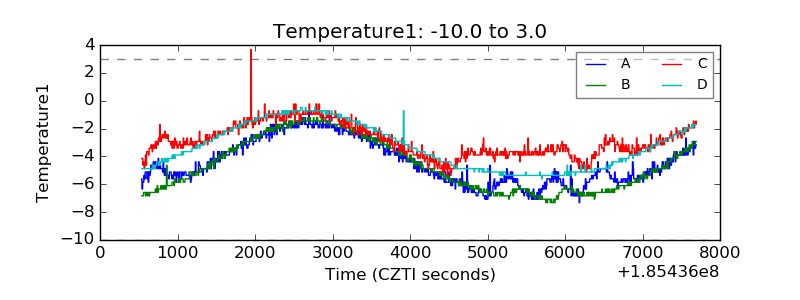 |
| Veto HV Monitor | 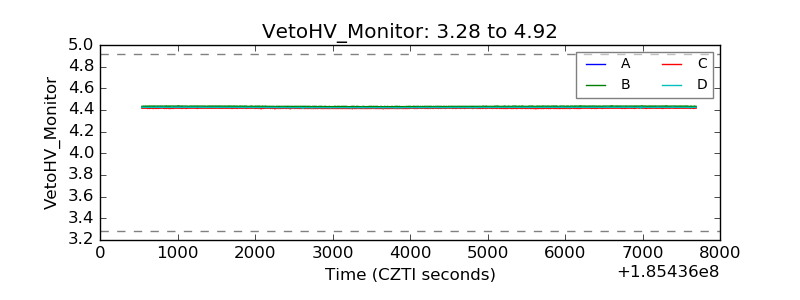 |
| Veto LLD | 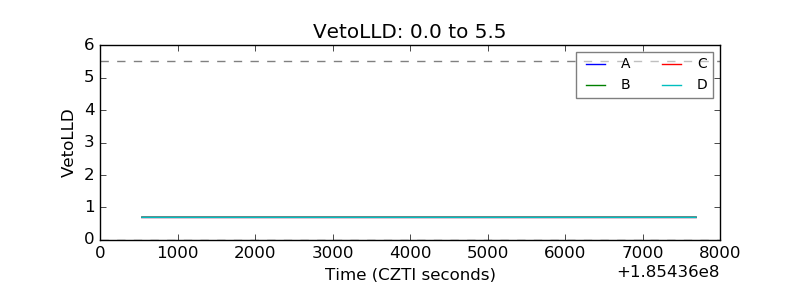 |
| Alpha Counter | 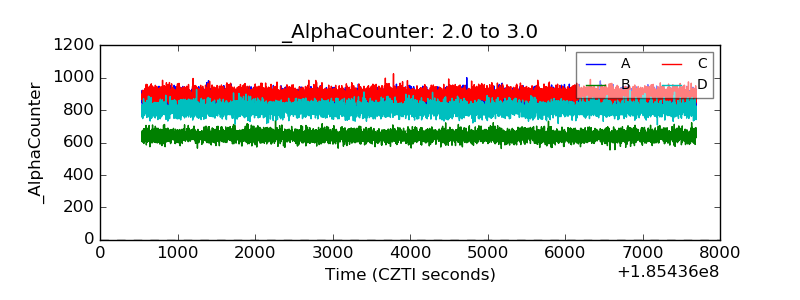 |
| _CPM_Rate | 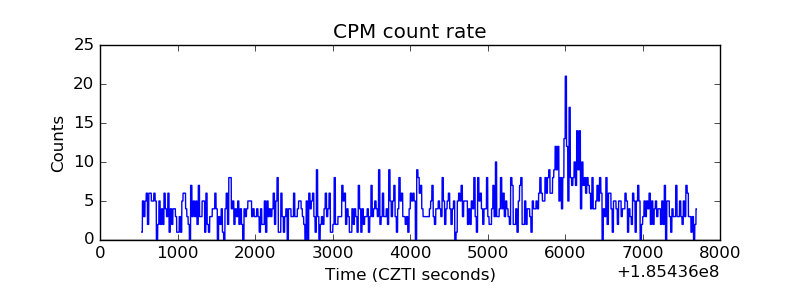 |
| CZT Counter | 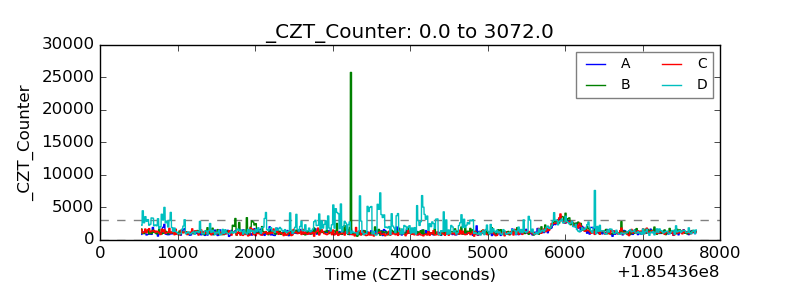 |
| +2.5 Volts monitor |  |
| +5 Volts monitor |  |
| _ROLL_ROT | 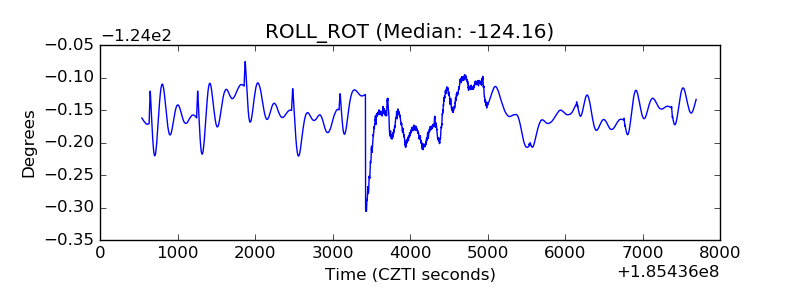 |
| _Roll_DEC | 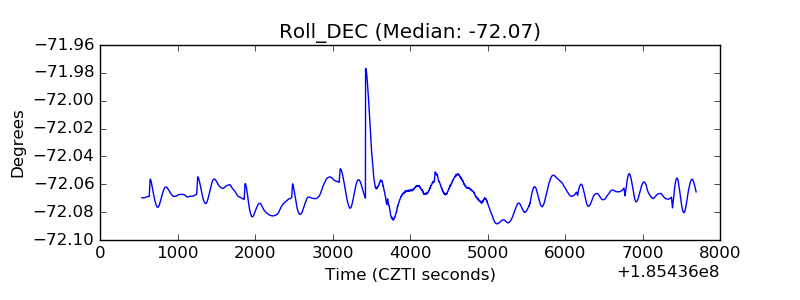 |
| _Roll_RA | 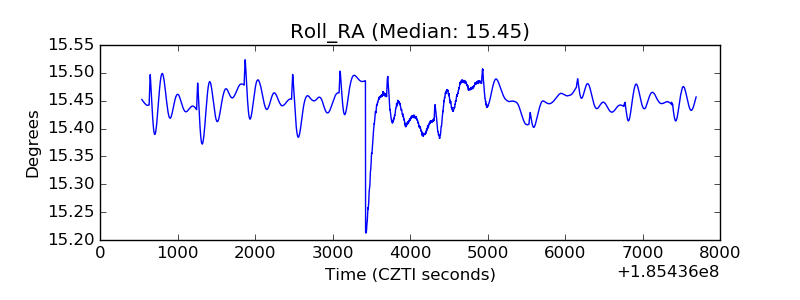 |
| Veto Counter | 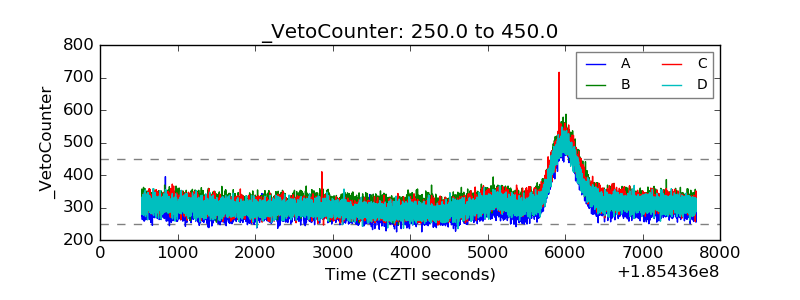 |