| Param | Original file | Final file |
|---|---|---|
| Filename | modeM0/AS1P01_010T01_9000000108_00744cztM0_level2.evt | modeM0/AS1P01_010T01_9000000108_00744cztM0_level2_quad_clean.evt |
| Size (bytes) | 882,420,480 | 70,882,560 |
| Size | 841.5 MB | 67.6 MB |
| Events in quadrant A | 5,694,061 | 467,361 |
| Events in quadrant B | 6,861,902 | 451,292 |
| Events in quadrant C | 5,455,123 | 466,233 |
| Events in quadrant D | 8,381,339 | 410,428 |
| Mode SS | |||
|---|---|---|---|
| Quadrant | BADHDUFLAG | Total packets | Discarded packets |
| A | 0 | 100 | 0 |
| B | 0 | 100 | 0 |
| C | 0 | 100 | 0 |
| D | 0 | 100 | 0 |
| Mode M0 | |||
|---|---|---|---|
| Quadrant | BADHDUFLAG | Total packets | Discarded packets |
| A | 0 | 20455 | 0 |
| B | 0 | 23972 | 0 |
| C | 0 | 19769 | 0 |
| D | 0 | 28532 | 0 |
| Quadrant | Total seconds | Saturated seconds | Saturation percentage |
|---|---|---|---|
| A | 5000 | 3 | 0.060000% |
| B | 4999 | 295 | 5.901180% |
| C | 4999 | 0 | 0.000000% |
| D | 5000 | 649 | 12.980000% |
Noise dominated data is calculated using 1-second bins in cleaned event files. If a bin has >2000 counts, and if more than 50% of those come from <1% of pixels, then it is considered to be noise-dominated and hence unusable.
| Quadrant | # 1 sec bins | Bins with >0 counts | Bins with >2000 counts | High rate bins dominated by noise | Noise dominated (total time) | Noise dominated (detector-on time) | Marked lightcurve |
|---|---|---|---|---|---|---|---|
| A | 5000 | 5000 | 49 | 49 | 0.98% | 0.98% | 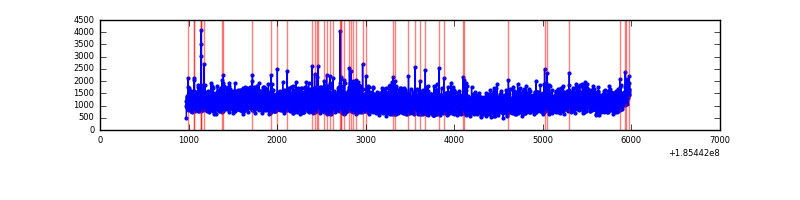 |
| B | 4999 | 4999 | 514 | 514 | 10.28% | 10.28% | 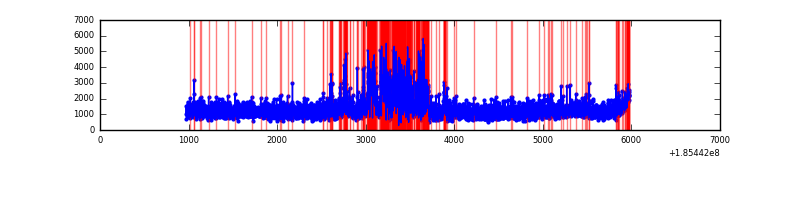 |
| C | 4999 | 4999 | 37 | 37 | 0.74% | 0.74% | 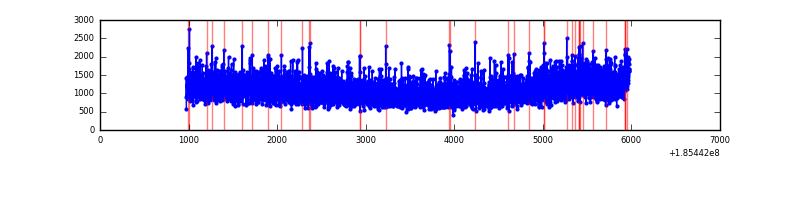 |
| D | 5000 | 5000 | 1293 | 1293 | 25.86% | 25.86% | 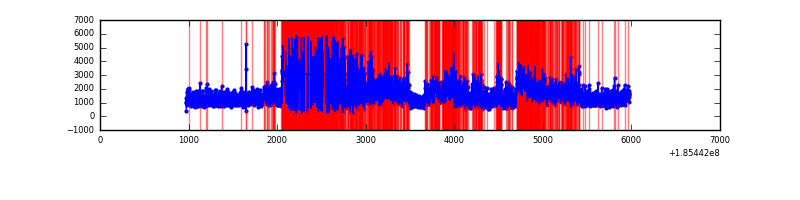 |
Top three noisy pixels from each quadrant. If the there are fewer than three noisy pixels in the level2.evt file, extra rows are filled as -1
| Pixel properties | Quadrant properties | ||||||
|---|---|---|---|---|---|---|---|
| Quadrant | DetID | PixID | Counts | Sigma | Mean | Median | Sigma |
| A | 15 | 17 | 20039 | 51.94 | 1470 | 1482 | 357.3 |
| A | 15 | 233 | 19596 | 50.7 | 1470 | 1482 | 357.3 |
| A | 12 | 236 | 14457 | 36.32 | 1470 | 1482 | 357.3 |
| B | 8 | 38 | 1146215 | 3272.75 | 1483 | 1492 | 349.8 |
| B | 7 | 221 | 22563 | 60.24 | 1483 | 1492 | 349.8 |
| B | 0 | 220 | 18079 | 47.42 | 1483 | 1492 | 349.8 |
| C | 15 | 241 | 39916 | 99.94 | 1372 | 1417 | 385.2 |
| C | 3 | 111 | 28195 | 69.52 | 1372 | 1417 | 385.2 |
| C | 3 | 79 | 24902 | 60.97 | 1372 | 1417 | 385.2 |
| D | 7 | 207 | 3312552 | 8721.46 | 1233 | 1273 | 379.7 |
| D | 6 | 226 | 166343 | 434.77 | 1233 | 1273 | 379.7 |
| D | 1 | 4 | 139218 | 363.33 | 1233 | 1273 | 379.7 |
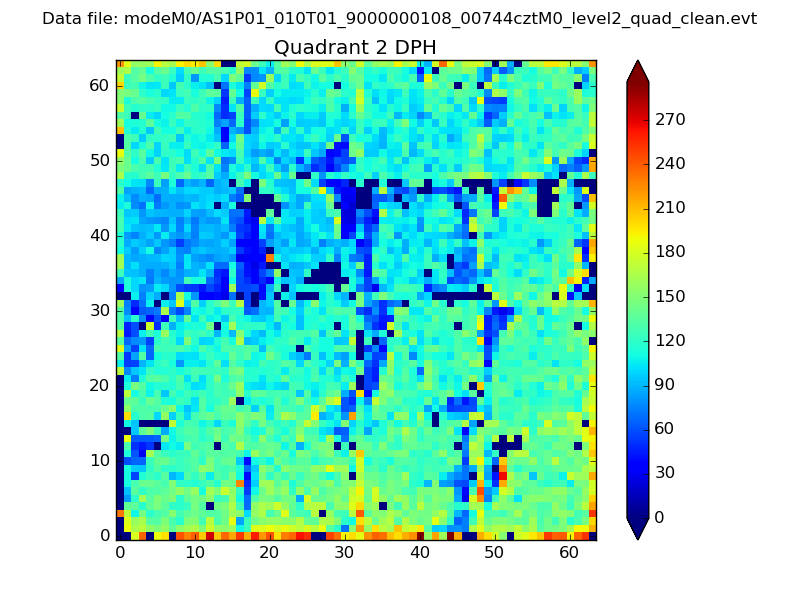
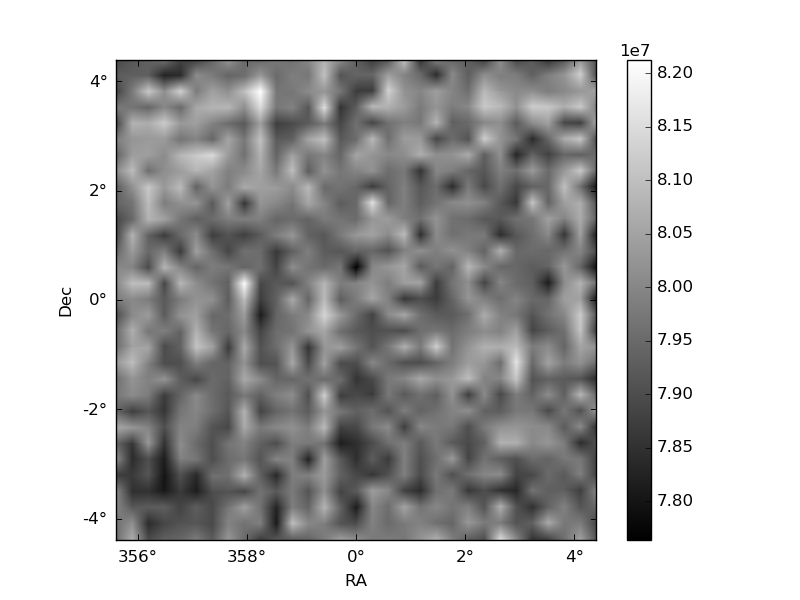
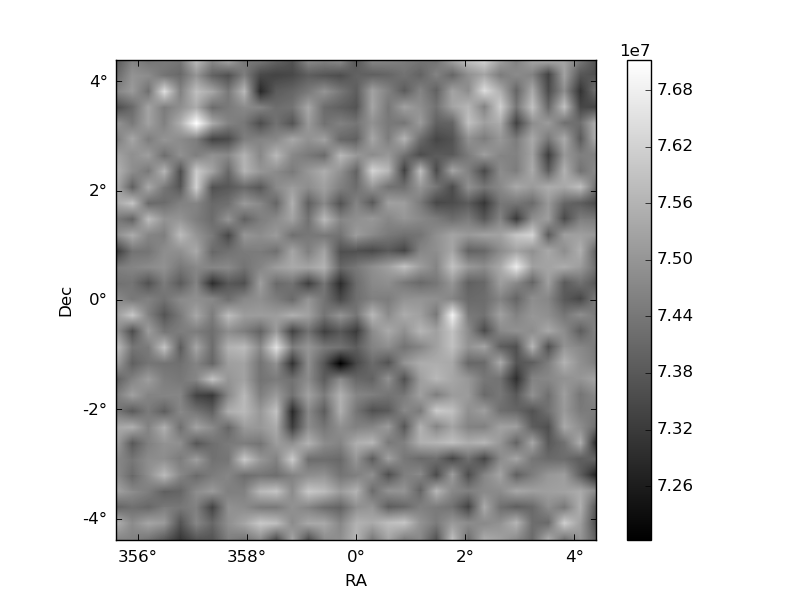
Histogram calculated using DETX and DETY for each event in the final _common_clean file
| Quadrant A |  |
 |
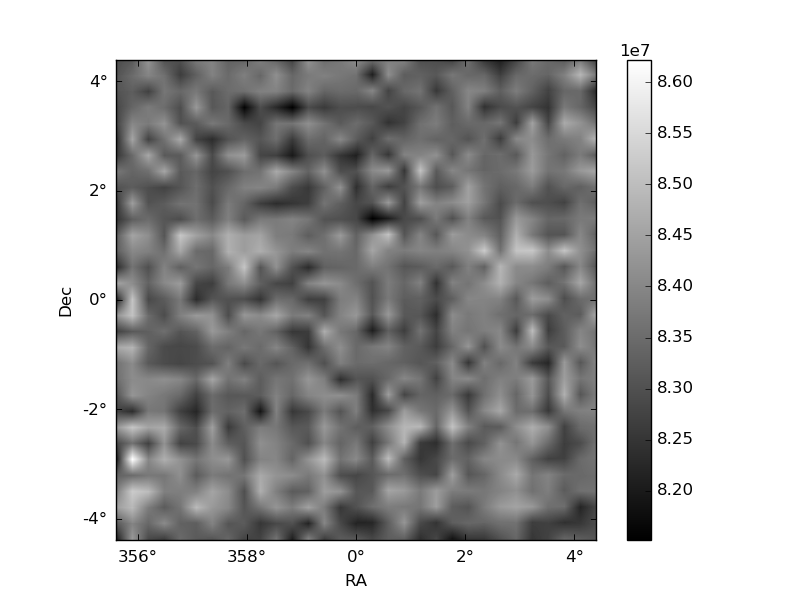
Quadrant B |
|---|---|---|---|
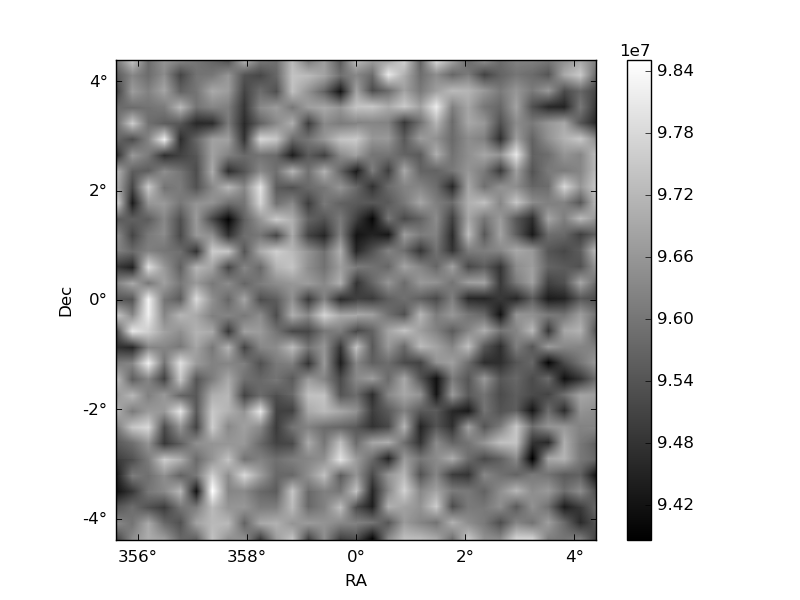
| Quadrant D | 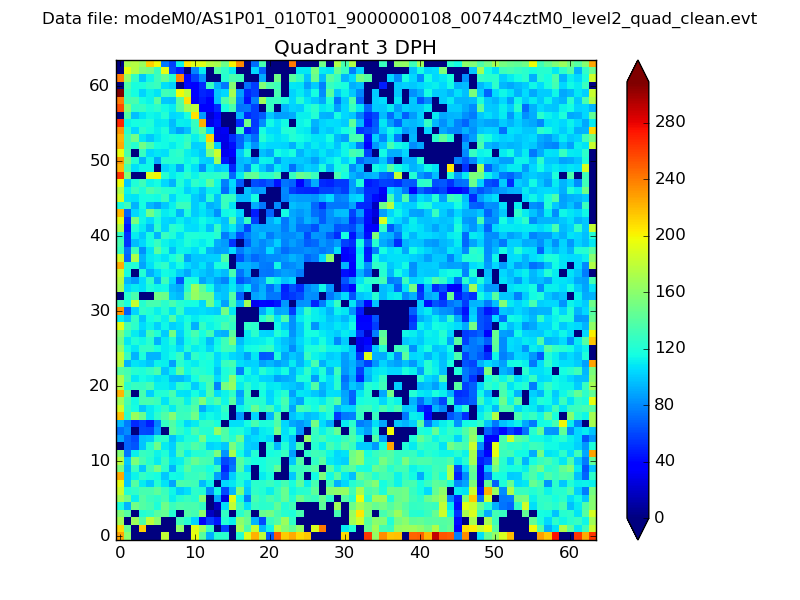 |
 |
Quadrant C |
| Plot type | Count rate plots | Images |
|---|---|---|
| Comparison with Poisson distribution Blue bars denote a histogram of data divided into 1 sec bins. Red curve is a Poisson curve with rate = median count rate of data. |
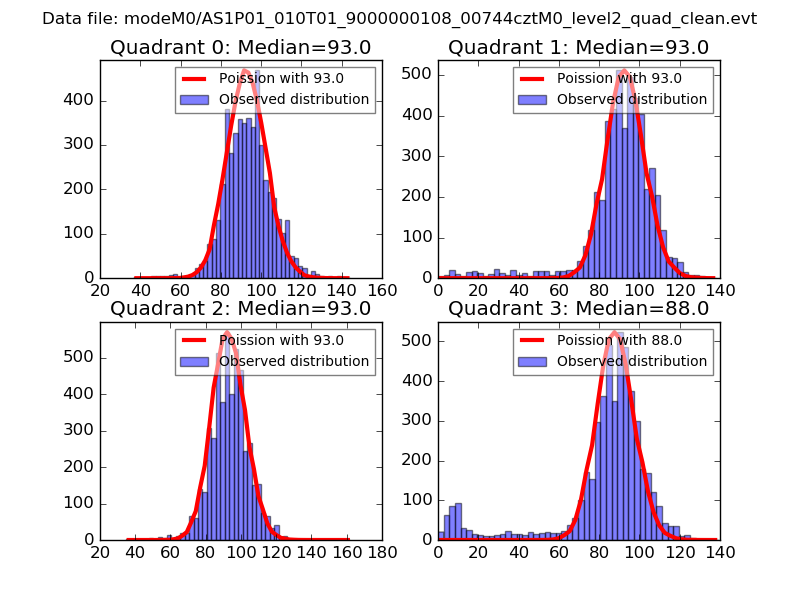 |
 |
| Quadrant-wise count rates Data is divided into 100 sec bins |
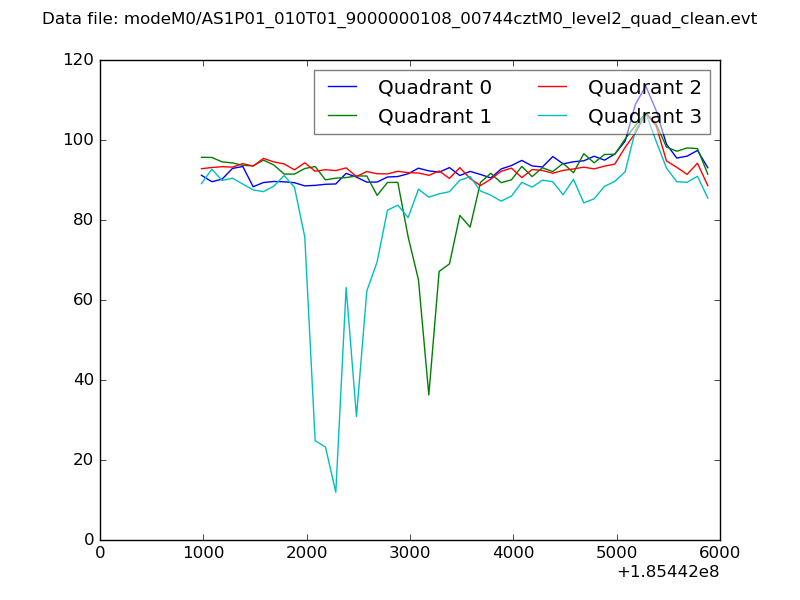 |
|
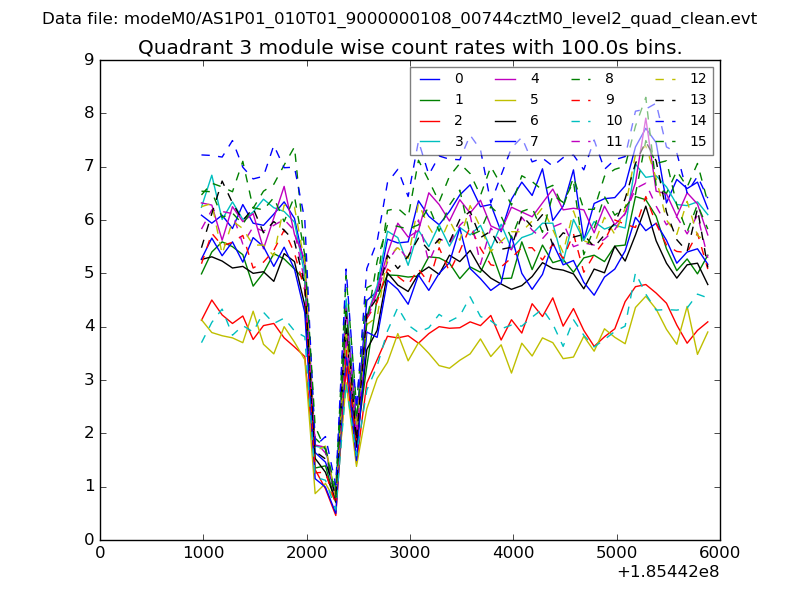
| Module-wise count rates for Quadrant A Data is divided into 100 sec bins |
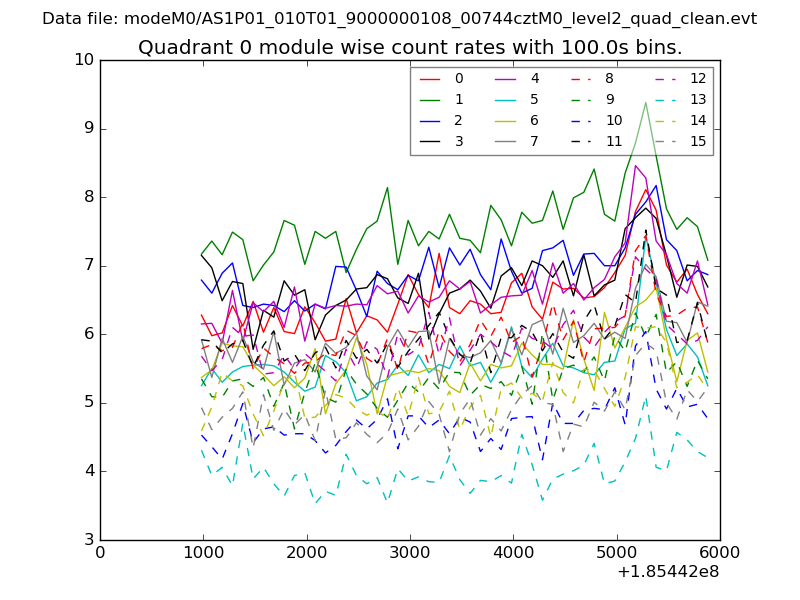 |
 |
| Module-wise count rates for Quadrant B Data is divided into 100 sec bins |
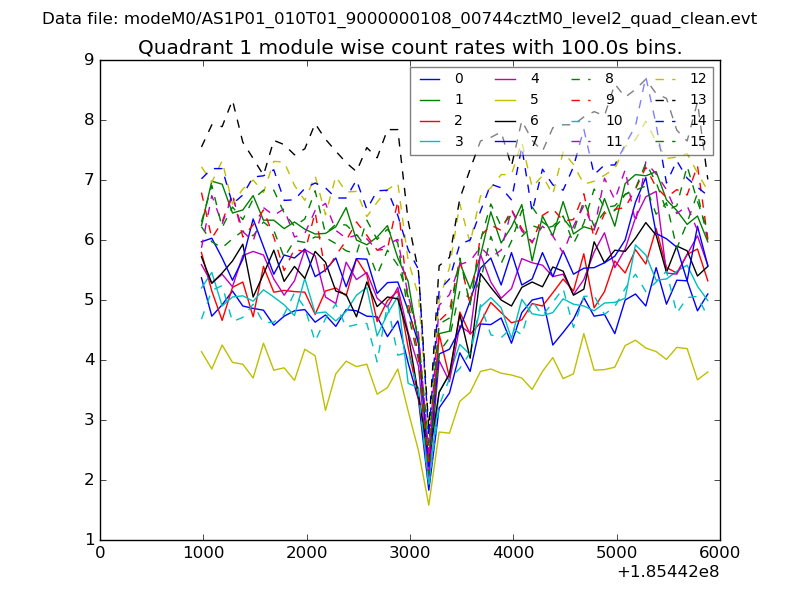 |
 |
| Module-wise count rates for Quadrant C Data is divided into 100 sec bins |
 |
 |
| Module-wise count rates for Quadrant D Data is divided into 100 sec bins |
 |
 |
| Parameter | Plot |
|---|---|
| CZT HV Monitor | 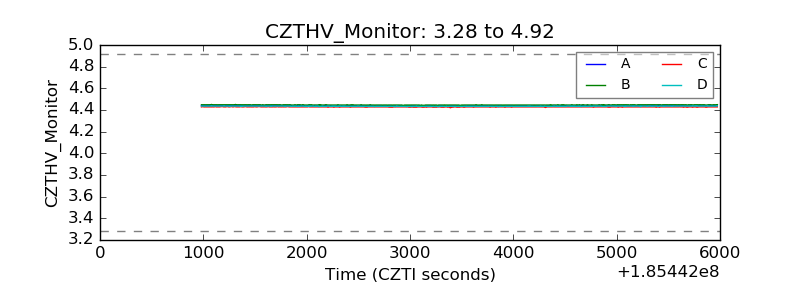 |
| D_VDD | 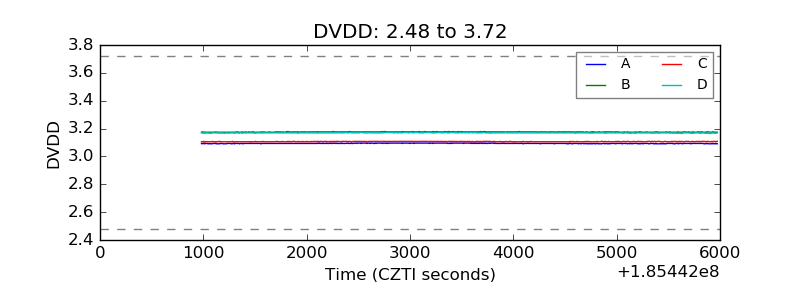 |
| Temperature 1 | 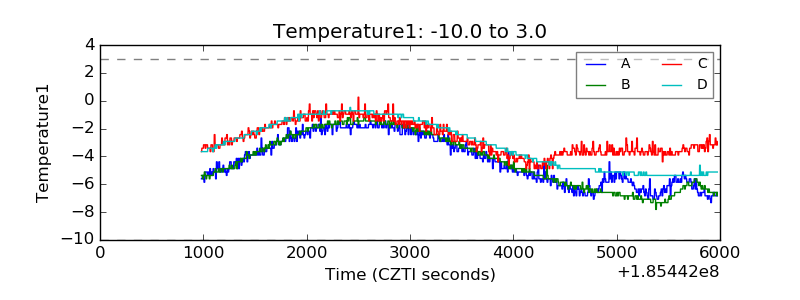 |
| Veto HV Monitor | 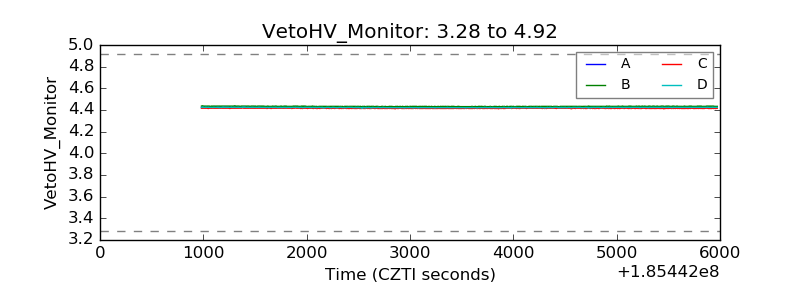 |
| Veto LLD | 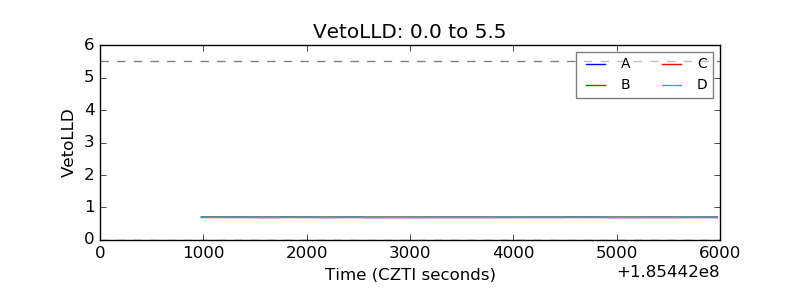 |
| Alpha Counter | 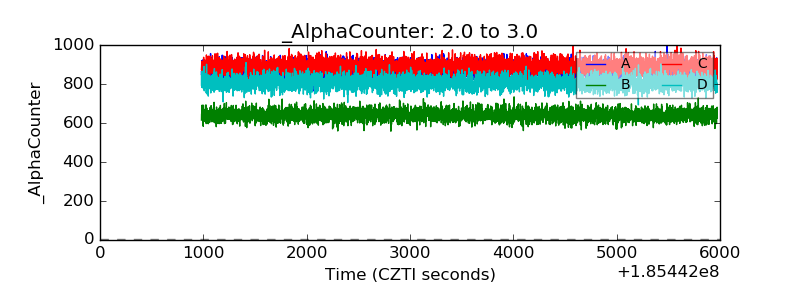 |
| _CPM_Rate | 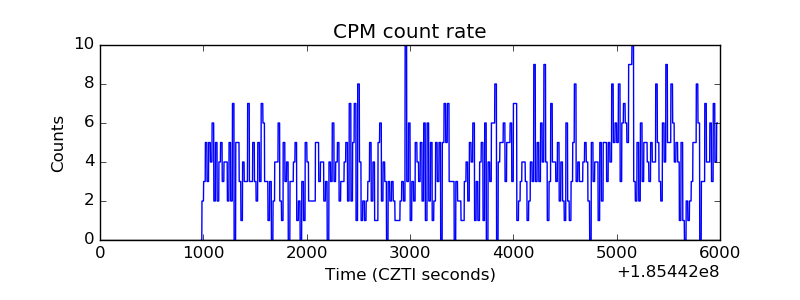 |
| CZT Counter | 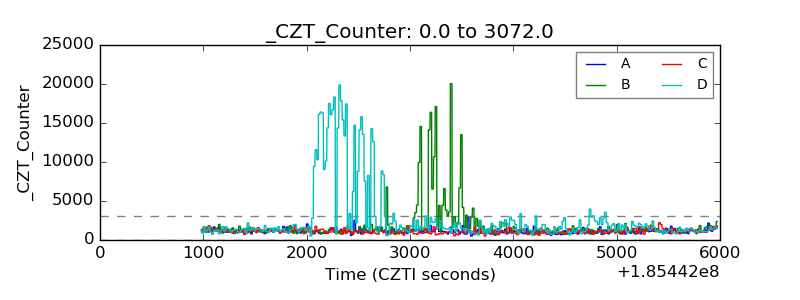 |
| +2.5 Volts monitor |  |
| +5 Volts monitor |  |
| _ROLL_ROT | 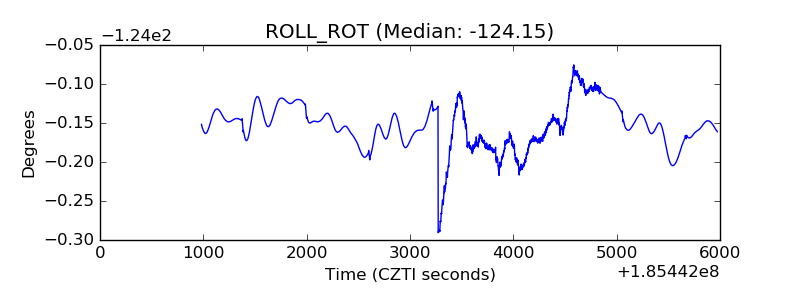 |
| _Roll_DEC | 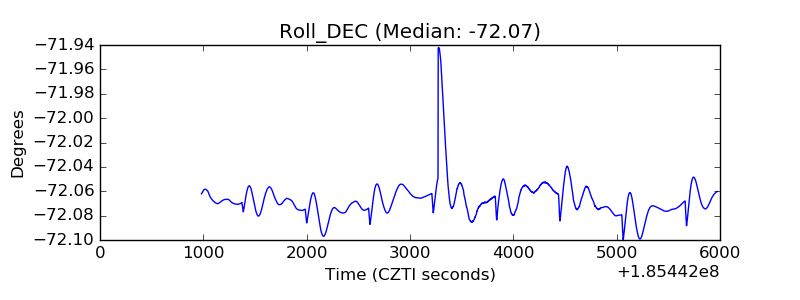 |
| _Roll_RA | 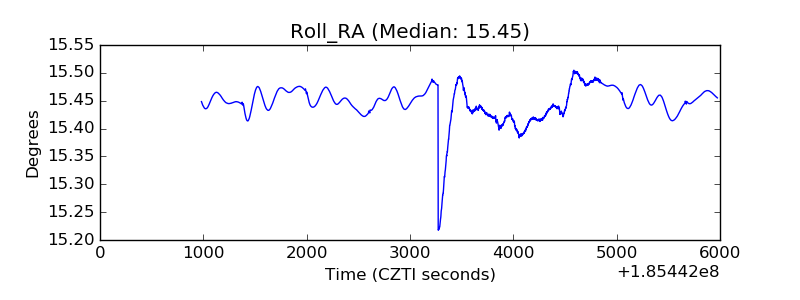 |
| Veto Counter | 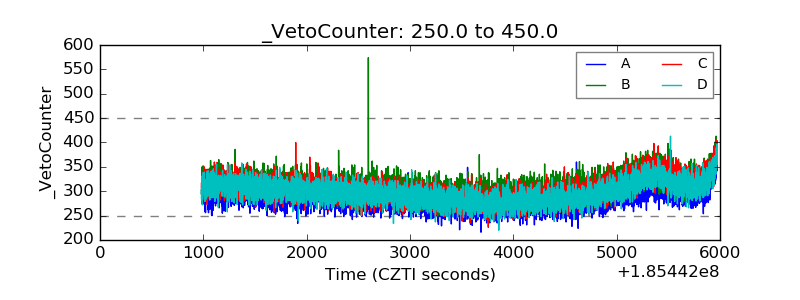 |