| Param | Original file | Final file |
|---|---|---|
| Filename | modeM0/AS1P01_010T01_9000000108_00746cztM0_level2.evt | modeM0/AS1P01_010T01_9000000108_00746cztM0_level2_quad_clean.evt |
| Size (bytes) | 2,108,390,400 | 149,405,760 |
| Size | 2.0 GB | 142.5 MB |
| Events in quadrant A | 13,300,067 | 984,501 |
| Events in quadrant B | 19,045,376 | 886,774 |
| Events in quadrant C | 12,694,268 | 977,913 |
| Events in quadrant D | 18,092,898 | 916,540 |
| Mode SS | |||
|---|---|---|---|
| Quadrant | BADHDUFLAG | Total packets | Discarded packets |
| A | 0 | 224 | 0 |
| B | 0 | 224 | 0 |
| C | 0 | 224 | 0 |
| D | 0 | 224 | 0 |
| Mode M0 | |||
|---|---|---|---|
| Quadrant | BADHDUFLAG | Total packets | Discarded packets |
| A | 0 | 47288 | 0 |
| B | 0 | 64629 | 0 |
| C | 0 | 45550 | 0 |
| D | 0 | 61644 | 0 |
| Mode M9 | |||
|---|---|---|---|
| Quadrant | BADHDUFLAG | Total packets | Discarded packets |
| A | 0 | 9 | 0 |
| B | 0 | 9 | 0 |
| C | 0 | 9 | 0 |
| D | 0 | 9 | 0 |
| Quadrant | Total seconds | Saturated seconds | Saturation percentage |
|---|---|---|---|
| A | 10945 | 184 | 1.681133% |
| B | 10946 | 1896 | 17.321396% |
| C | 10946 | 97 | 0.886168% |
| D | 10946 | 1008 | 9.208843% |
Noise dominated data is calculated using 1-second bins in cleaned event files. If a bin has >2000 counts, and if more than 50% of those come from <1% of pixels, then it is considered to be noise-dominated and hence unusable.
| Quadrant | # 1 sec bins | Bins with >0 counts | Bins with >2000 counts | High rate bins dominated by noise | Noise dominated (total time) | Noise dominated (detector-on time) | Marked lightcurve |
|---|---|---|---|---|---|---|---|
| A | 11840 | 10947 | 588 | 588 | 4.97% | 5.37% |  |
| B | 11841 | 10948 | 3160 | 3160 | 26.69% | 28.86% |  |
| C | 11841 | 10948 | 403 | 403 | 3.40% | 3.68% |  |
| D | 11841 | 10948 | 2924 | 2924 | 24.69% | 26.71% |  |
Top three noisy pixels from each quadrant. If the there are fewer than three noisy pixels in the level2.evt file, extra rows are filled as -1
| Pixel properties | Quadrant properties | ||||||
|---|---|---|---|---|---|---|---|
| Quadrant | DetID | PixID | Counts | Sigma | Mean | Median | Sigma |
| A | 15 | 233 | 243800 | 292.94 | 3377 | 3395 | 820.7 |
| A | 13 | 17 | 79157 | 92.32 | 3377 | 3395 | 820.7 |
| A | 15 | 17 | 16773 | 16.3 | 3377 | 3395 | 820.7 |
| B | 8 | 38 | 6183073 | 7946.59 | 3271 | 3278 | 777.7 |
| B | 7 | 221 | 257686 | 327.14 | 3271 | 3278 | 777.7 |
| B | 5 | 184 | 82908 | 102.4 | 3271 | 3278 | 777.7 |
| C | 15 | 241 | 87633 | 93.98 | 3193 | 3294 | 897.4 |
| C | 3 | 111 | 61489 | 64.85 | 3193 | 3294 | 897.4 |
| C | 3 | 79 | 48440 | 50.31 | 3193 | 3294 | 897.4 |
| D | 7 | 207 | 5488343 | 5848.08 | 3025 | 3139 | 937.9 |
| D | 12 | 22 | 404166 | 427.56 | 3025 | 3139 | 937.9 |
| D | 13 | 25 | 322243 | 340.21 | 3025 | 3139 | 937.9 |
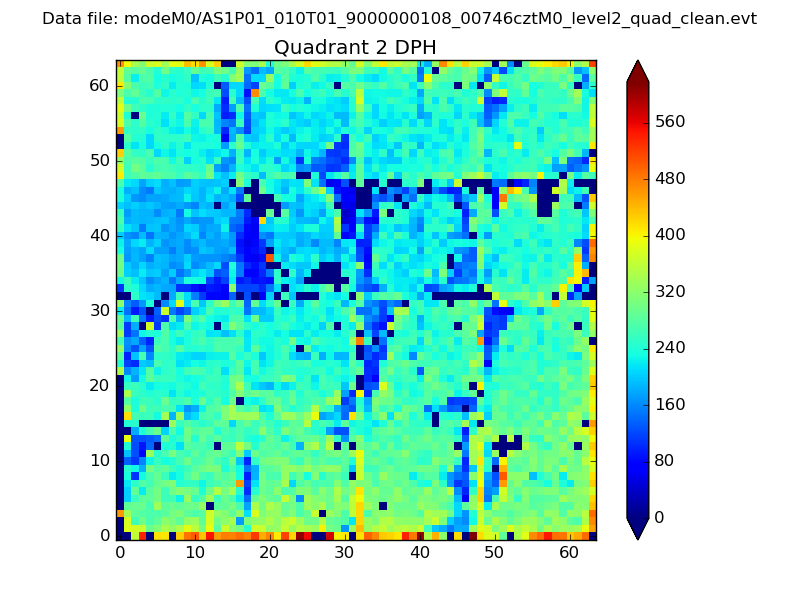
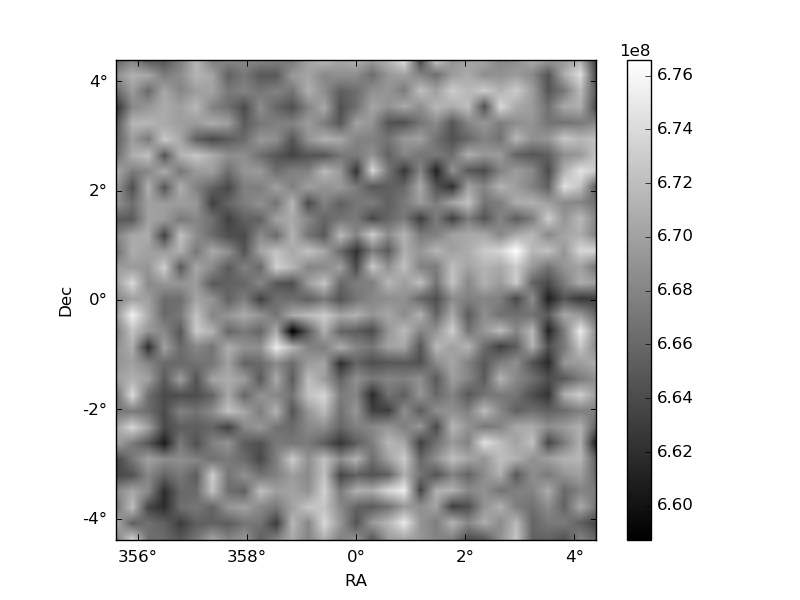
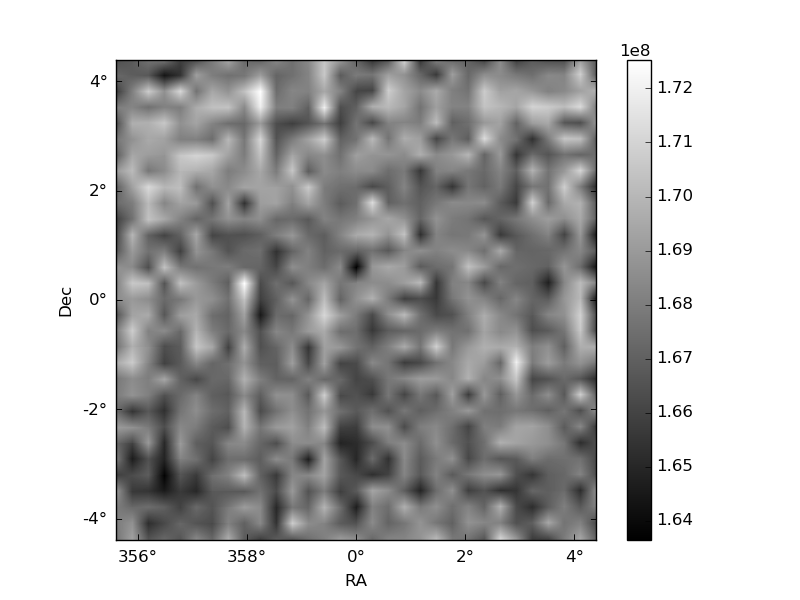
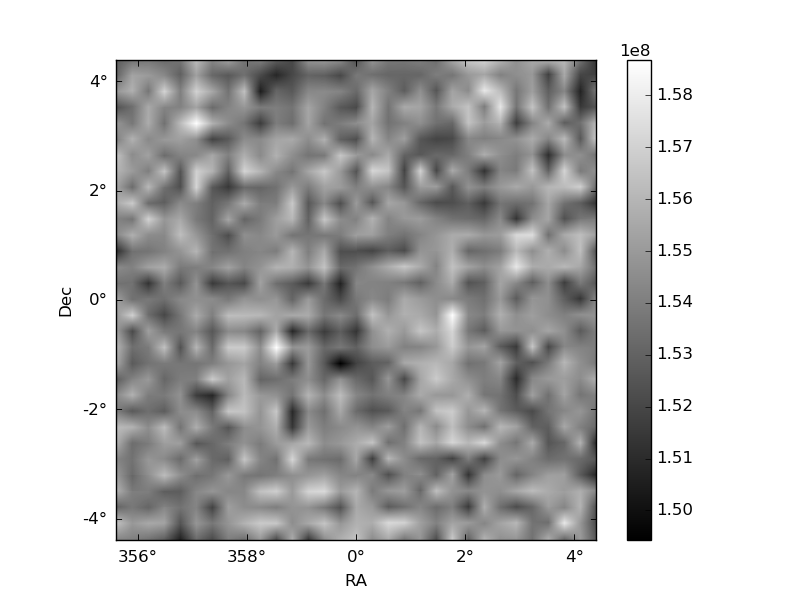
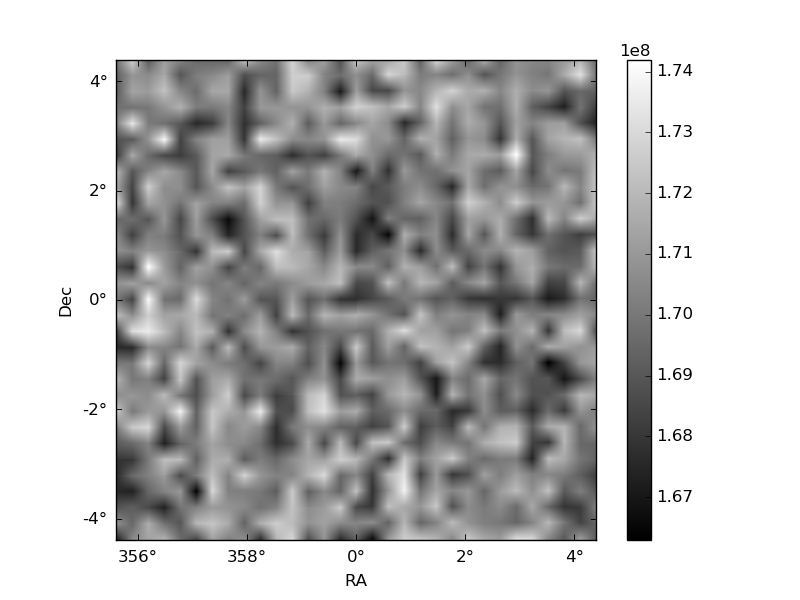
Histogram calculated using DETX and DETY for each event in the final _common_clean file
| Quadrant A | 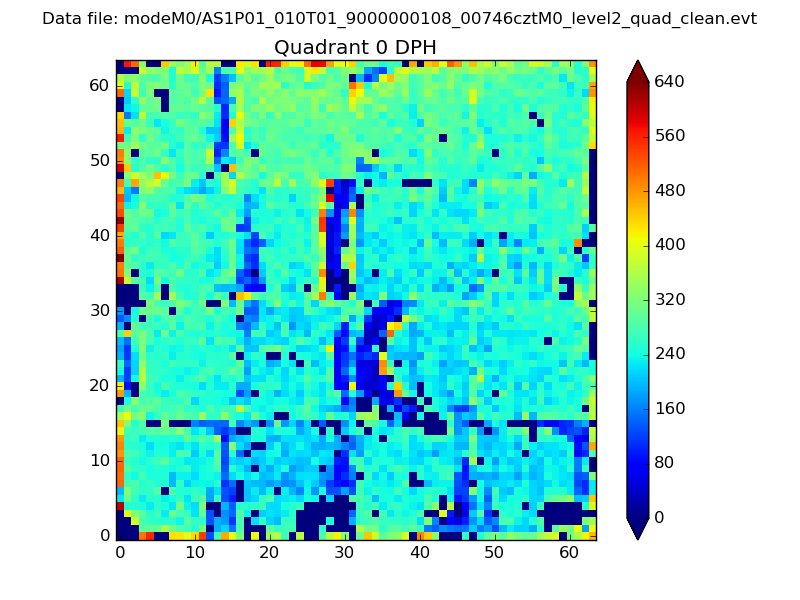 |
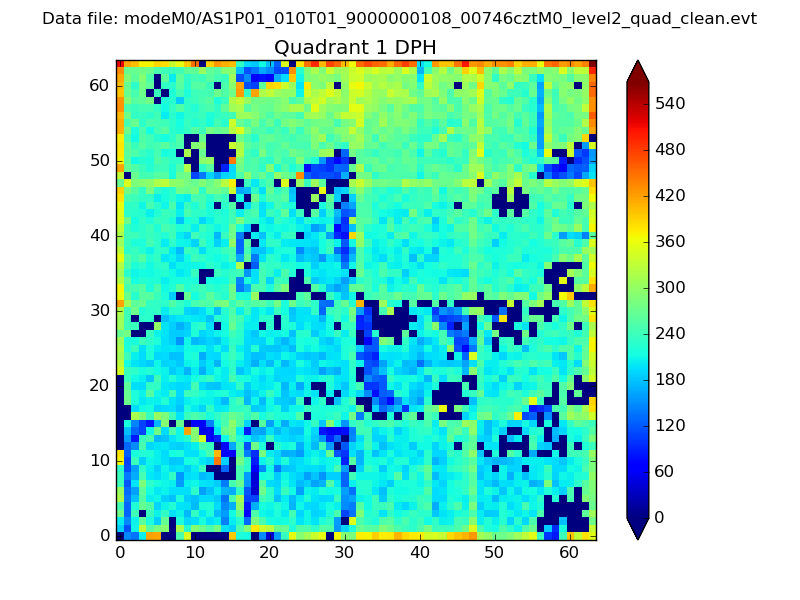 |
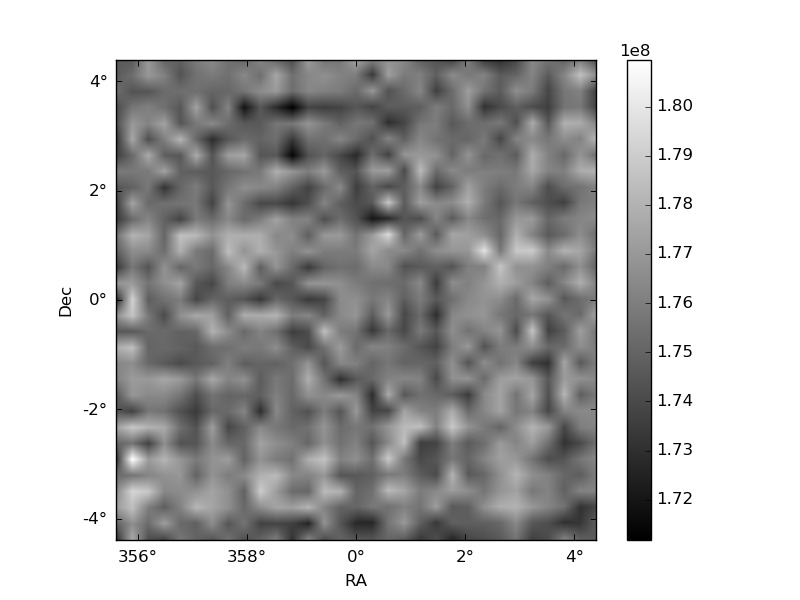
Quadrant B |
|---|---|---|---|
| Quadrant D | 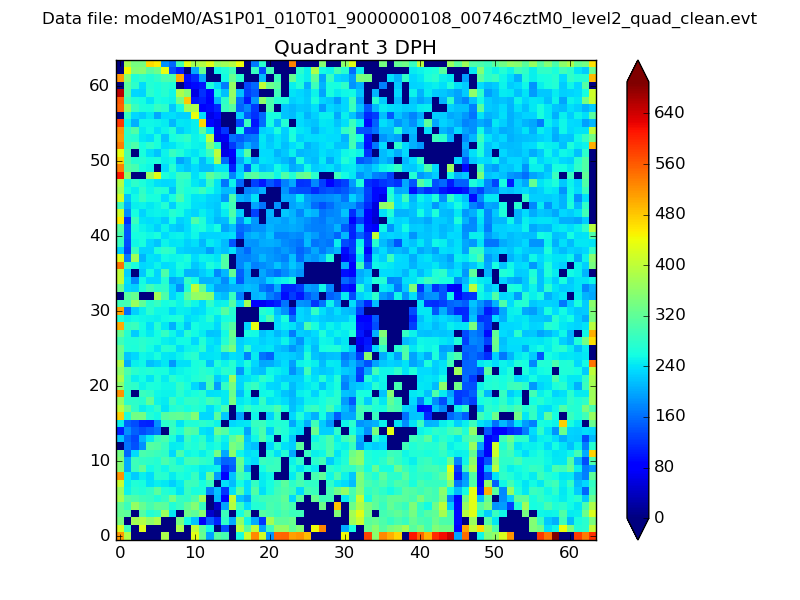 |
 |
Quadrant C |
| Plot type | Count rate plots | Images |
|---|---|---|
| Comparison with Poisson distribution Blue bars denote a histogram of data divided into 1 sec bins. Red curve is a Poisson curve with rate = median count rate of data. |
 |
 |
| Quadrant-wise count rates Data is divided into 100 sec bins |
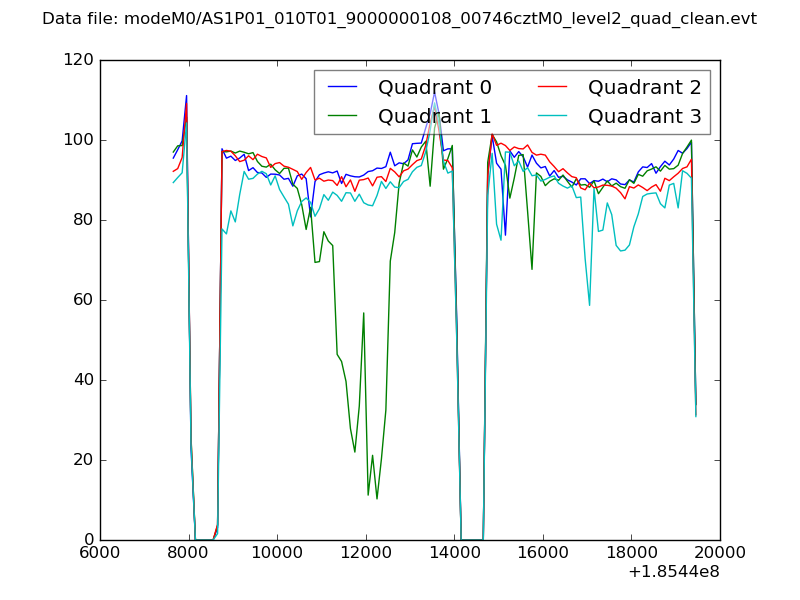 |
|
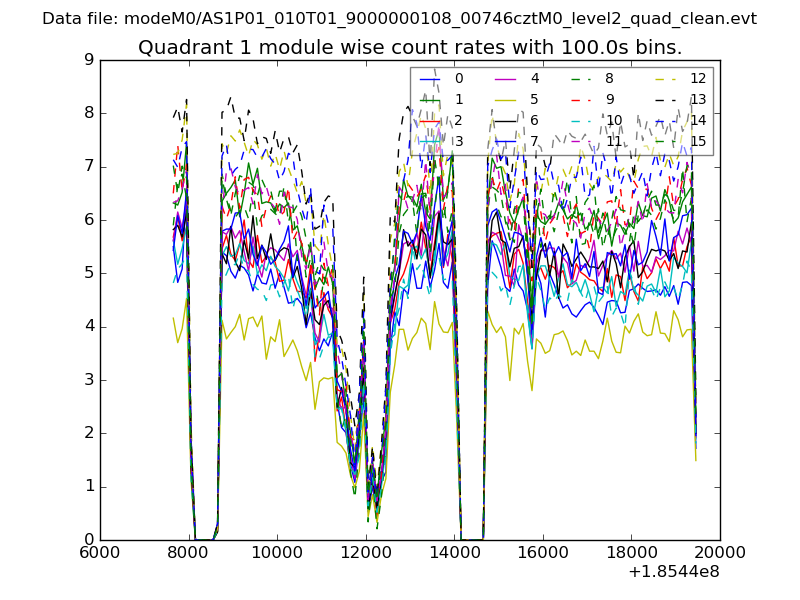
| Module-wise count rates for Quadrant A Data is divided into 100 sec bins |
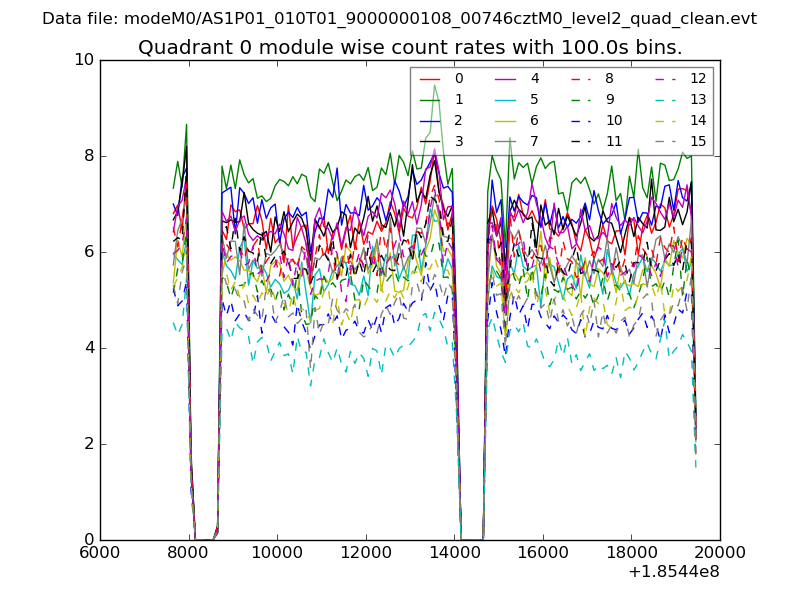 |
 |
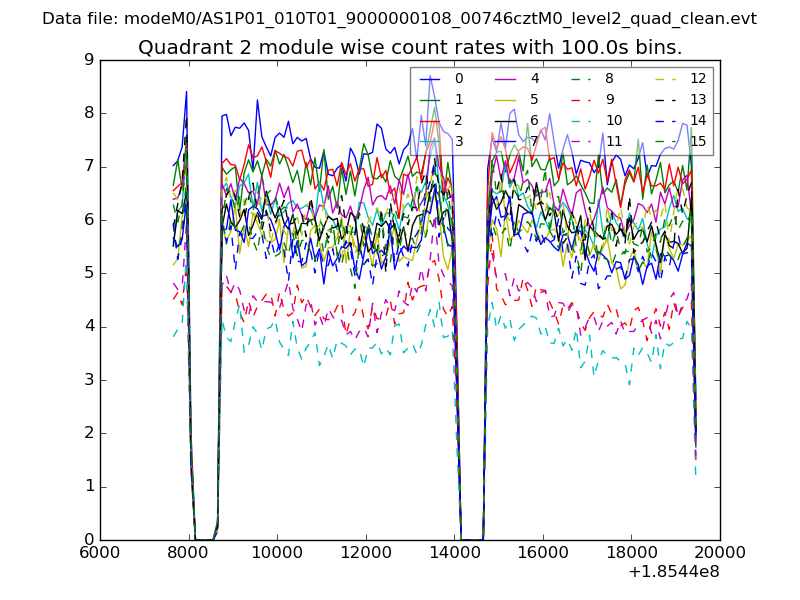
| Module-wise count rates for Quadrant B Data is divided into 100 sec bins |
 |
 |
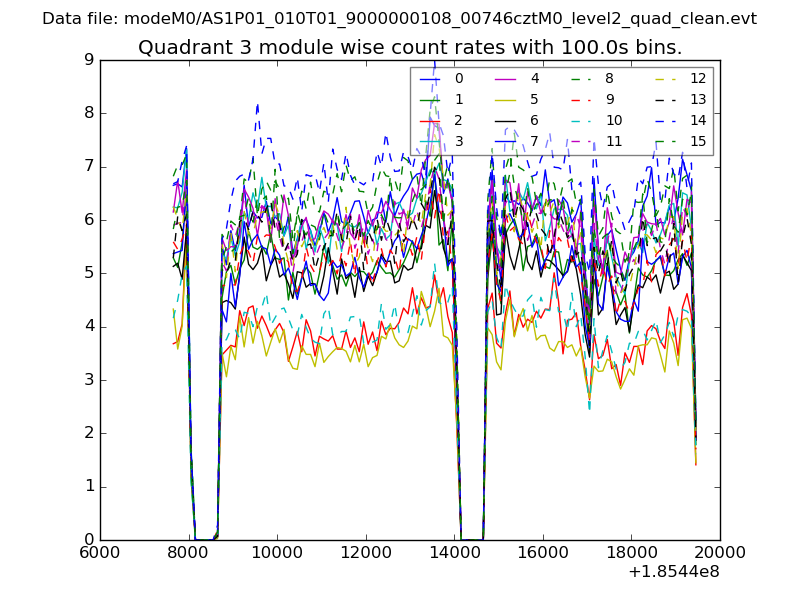
| Module-wise count rates for Quadrant C Data is divided into 100 sec bins |
 |
 |
| Module-wise count rates for Quadrant D Data is divided into 100 sec bins |
 |
 |
| Parameter | Plot |
|---|---|
| CZT HV Monitor | 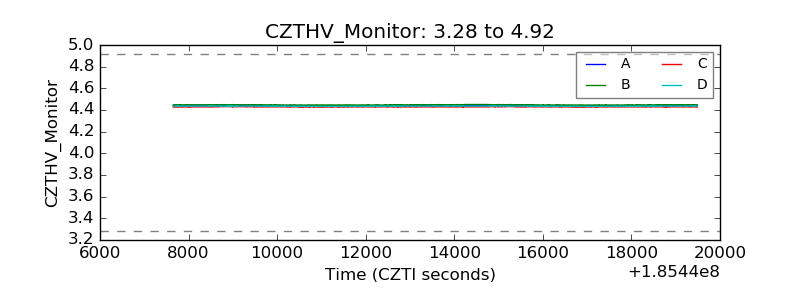 |
| D_VDD | 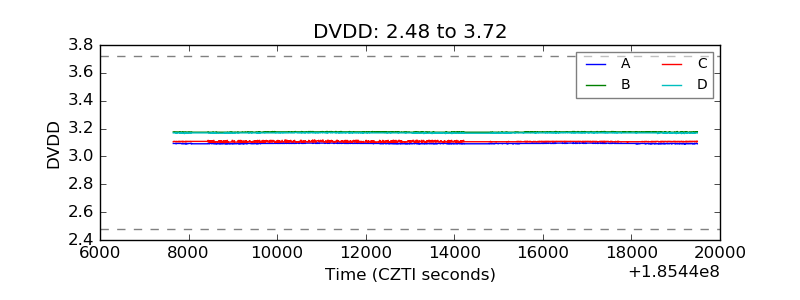 |
| Temperature 1 | 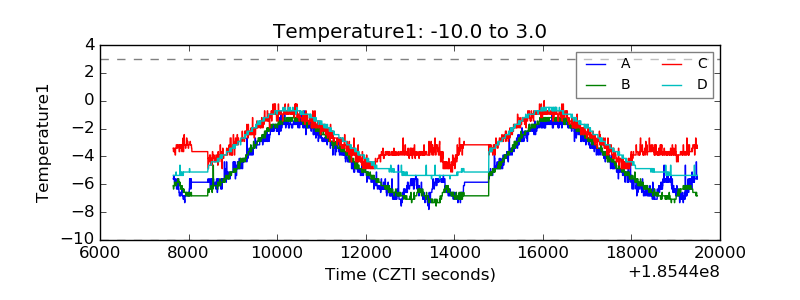 |
| Veto HV Monitor | 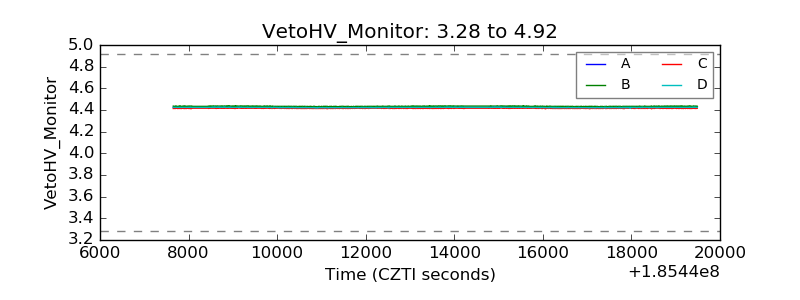 |
| Veto LLD | 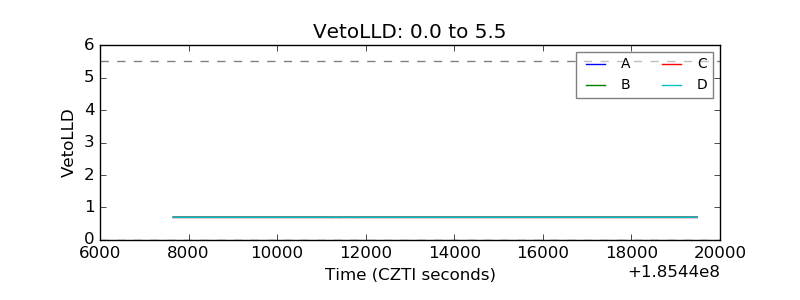 |
| Alpha Counter | 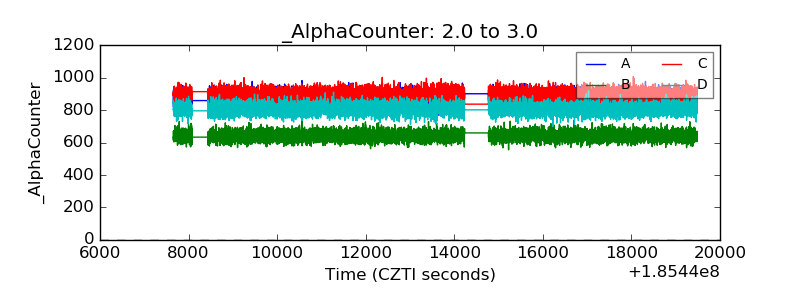 |
| _CPM_Rate | 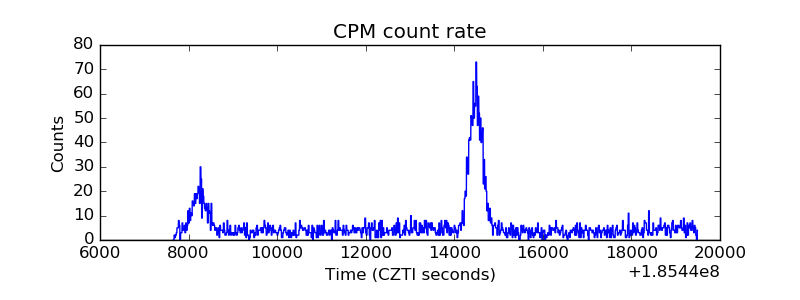 |
| CZT Counter | 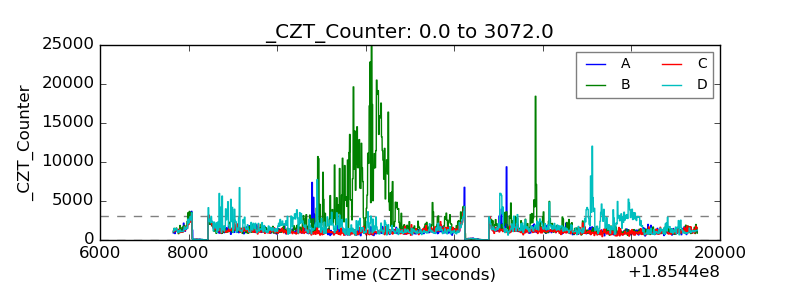 |
| +2.5 Volts monitor |  |
| +5 Volts monitor |  |
| _ROLL_ROT | 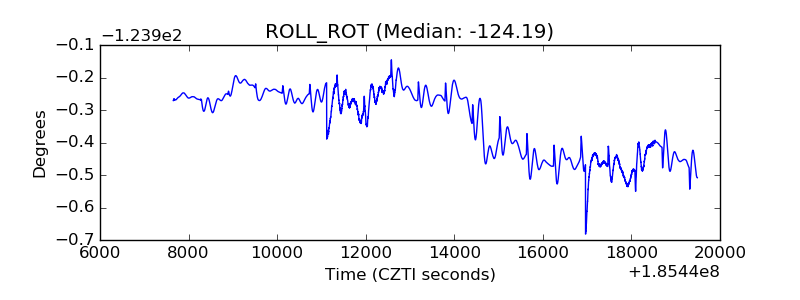 |
| _Roll_DEC | 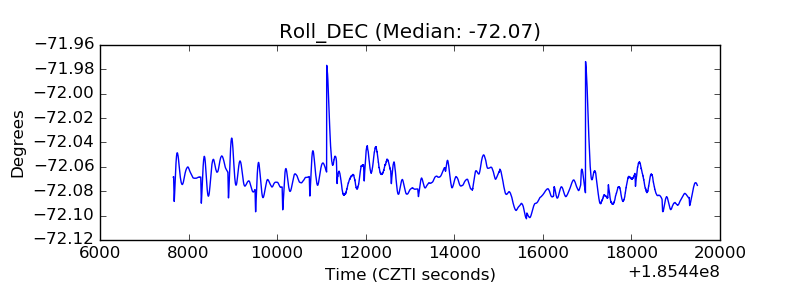 |
| _Roll_RA | 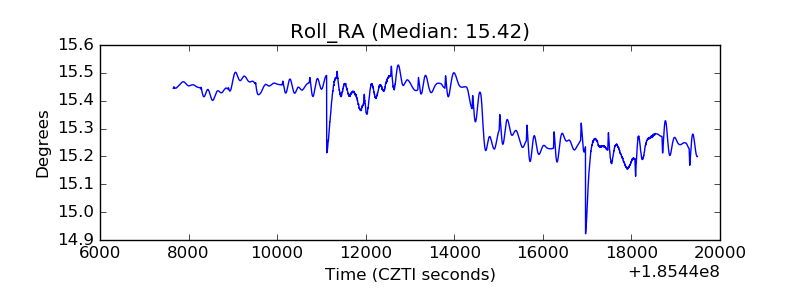 |
| Veto Counter | 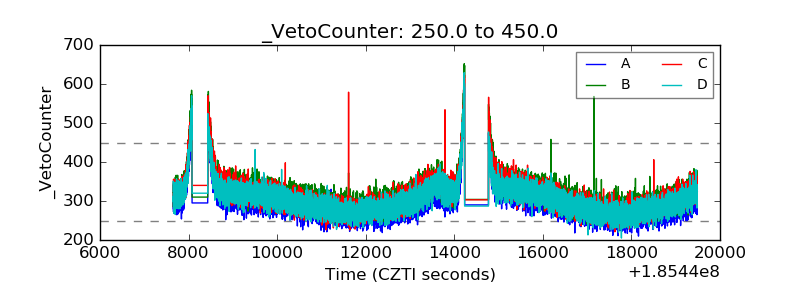 |