| Param | Original file | Final file |
|---|---|---|
| Filename | modeM0/AS1P01_010T01_9000000108_00747cztM0_level2.evt | modeM0/AS1P01_010T01_9000000108_00747cztM0_level2_quad_clean.evt |
| Size (bytes) | 3,441,263,040 | 254,684,160 |
| Size | 3.2 GB | 242.9 MB |
| Events in quadrant A | 22,981,977 | 1,661,209 |
| Events in quadrant B | 30,454,005 | 1,553,200 |
| Events in quadrant C | 21,937,164 | 1,643,309 |
| Events in quadrant D | 27,615,716 | 1,564,739 |
| Mode SS | |||
|---|---|---|---|
| Quadrant | BADHDUFLAG | Total packets | Discarded packets |
| A | 0 | 382 | 0 |
| B | 0 | 382 | 0 |
| C | 0 | 382 | 0 |
| D | 0 | 382 | 0 |
| Mode M0 | |||
|---|---|---|---|
| Quadrant | BADHDUFLAG | Total packets | Discarded packets |
| A | 0 | 81568 | 0 |
| B | 0 | 104038 | 0 |
| C | 0 | 78526 | 0 |
| D | 0 | 95472 | 0 |
| Mode M9 | |||
|---|---|---|---|
| Quadrant | BADHDUFLAG | Total packets | Discarded packets |
| A | 0 | 25 | 0 |
| B | 0 | 25 | 0 |
| C | 0 | 25 | 0 |
| D | 0 | 25 | 0 |
| Quadrant | Total seconds | Saturated seconds | Saturation percentage |
|---|---|---|---|
| A | 18718 | 261 | 1.394380% |
| B | 18720 | 2254 | 12.040598% |
| C | 18718 | 150 | 0.801368% |
| D | 18717 | 1190 | 6.357856% |
Noise dominated data is calculated using 1-second bins in cleaned event files. If a bin has >2000 counts, and if more than 50% of those come from <1% of pixels, then it is considered to be noise-dominated and hence unusable.
| Quadrant | # 1 sec bins | Bins with >0 counts | Bins with >2000 counts | High rate bins dominated by noise | Noise dominated (total time) | Noise dominated (detector-on time) | Marked lightcurve |
|---|---|---|---|---|---|---|---|
| A | 21254 | 18723 | 957 | 957 | 4.50% | 5.11% | 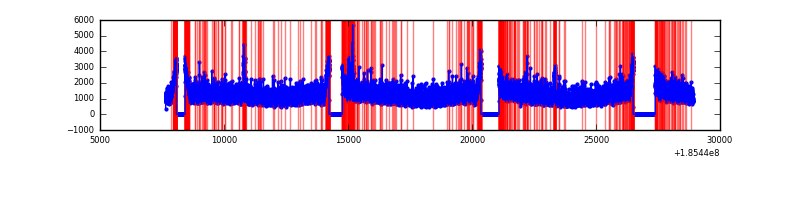 |
| B | 21255 | 18724 | 4249 | 4249 | 19.99% | 22.69% | 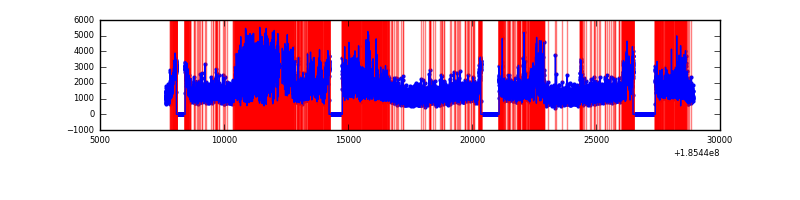 |
| C | 21254 | 18723 | 644 | 644 | 3.03% | 3.44% |  |
| D | 21254 | 18723 | 3370 | 3370 | 15.86% | 18.00% | 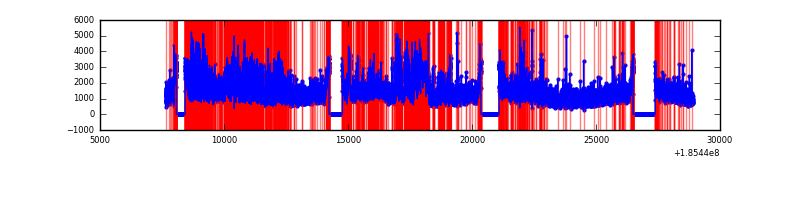 |
Top three noisy pixels from each quadrant. If the there are fewer than three noisy pixels in the level2.evt file, extra rows are filled as -1
| Pixel properties | Quadrant properties | ||||||
|---|---|---|---|---|---|---|---|
| Quadrant | DetID | PixID | Counts | Sigma | Mean | Median | Sigma |
| A | 15 | 233 | 265489 | 182.67 | 5860 | 5898 | 1421.1 |
| A | 15 | 17 | 121613 | 81.43 | 5860 | 5898 | 1421.1 |
| A | 13 | 17 | 88067 | 57.82 | 5860 | 5898 | 1421.1 |
| B | 8 | 38 | 7038114 | 5131.31 | 5818 | 5832 | 1370.5 |
| B | 7 | 221 | 543992 | 392.68 | 5818 | 5832 | 1370.5 |
| B | 0 | 153 | 495585 | 357.36 | 5818 | 5832 | 1370.5 |
| C | 15 | 241 | 150069 | 93.39 | 5519 | 5710 | 1545.8 |
| C | 3 | 111 | 104536 | 63.93 | 5519 | 5710 | 1545.8 |
| C | 3 | 79 | 84309 | 50.85 | 5519 | 5710 | 1545.8 |
| D | 7 | 207 | 6087749 | 3699.82 | 5288 | 5488 | 1643.9 |
| D | 12 | 22 | 558274 | 336.26 | 5288 | 5488 | 1643.9 |
| D | 6 | 226 | 348408 | 208.6 | 5288 | 5488 | 1643.9 |
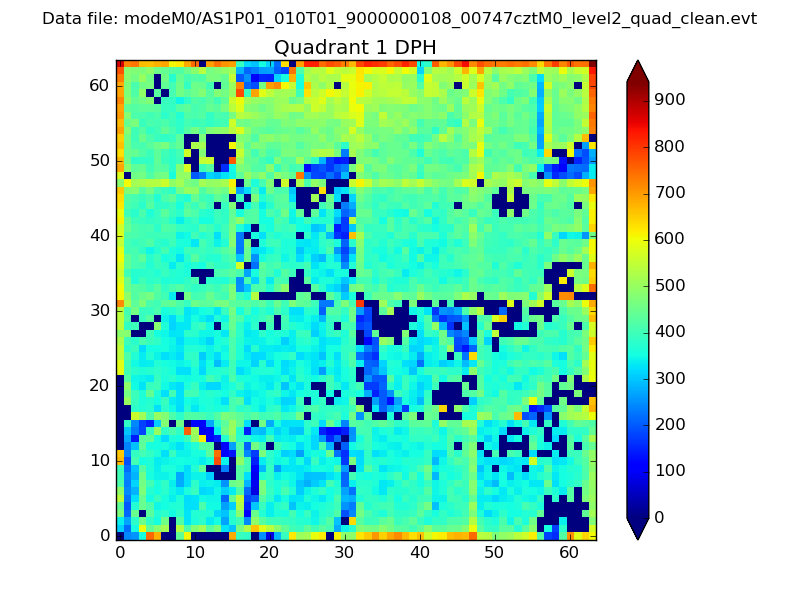
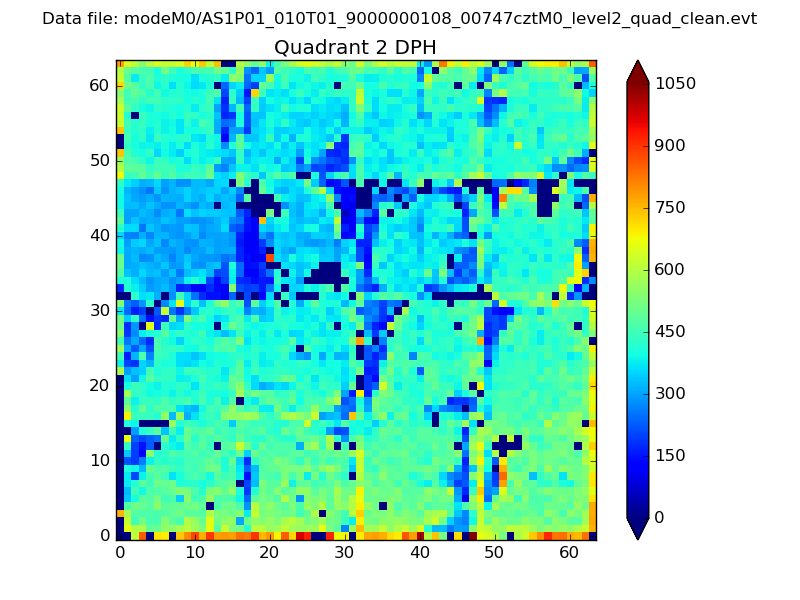
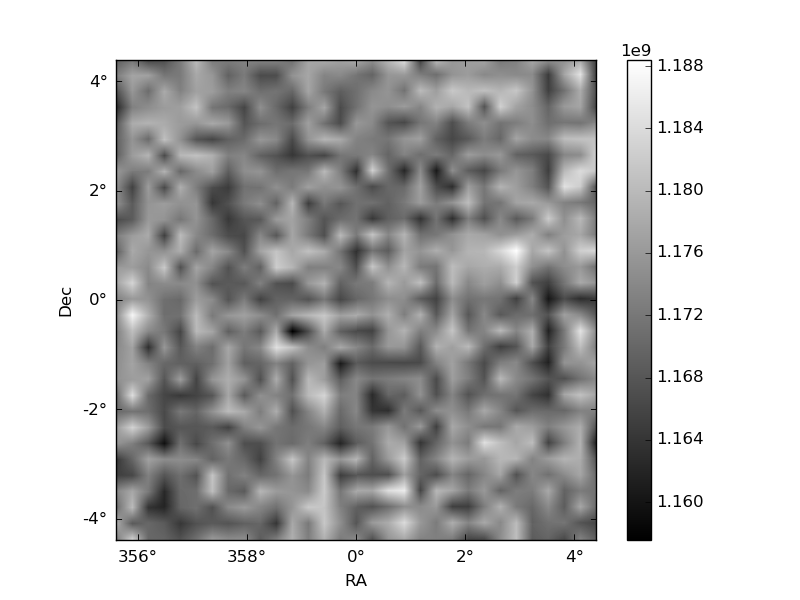
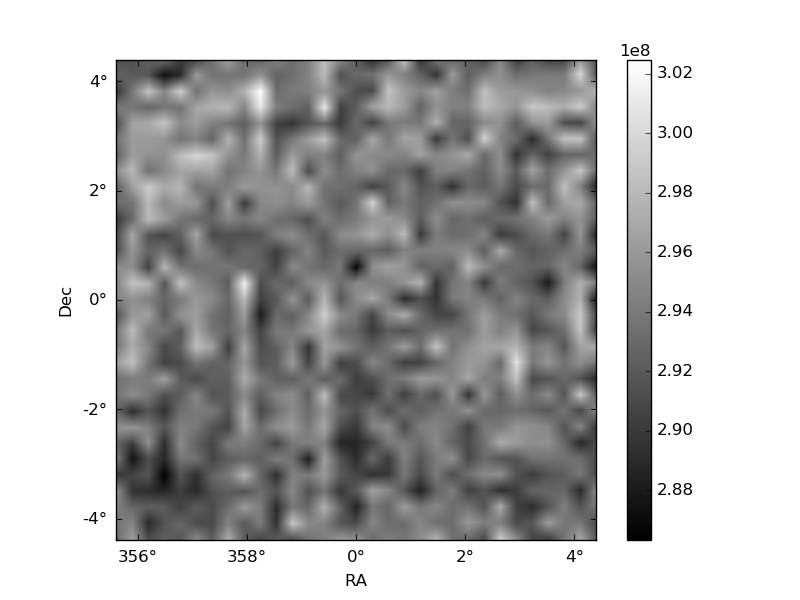
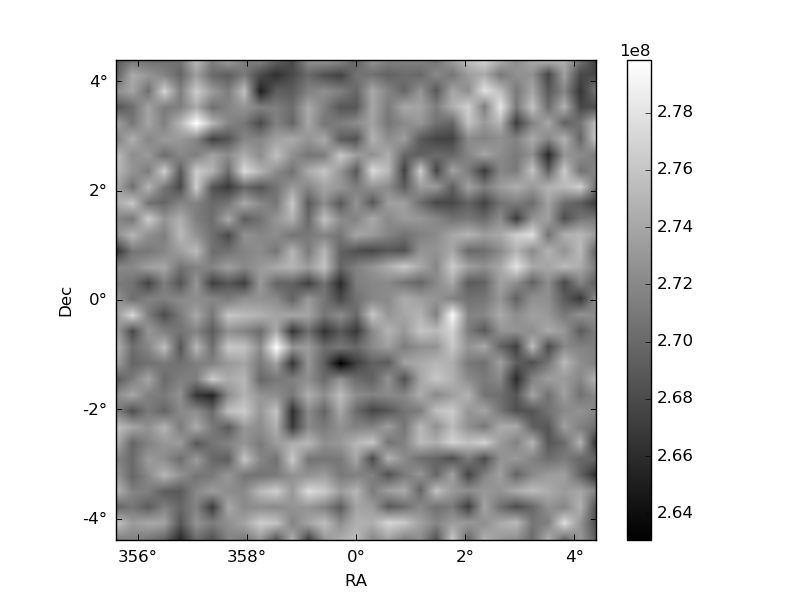
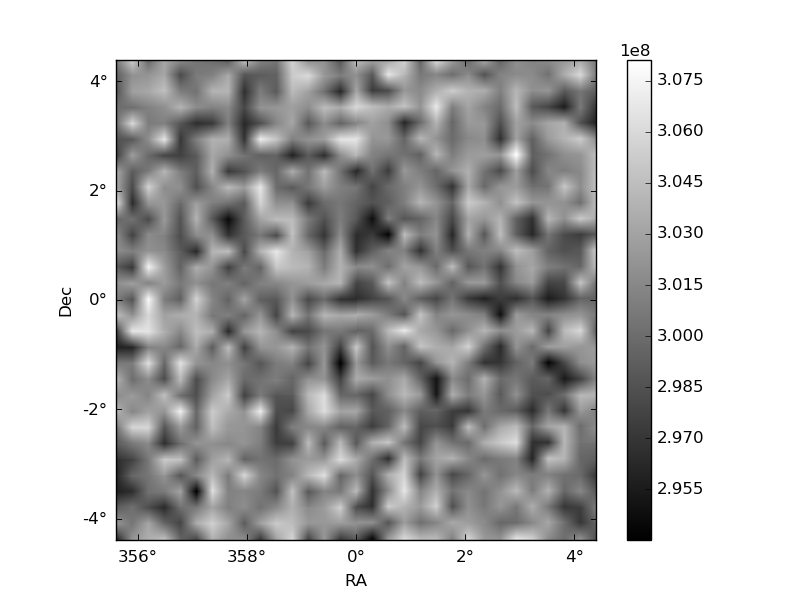
Histogram calculated using DETX and DETY for each event in the final _common_clean file
| Quadrant A | 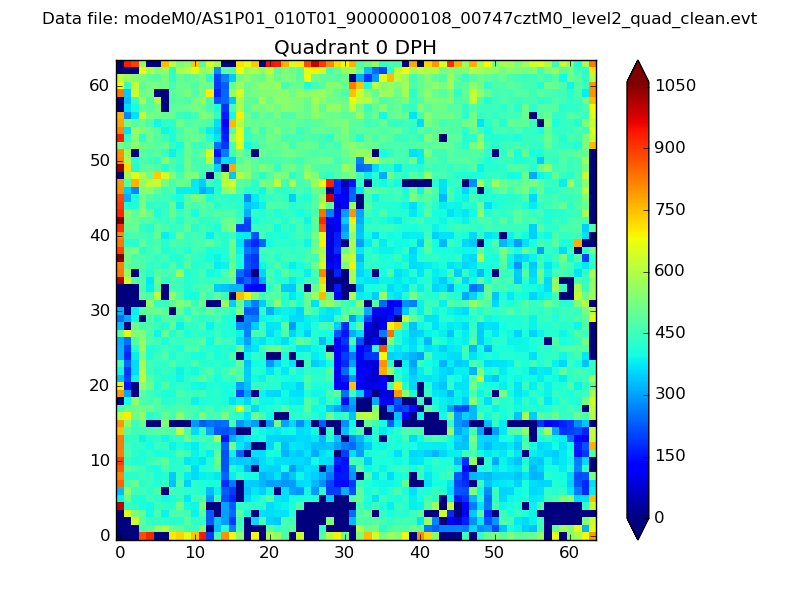 |
 |
Quadrant B |
|---|---|---|---|
| Quadrant D | 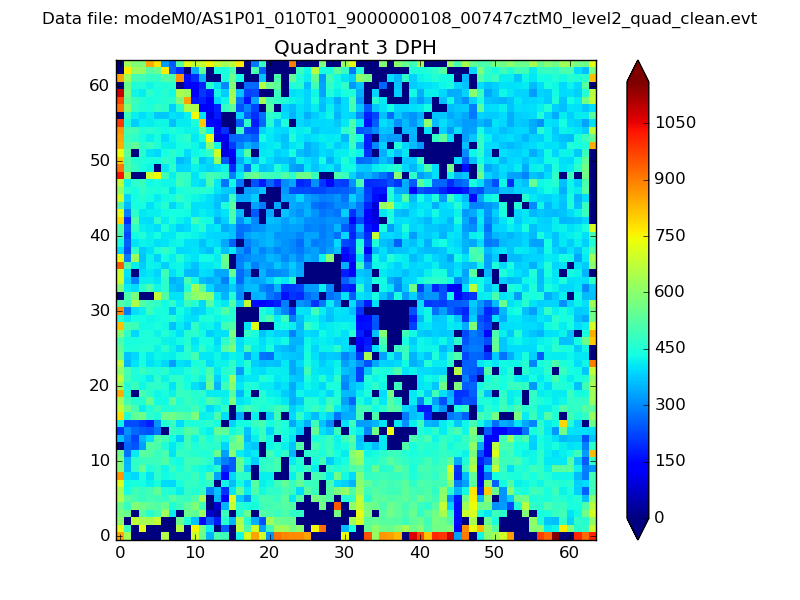 |
 |
Quadrant C |
| Plot type | Count rate plots | Images |
|---|---|---|
| Comparison with Poisson distribution Blue bars denote a histogram of data divided into 1 sec bins. Red curve is a Poisson curve with rate = median count rate of data. |
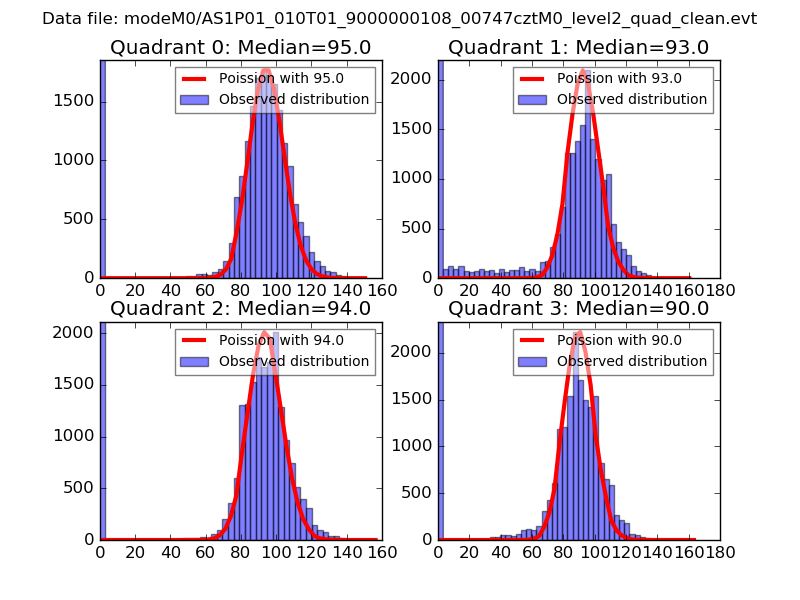 |
 |
| Quadrant-wise count rates Data is divided into 100 sec bins |
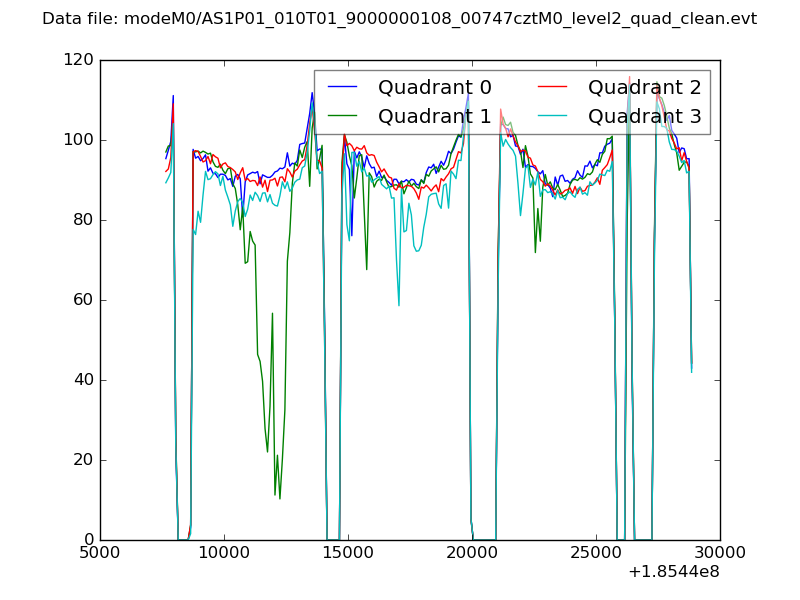 |
|
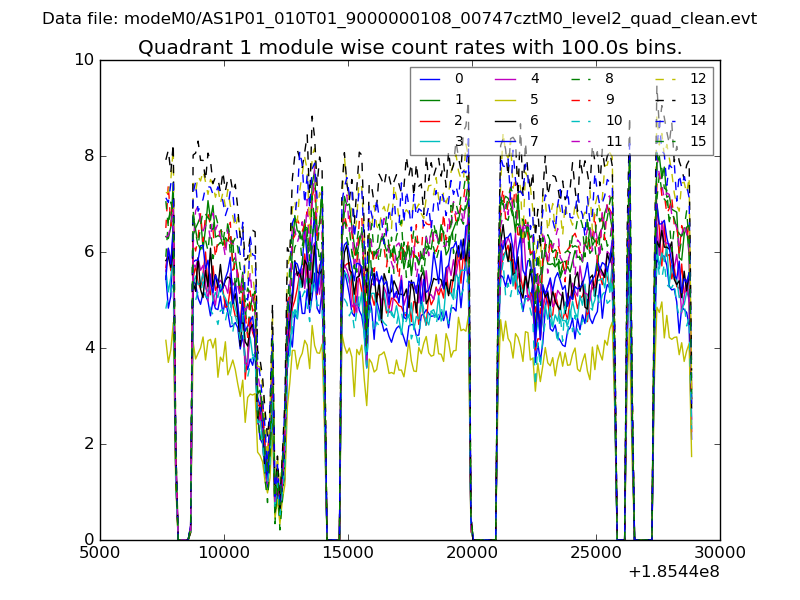
| Module-wise count rates for Quadrant A Data is divided into 100 sec bins |
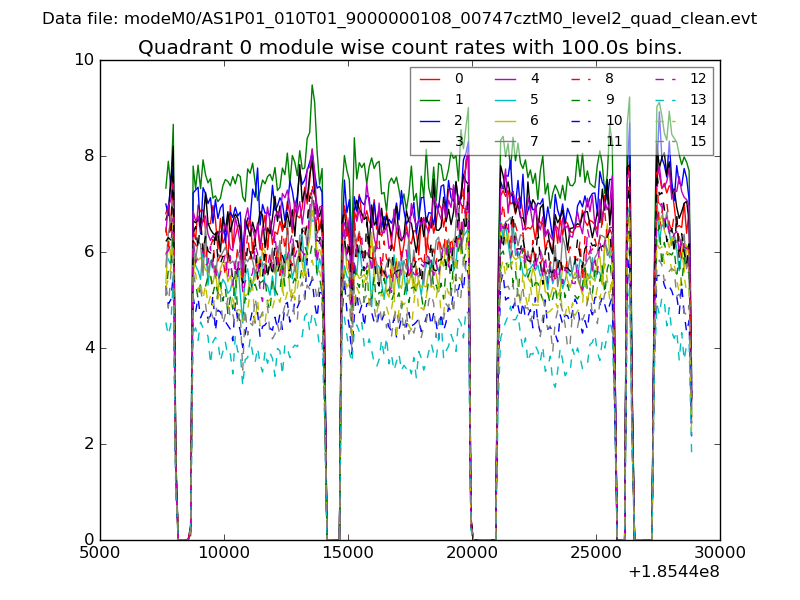 |
 |
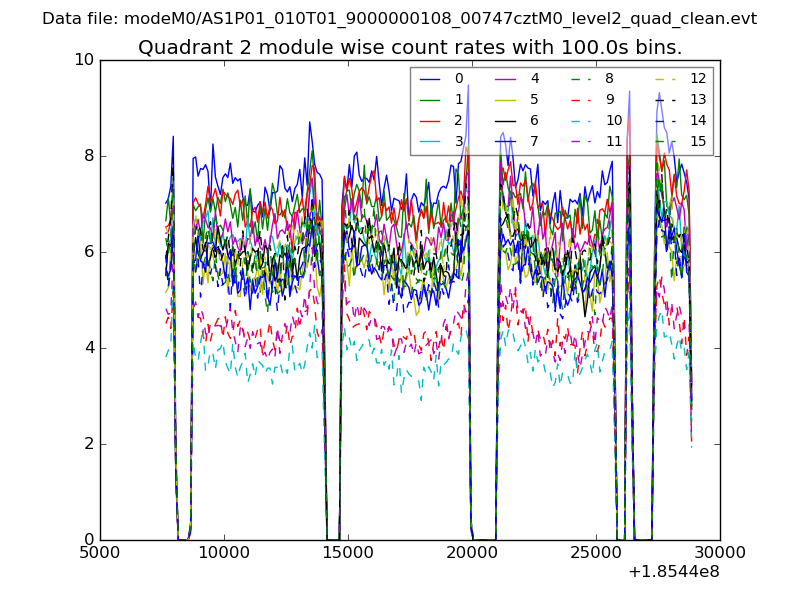
| Module-wise count rates for Quadrant B Data is divided into 100 sec bins |
 |
 |
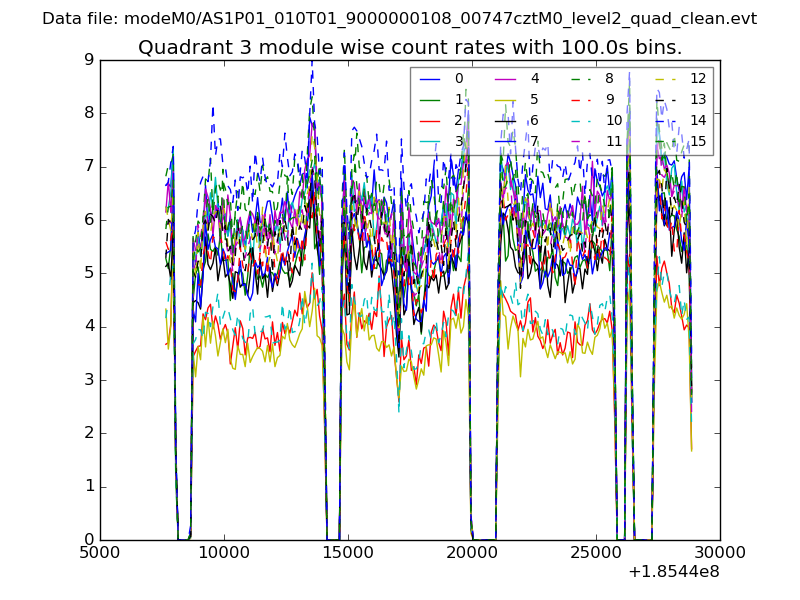
| Module-wise count rates for Quadrant C Data is divided into 100 sec bins |
 |
 |
| Module-wise count rates for Quadrant D Data is divided into 100 sec bins |
 |
 |
| Parameter | Plot |
|---|---|
| CZT HV Monitor | 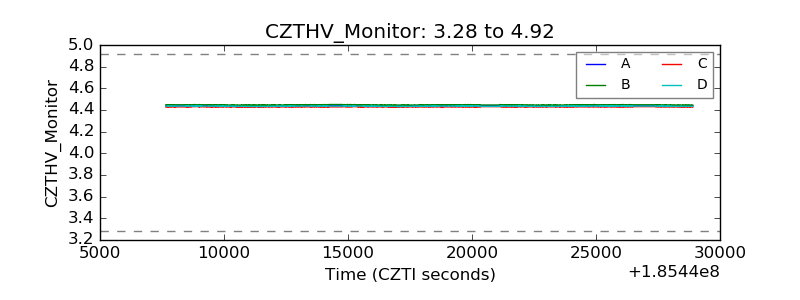 |
| D_VDD | 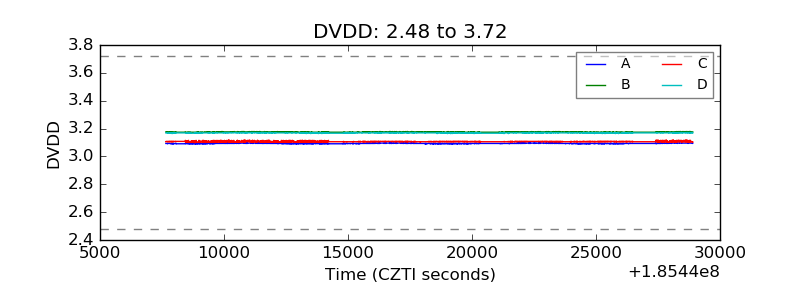 |
| Temperature 1 | 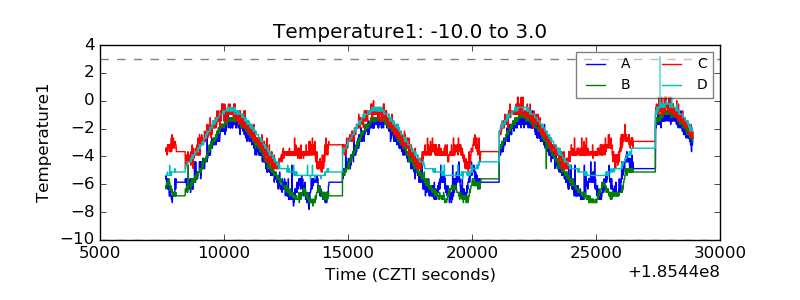 |
| Veto HV Monitor | 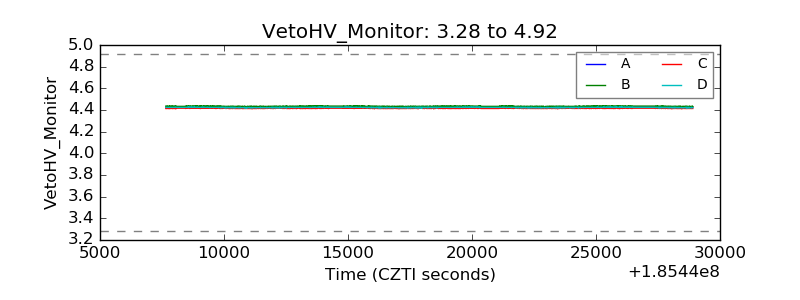 |
| Veto LLD | 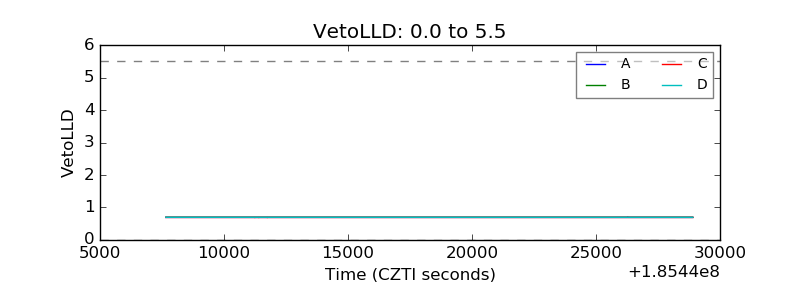 |
| Alpha Counter | 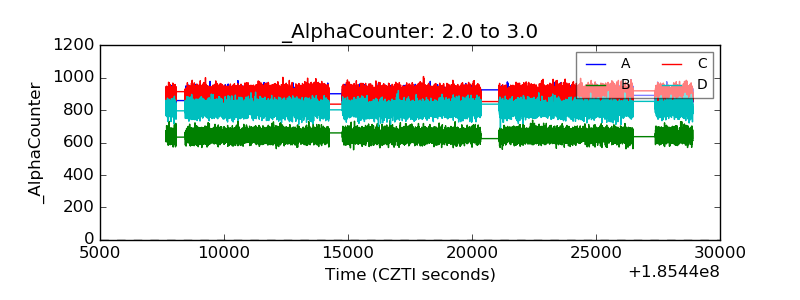 |
| _CPM_Rate | 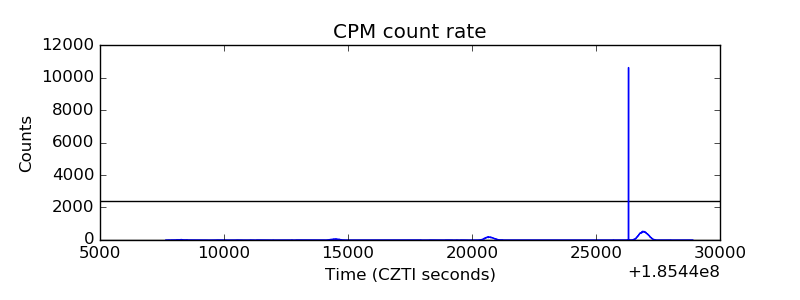 |
| CZT Counter | 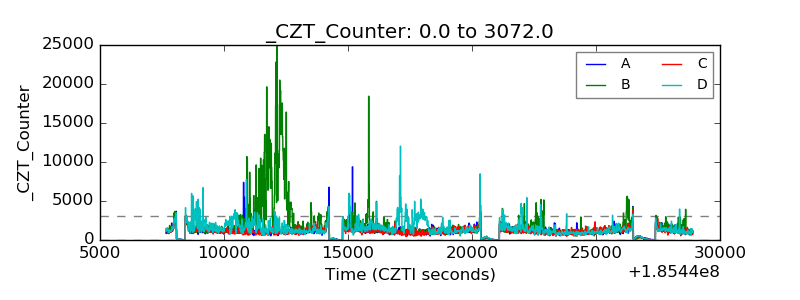 |
| +2.5 Volts monitor |  |
| +5 Volts monitor | 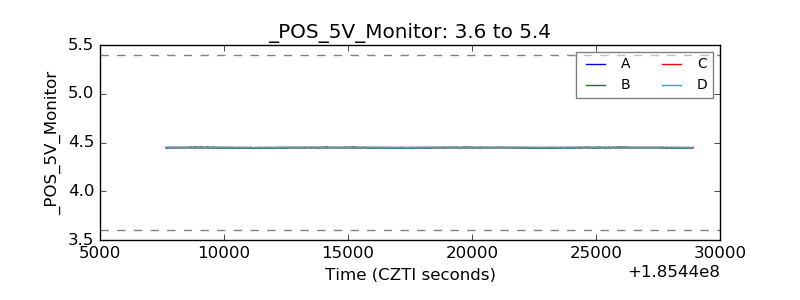 |
| _ROLL_ROT | 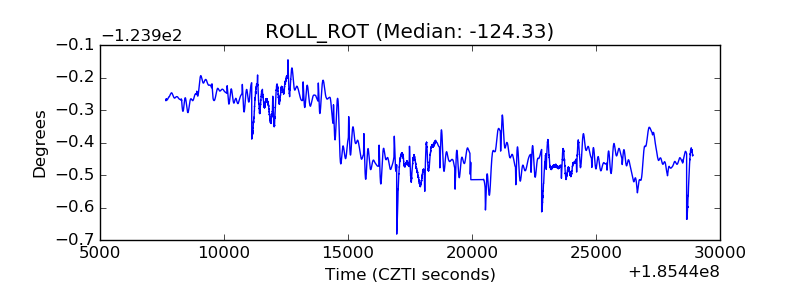 |
| _Roll_DEC | 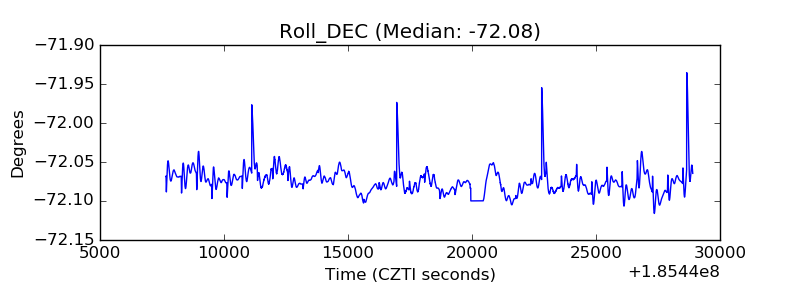 |
| _Roll_RA | 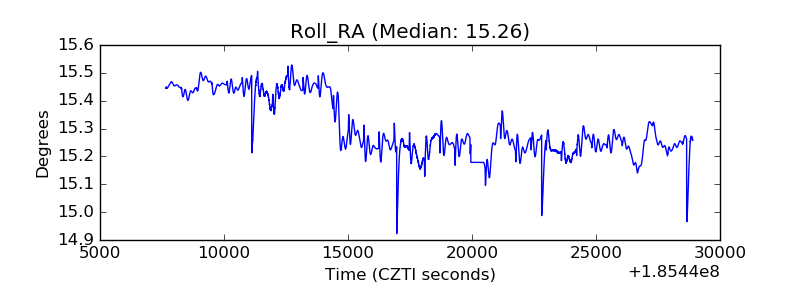 |
| Veto Counter | 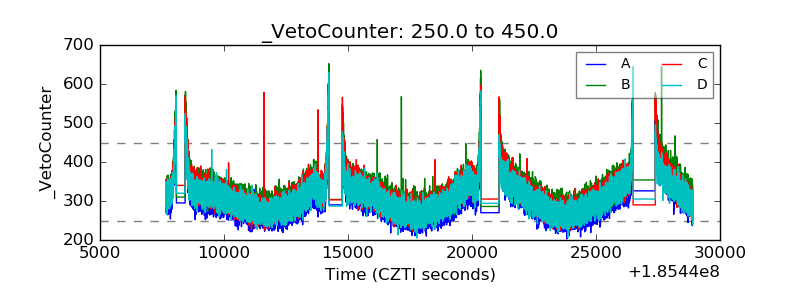 |