| Param | Original file | Final file |
|---|---|---|
| Filename | modeM0/AS1P01_010T01_9000000108_00750cztM0_level2.evt | modeM0/AS1P01_010T01_9000000108_00750cztM0_level2_quad_clean.evt |
| Size (bytes) | 1,144,563,840 | 85,449,600 |
| Size | 1.1 GB | 81.5 MB |
| Events in quadrant A | 7,064,399 | 575,106 |
| Events in quadrant B | 7,453,339 | 581,293 |
| Events in quadrant C | 6,777,755 | 558,055 |
| Events in quadrant D | 12,964,614 | 447,087 |
| Mode SS | |||
|---|---|---|---|
| Quadrant | BADHDUFLAG | Total packets | Discarded packets |
| A | 0 | 124 | 0 |
| B | 0 | 124 | 0 |
| C | 0 | 126 | 0 |
| D | 0 | 126 | 0 |
| Mode M0 | |||
|---|---|---|---|
| Quadrant | BADHDUFLAG | Total packets | Discarded packets |
| A | 0 | 25326 | 0 |
| B | 0 | 26462 | 0 |
| C | 0 | 24450 | 0 |
| D | 0 | 43276 | 0 |
| Mode M9 | |||
|---|---|---|---|
| Quadrant | BADHDUFLAG | Total packets | Discarded packets |
| A | 0 | 11 | 0 |
| B | 0 | 11 | 0 |
| C | 0 | 11 | 0 |
| D | 0 | 11 | 0 |
| Quadrant | Total seconds | Saturated seconds | Saturation percentage |
|---|---|---|---|
| A | 6082 | 1 | 0.016442% |
| B | 6082 | 12 | 0.197304% |
| C | 6083 | 2 | 0.032879% |
| D | 6083 | 2544 | 41.821470% |
Noise dominated data is calculated using 1-second bins in cleaned event files. If a bin has >2000 counts, and if more than 50% of those come from <1% of pixels, then it is considered to be noise-dominated and hence unusable.
| Quadrant | # 1 sec bins | Bins with >0 counts | Bins with >2000 counts | High rate bins dominated by noise | Noise dominated (total time) | Noise dominated (detector-on time) | Marked lightcurve |
|---|---|---|---|---|---|---|---|
| A | 7252 | 6083 | 136 | 136 | 1.88% | 2.24% | 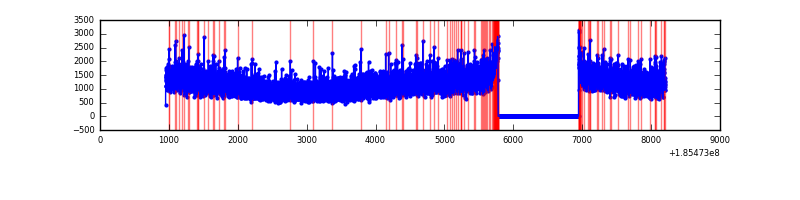 |
| B | 7252 | 6083 | 172 | 172 | 2.37% | 2.83% | 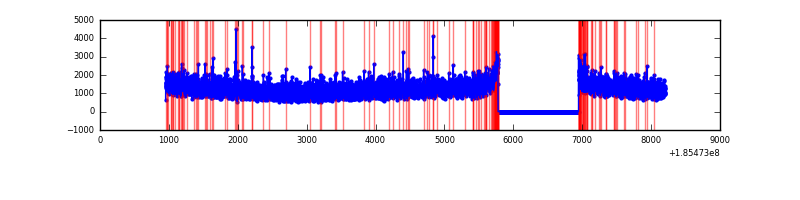 |
| C | 7253 | 6084 | 76 | 76 | 1.05% | 1.25% |  |
| D | 7253 | 6084 | 3279 | 3279 | 45.21% | 53.90% | 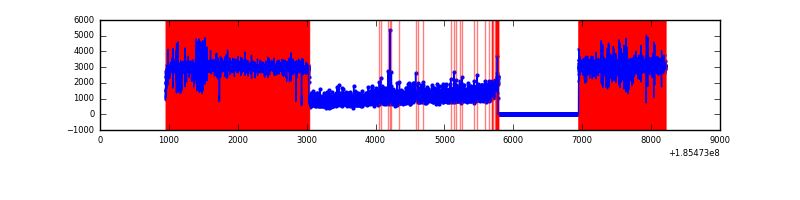 |
Top three noisy pixels from each quadrant. If the there are fewer than three noisy pixels in the level2.evt file, extra rows are filled as -1
| Pixel properties | Quadrant properties | ||||||
|---|---|---|---|---|---|---|---|
| Quadrant | DetID | PixID | Counts | Sigma | Mean | Median | Sigma |
| A | 15 | 233 | 39945 | 86.56 | 1822 | 1841 | 440.2 |
| A | 13 | 17 | 19227 | 39.49 | 1822 | 1841 | 440.2 |
| A | 12 | 189 | 12386 | 23.95 | 1822 | 1841 | 440.2 |
| B | 8 | 234 | 34273 | 72.65 | 1917 | 1930 | 445.2 |
| B | 8 | 38 | 24366 | 50.4 | 1917 | 1930 | 445.2 |
| B | 5 | 191 | 18809 | 37.91 | 1917 | 1930 | 445.2 |
| C | 10 | 207 | 48141 | 98.25 | 1699 | 1757 | 472.1 |
| C | 15 | 241 | 40380 | 81.81 | 1699 | 1757 | 472.1 |
| C | 3 | 111 | 30115 | 60.07 | 1699 | 1757 | 472.1 |
| D | 13 | 25 | 6945578 | 15308.36 | 1471 | 1520 | 453.6 |
| D | 6 | 226 | 264222 | 579.13 | 1471 | 1520 | 453.6 |
| D | 12 | 22 | 125044 | 272.31 | 1471 | 1520 | 453.6 |
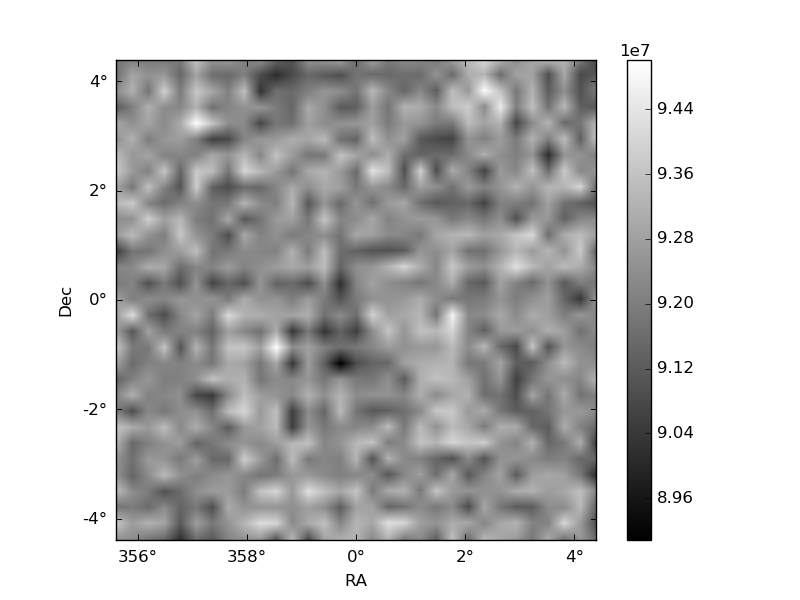
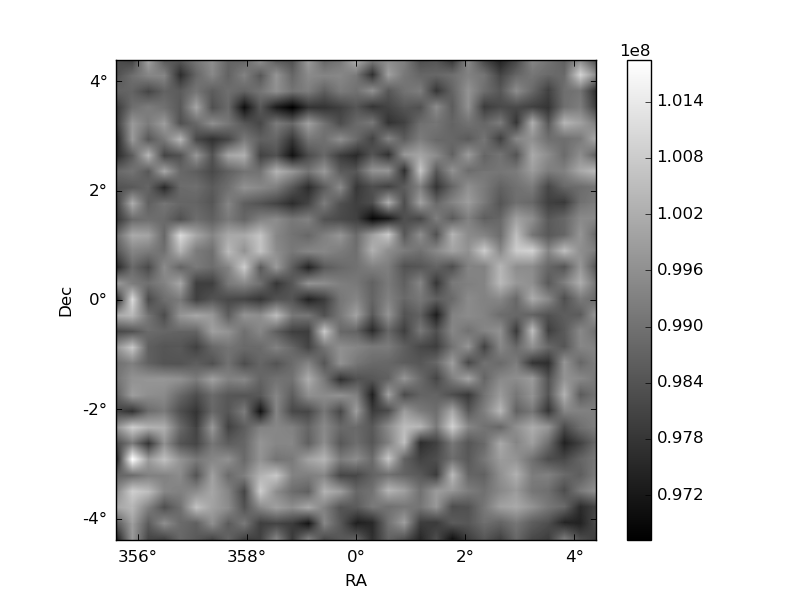
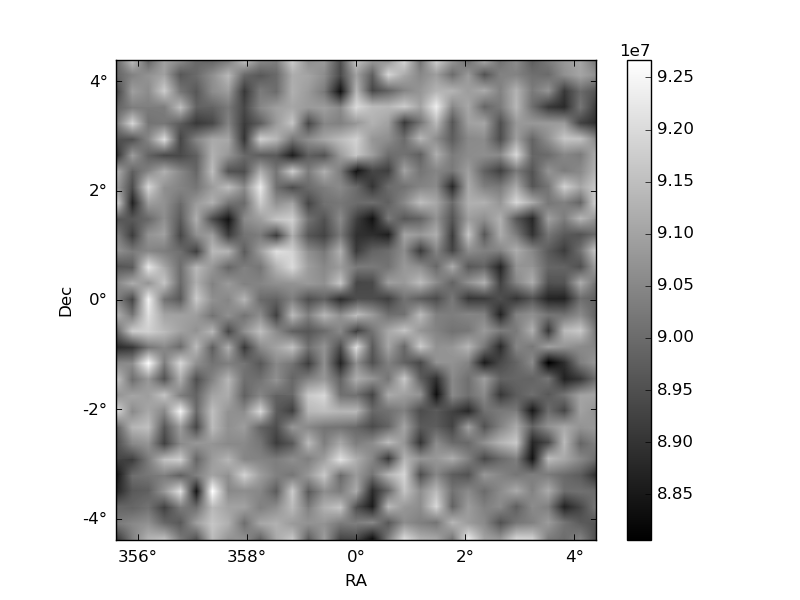
Histogram calculated using DETX and DETY for each event in the final _common_clean file
| Quadrant A |  |
 |
Quadrant B |
|---|---|---|---|
| Quadrant D |  |
 |
Quadrant C |
| Plot type | Count rate plots | Images |
|---|---|---|
| Comparison with Poisson distribution Blue bars denote a histogram of data divided into 1 sec bins. Red curve is a Poisson curve with rate = median count rate of data. |
 |
 |
| Quadrant-wise count rates Data is divided into 100 sec bins |
 |
|
| Module-wise count rates for Quadrant A Data is divided into 100 sec bins |
 |
 |
| Module-wise count rates for Quadrant B Data is divided into 100 sec bins |
 |
 |
| Module-wise count rates for Quadrant C Data is divided into 100 sec bins |
 |
 |
| Module-wise count rates for Quadrant D Data is divided into 100 sec bins |
 |
 |
| Parameter | Plot |
|---|---|
| CZT HV Monitor |  |
| D_VDD | 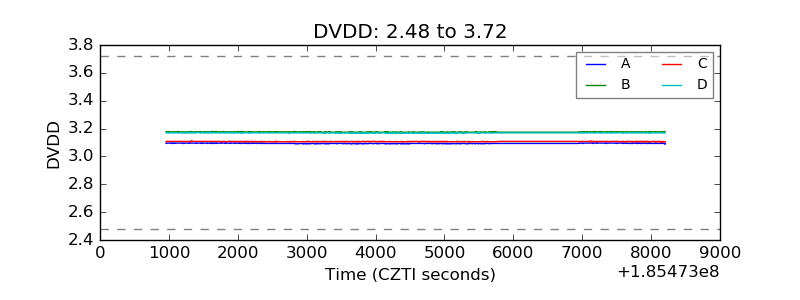 |
| Temperature 1 |  |
| Veto HV Monitor |  |
| Veto LLD |  |
| Alpha Counter |  |
| _CPM_Rate |  |
| CZT Counter |  |
| +2.5 Volts monitor |  |
| +5 Volts monitor |  |
| _ROLL_ROT |  |
| _Roll_DEC |  |
| _Roll_RA |  |
| Veto Counter |  |