| Param | Original file | Final file |
|---|---|---|
| Filename | modeM0/AS1P01_010T01_9000000108_00751cztM0_level2.evt | modeM0/AS1P01_010T01_9000000108_00751cztM0_level2_quad_clean.evt |
| Size (bytes) | 1,061,850,240 | 84,104,640 |
| Size | 1012.7 MB | 80.2 MB |
| Events in quadrant A | 6,880,570 | 571,832 |
| Events in quadrant B | 7,156,570 | 579,345 |
| Events in quadrant C | 6,606,306 | 555,965 |
| Events in quadrant D | 11,122,807 | 426,064 |
| Mode SS | |||
|---|---|---|---|
| Quadrant | BADHDUFLAG | Total packets | Discarded packets |
| A | 0 | 118 | 0 |
| B | 0 | 118 | 0 |
| C | 0 | 118 | 0 |
| D | 0 | 118 | 0 |
| Mode M0 | |||
|---|---|---|---|
| Quadrant | BADHDUFLAG | Total packets | Discarded packets |
| A | 0 | 24630 | 0 |
| B | 0 | 25440 | 0 |
| C | 0 | 23839 | 0 |
| D | 0 | 37612 | 0 |
| Mode M9 | |||
|---|---|---|---|
| Quadrant | BADHDUFLAG | Total packets | Discarded packets |
| A | 0 | 13 | 0 |
| B | 0 | 13 | 0 |
| C | 0 | 13 | 0 |
| D | 0 | 13 | 0 |
| Quadrant | Total seconds | Saturated seconds | Saturation percentage |
|---|---|---|---|
| A | 5913 | 28 | 0.473533% |
| B | 5913 | 5 | 0.084559% |
| C | 5913 | 2 | 0.033824% |
| D | 5913 | 2150 | 36.360561% |
Noise dominated data is calculated using 1-second bins in cleaned event files. If a bin has >2000 counts, and if more than 50% of those come from <1% of pixels, then it is considered to be noise-dominated and hence unusable.
| Quadrant | # 1 sec bins | Bins with >0 counts | Bins with >2000 counts | High rate bins dominated by noise | Noise dominated (total time) | Noise dominated (detector-on time) | Marked lightcurve |
|---|---|---|---|---|---|---|---|
| A | 7148 | 5914 | 149 | 149 | 2.08% | 2.52% | 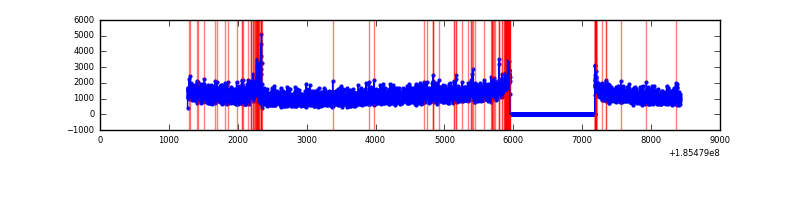 |
| B | 7148 | 5914 | 175 | 175 | 2.45% | 2.96% | 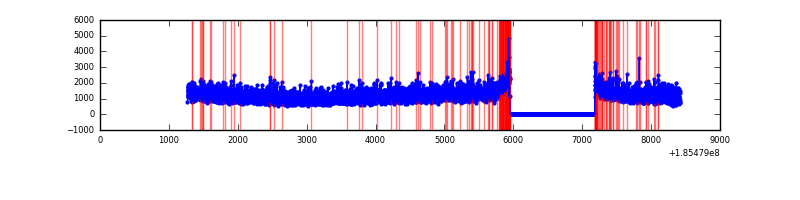 |
| C | 7148 | 5914 | 94 | 94 | 1.32% | 1.59% |  |
| D | 7148 | 5914 | 2397 | 2397 | 33.53% | 40.53% | 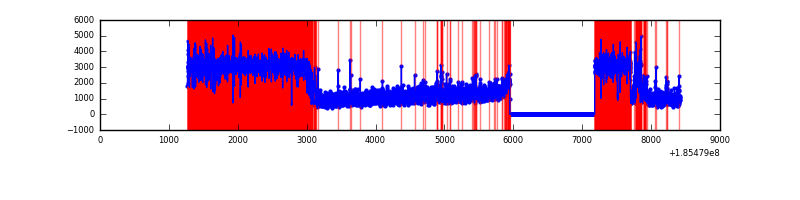 |
Top three noisy pixels from each quadrant. If the there are fewer than three noisy pixels in the level2.evt file, extra rows are filled as -1
| Pixel properties | Quadrant properties | ||||||
|---|---|---|---|---|---|---|---|
| Quadrant | DetID | PixID | Counts | Sigma | Mean | Median | Sigma |
| A | 15 | 233 | 139313 | 326.67 | 1749 | 1761 | 421.1 |
| A | 13 | 17 | 11405 | 22.9 | 1749 | 1761 | 421.1 |
| A | 12 | 189 | 10841 | 21.56 | 1749 | 1761 | 421.1 |
| B | 7 | 221 | 27428 | 59.58 | 1848 | 1856 | 429.2 |
| B | 8 | 234 | 22696 | 48.55 | 1848 | 1856 | 429.2 |
| B | 0 | 190 | 15402 | 31.56 | 1848 | 1856 | 429.2 |
| C | 10 | 207 | 49115 | 103.36 | 1656 | 1711 | 458.6 |
| C | 15 | 241 | 35887 | 74.52 | 1656 | 1711 | 458.6 |
| C | 3 | 111 | 25462 | 51.79 | 1656 | 1711 | 458.6 |
| D | 13 | 25 | 5578866 | 13277.02 | 1368 | 1424 | 420.1 |
| D | 6 | 226 | 197333 | 466.36 | 1368 | 1424 | 420.1 |
| D | 1 | 4 | 65774 | 153.18 | 1368 | 1424 | 420.1 |
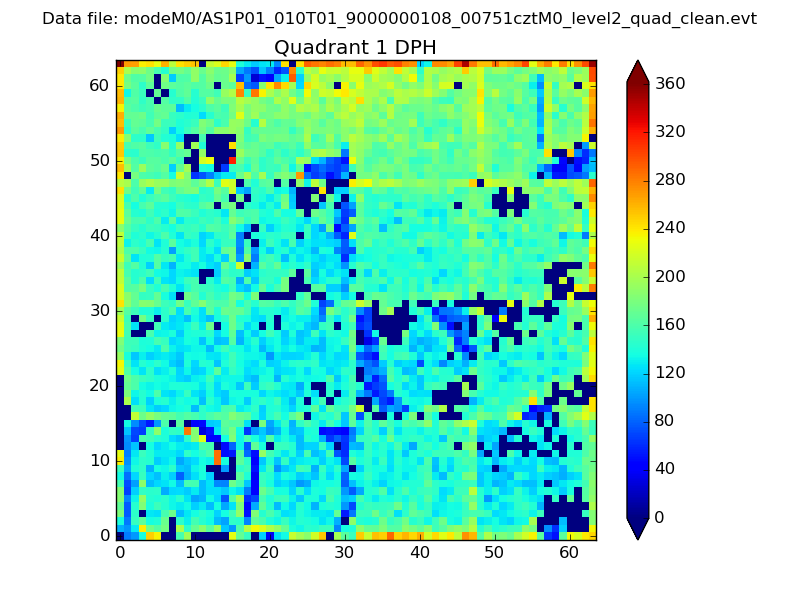
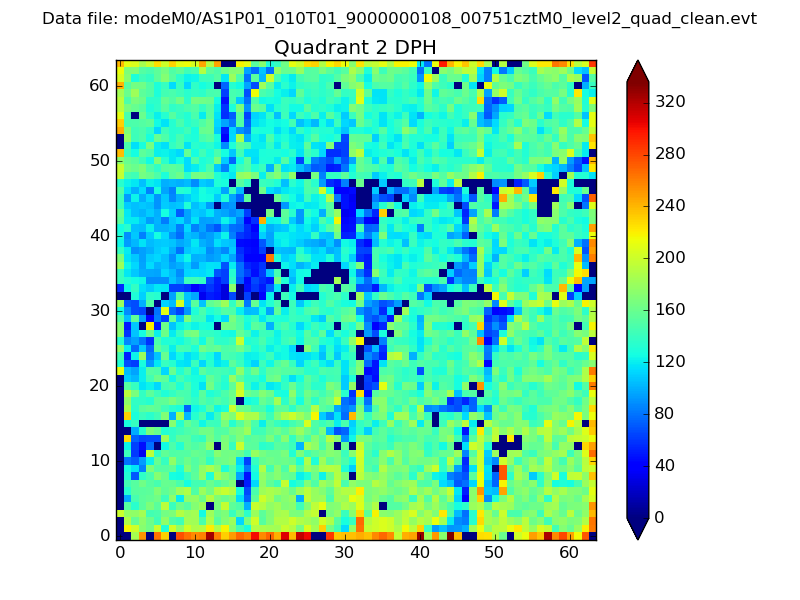
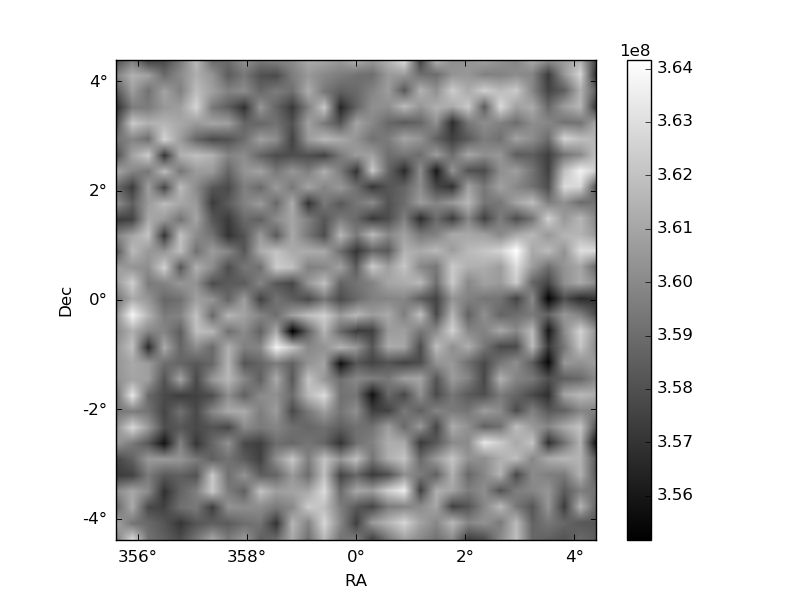
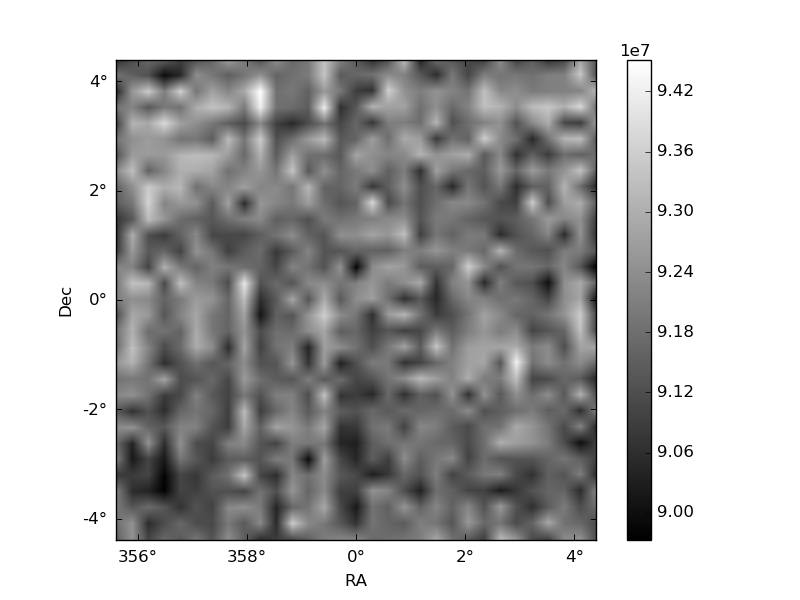
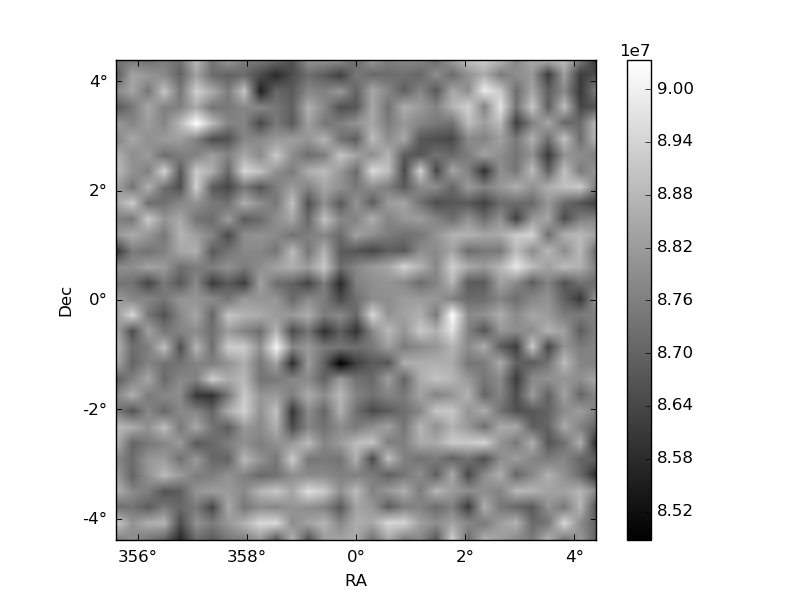
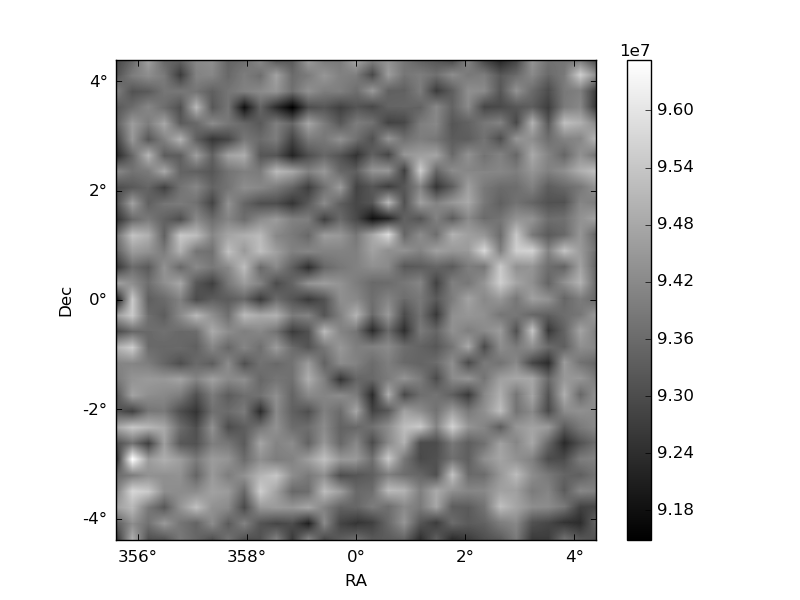
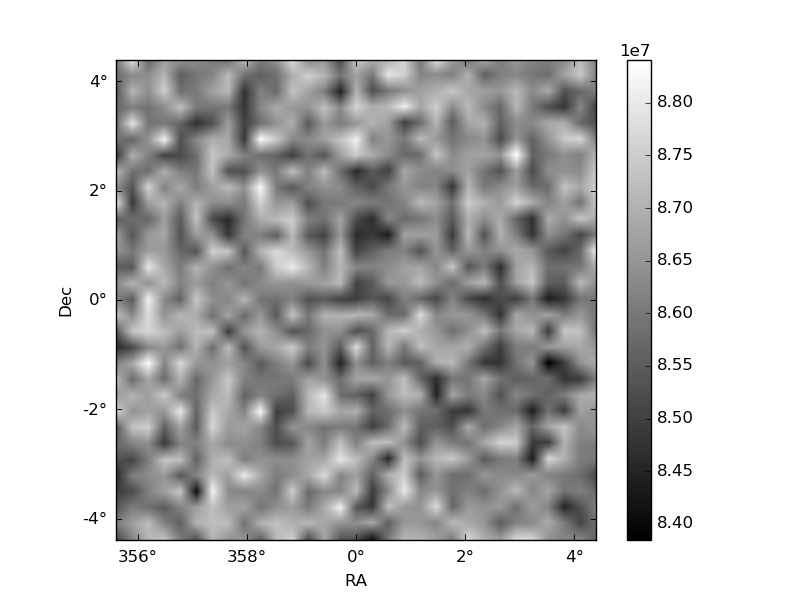
Histogram calculated using DETX and DETY for each event in the final _common_clean file
| Quadrant A | 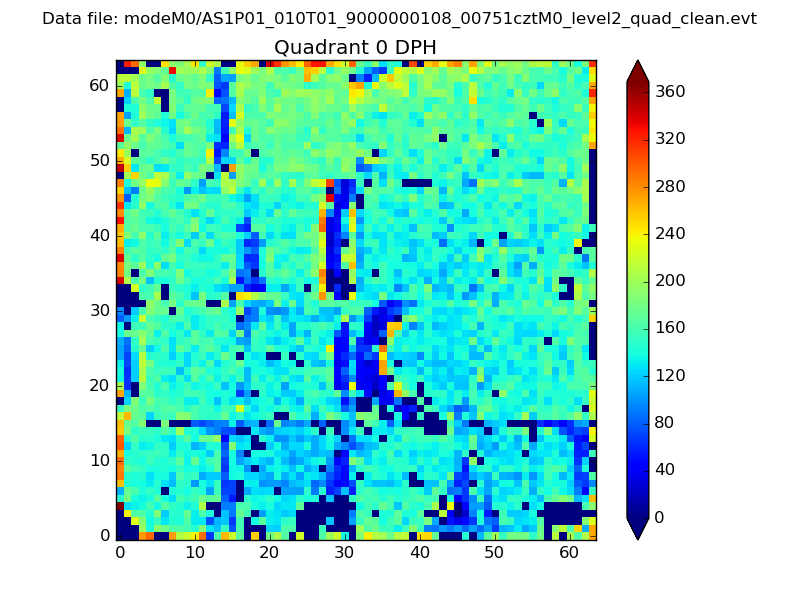 |
 |
Quadrant B |
|---|---|---|---|
| Quadrant D | 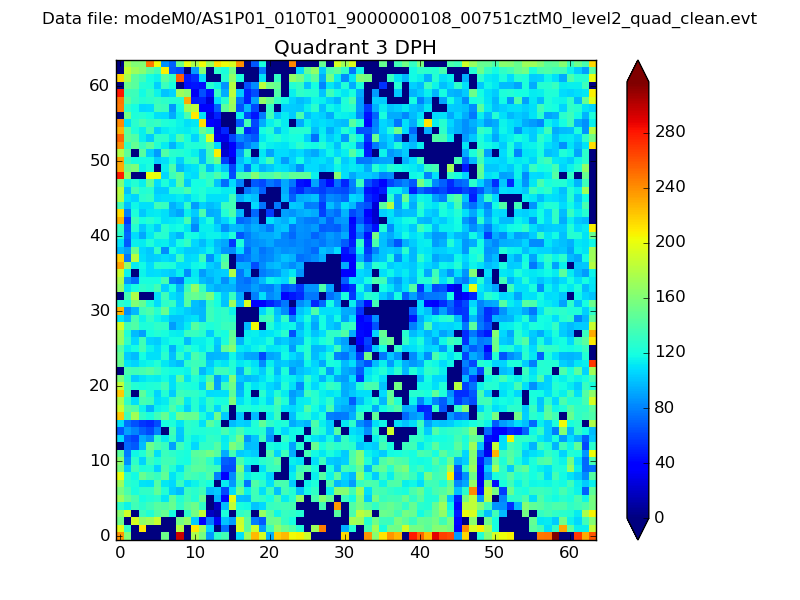 |
 |
Quadrant C |
| Plot type | Count rate plots | Images |
|---|---|---|
| Comparison with Poisson distribution Blue bars denote a histogram of data divided into 1 sec bins. Red curve is a Poisson curve with rate = median count rate of data. |
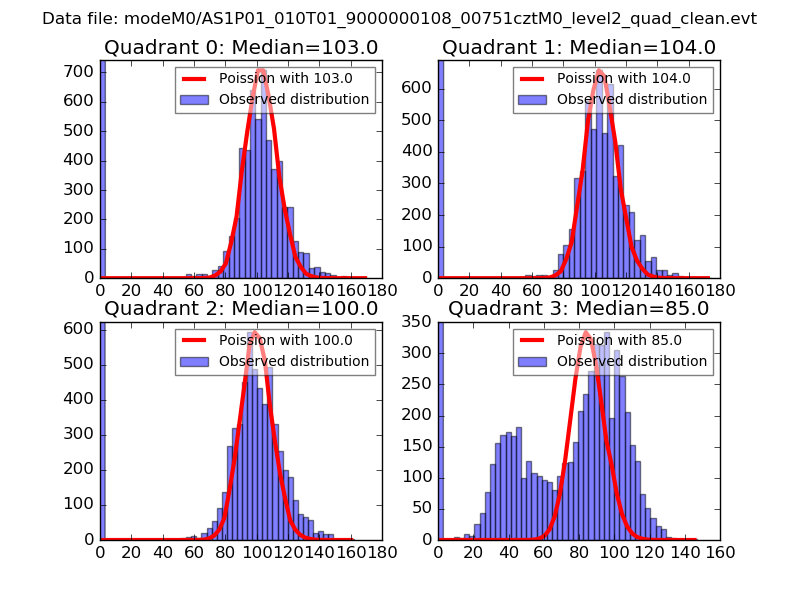 |
 |
| Quadrant-wise count rates Data is divided into 100 sec bins |
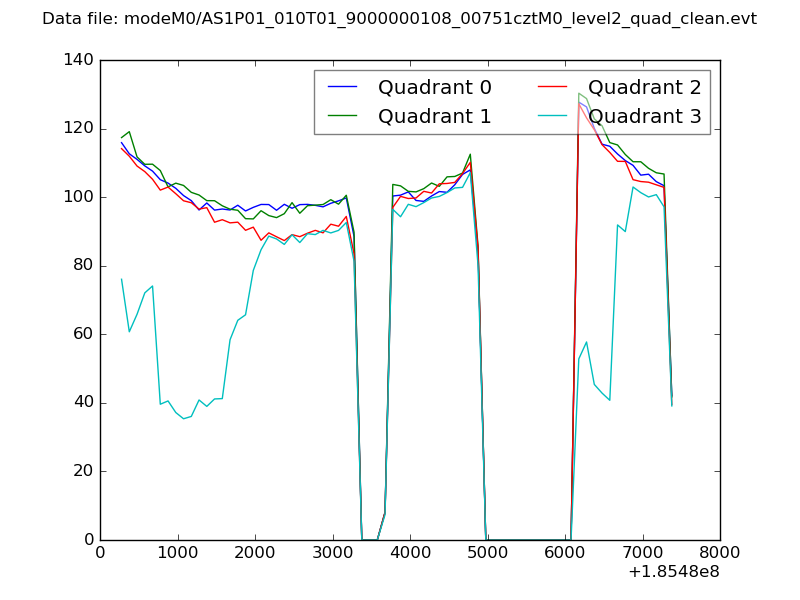 |
|
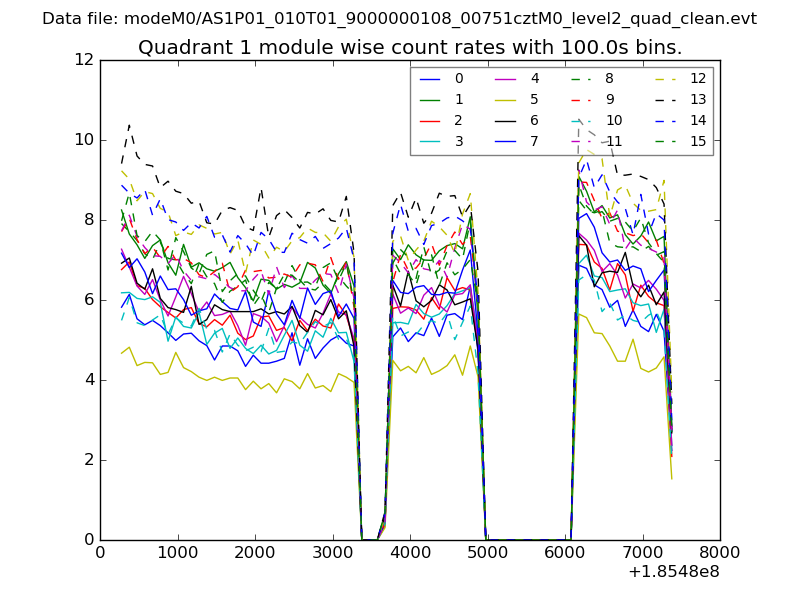
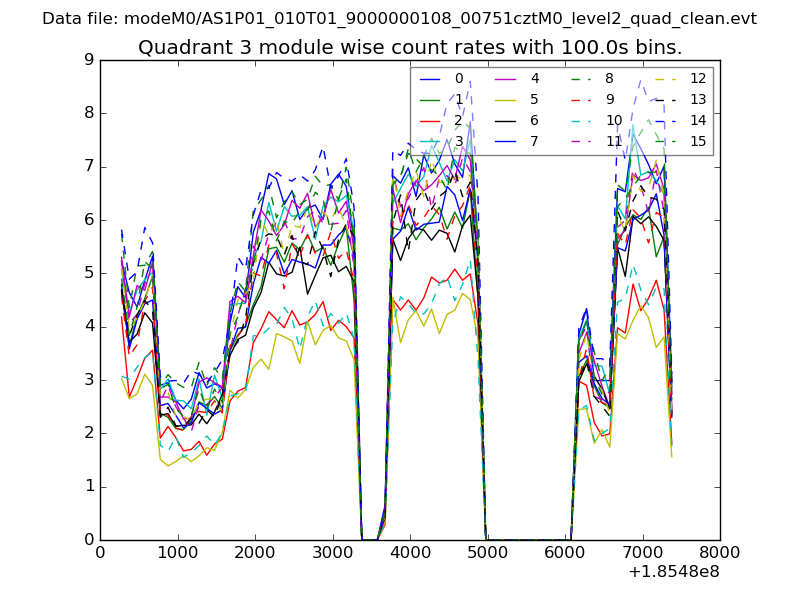
| Module-wise count rates for Quadrant A Data is divided into 100 sec bins |
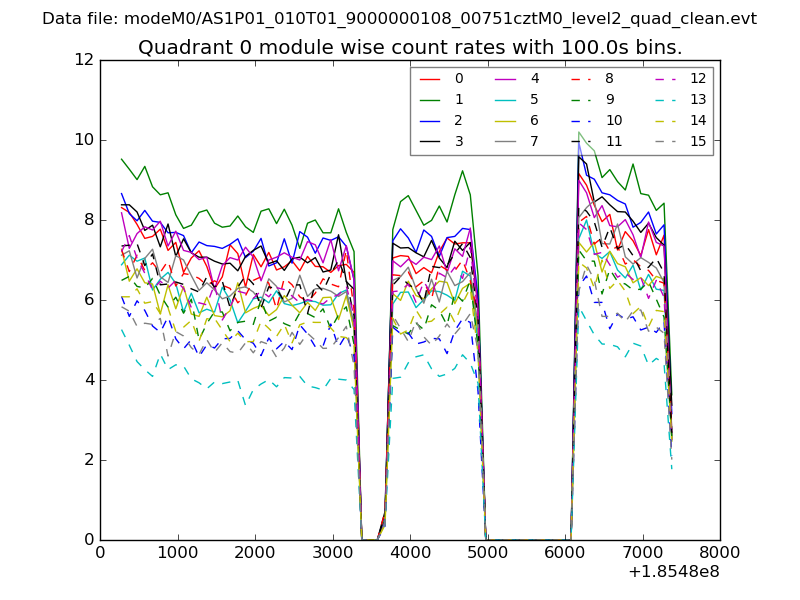 |
 |
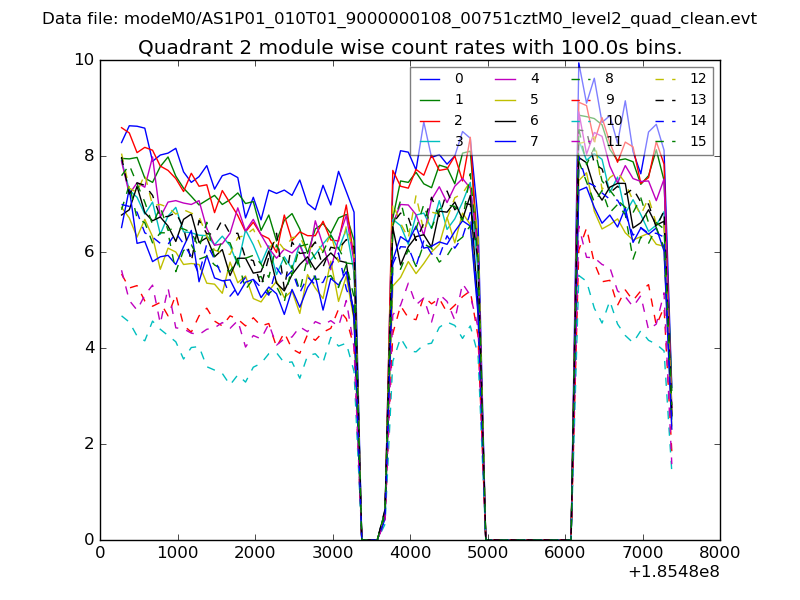
| Module-wise count rates for Quadrant B Data is divided into 100 sec bins |
 |
 |
| Module-wise count rates for Quadrant C Data is divided into 100 sec bins |
 |
 |
| Module-wise count rates for Quadrant D Data is divided into 100 sec bins |
 |
 |
| Parameter | Plot |
|---|---|
| CZT HV Monitor | 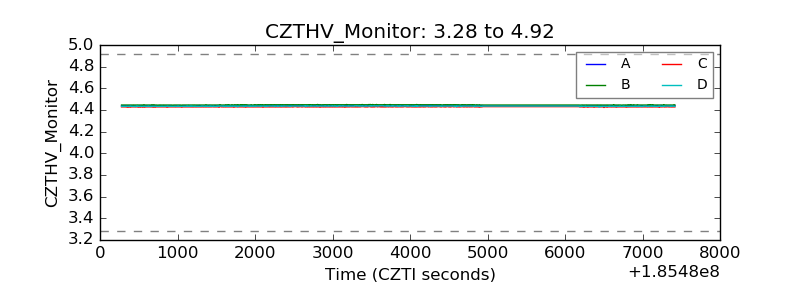 |
| D_VDD | 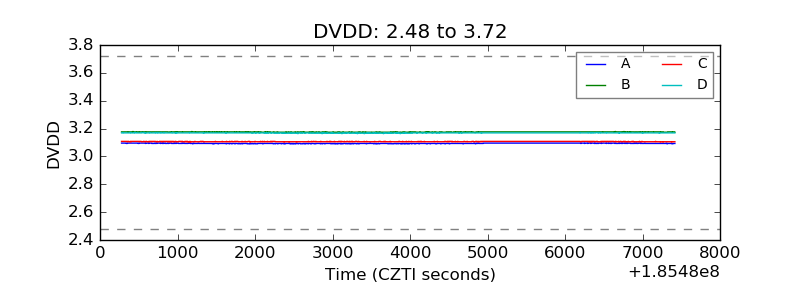 |
| Temperature 1 | 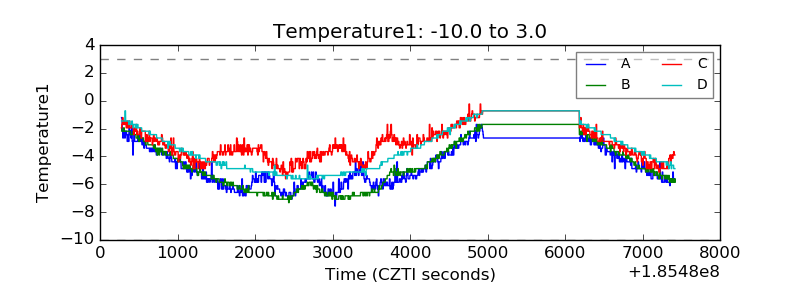 |
| Veto HV Monitor |  |
| Veto LLD | 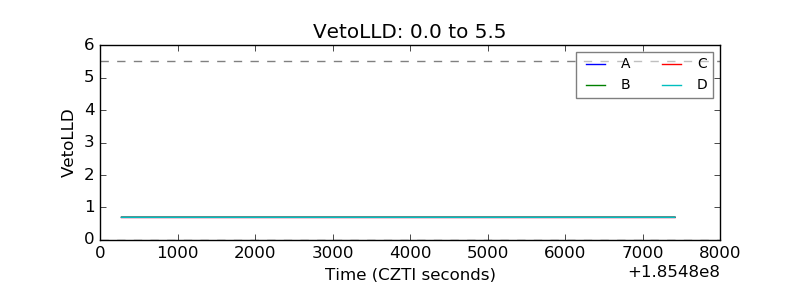 |
| Alpha Counter | 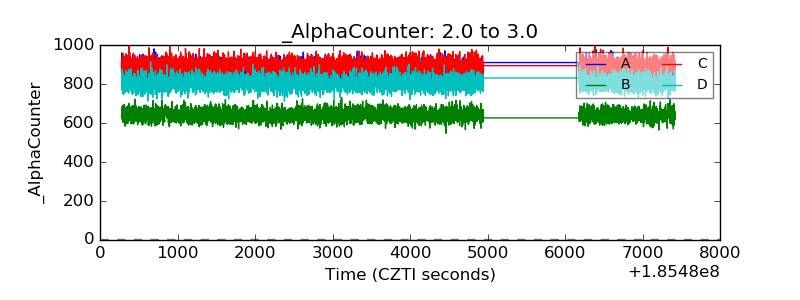 |
| _CPM_Rate | 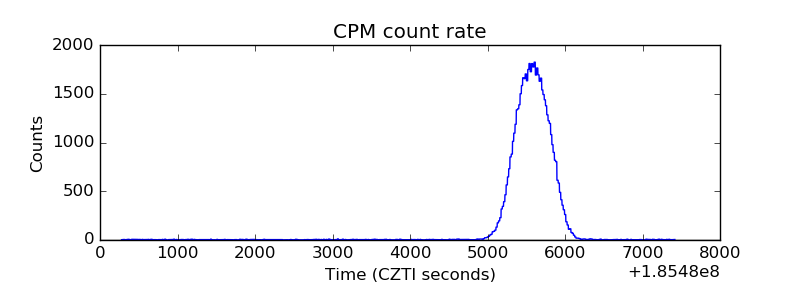 |
| CZT Counter | 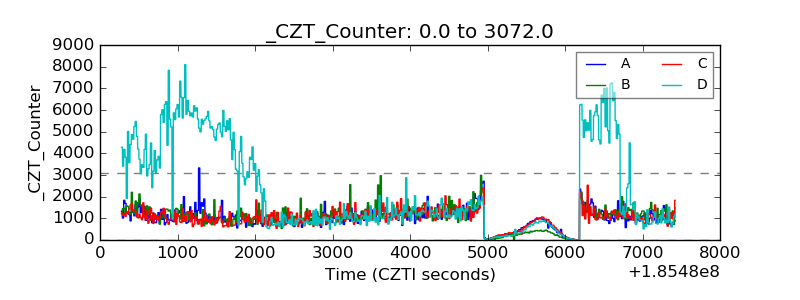 |
| +2.5 Volts monitor |  |
| +5 Volts monitor |  |
| _ROLL_ROT | 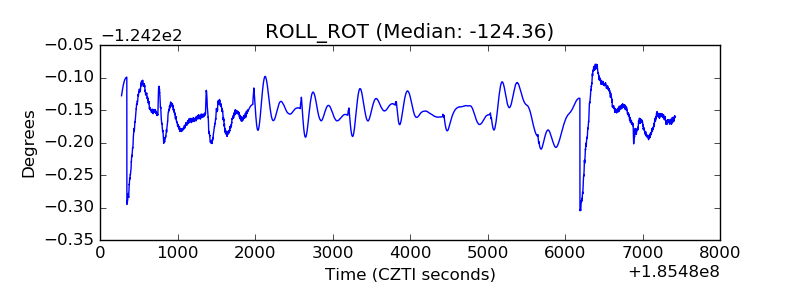 |
| _Roll_DEC | 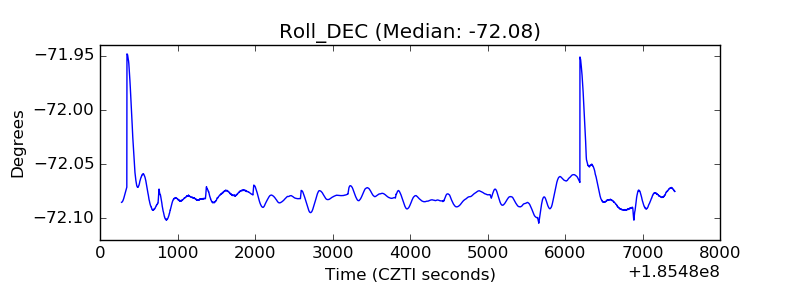 |
| _Roll_RA | 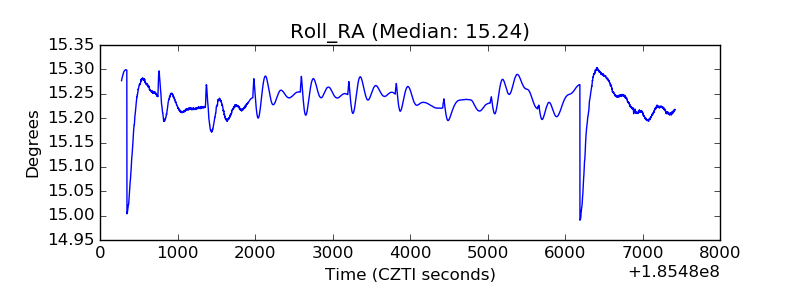 |
| Veto Counter | 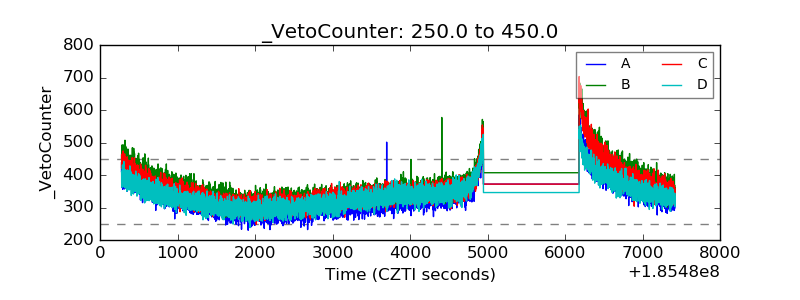 |