| Param | Original file | Final file |
|---|---|---|
| Filename | modeM0/AS1P01_010T01_9000000108_00752cztM0_level2.evt | modeM0/AS1P01_010T01_9000000108_00752cztM0_level2_quad_clean.evt |
| Size (bytes) | 1,082,436,480 | 92,655,360 |
| Size | 1.0 GB | 88.4 MB |
| Events in quadrant A | 7,167,817 | 615,788 |
| Events in quadrant B | 7,620,460 | 628,734 |
| Events in quadrant C | 7,092,185 | 605,276 |
| Events in quadrant D | 10,487,231 | 519,679 |
| Mode SS | |||
|---|---|---|---|
| Quadrant | BADHDUFLAG | Total packets | Discarded packets |
| A | 0 | 126 | 0 |
| B | 0 | 126 | 0 |
| C | 0 | 126 | 0 |
| D | 0 | 126 | 0 |
| Mode M0 | |||
|---|---|---|---|
| Quadrant | BADHDUFLAG | Total packets | Discarded packets |
| A | 0 | 25698 | 0 |
| B | 0 | 27057 | 0 |
| C | 0 | 25493 | 0 |
| D | 0 | 35729 | 0 |
| Mode M9 | |||
|---|---|---|---|
| Quadrant | BADHDUFLAG | Total packets | Discarded packets |
| A | 0 | 15 | 0 |
| B | 0 | 15 | 0 |
| C | 0 | 15 | 0 |
| D | 0 | 15 | 0 |
| Quadrant | Total seconds | Saturated seconds | Saturation percentage |
|---|---|---|---|
| A | 6242 | 6 | 0.096123% |
| B | 6242 | 5 | 0.080103% |
| C | 6242 | 2 | 0.032041% |
| D | 6242 | 1084 | 17.366229% |
Noise dominated data is calculated using 1-second bins in cleaned event files. If a bin has >2000 counts, and if more than 50% of those come from <1% of pixels, then it is considered to be noise-dominated and hence unusable.
| Quadrant | # 1 sec bins | Bins with >0 counts | Bins with >2000 counts | High rate bins dominated by noise | Noise dominated (total time) | Noise dominated (detector-on time) | Marked lightcurve |
|---|---|---|---|---|---|---|---|
| A | 7517 | 6243 | 145 | 145 | 1.93% | 2.32% | 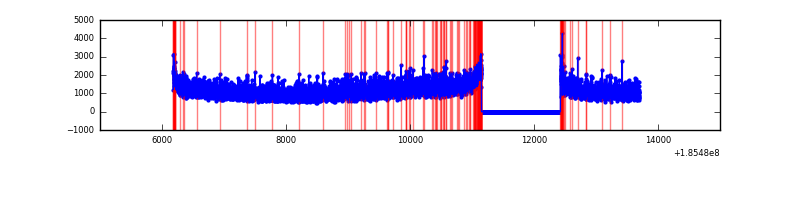 |
| B | 7517 | 6243 | 207 | 207 | 2.75% | 3.32% | 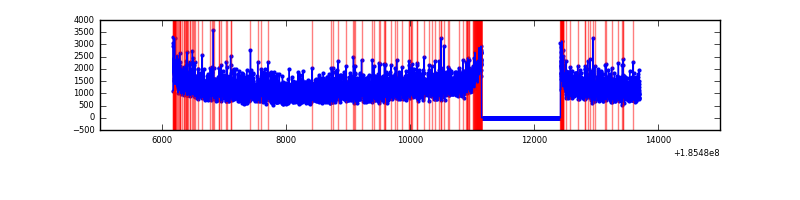 |
| C | 7517 | 6243 | 119 | 119 | 1.58% | 1.91% |  |
| D | 7517 | 6243 | 1970 | 1970 | 26.21% | 31.56% | 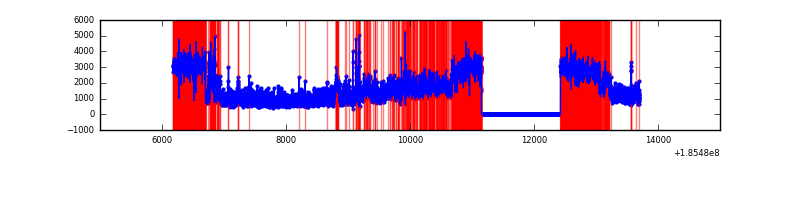 |
Top three noisy pixels from each quadrant. If the there are fewer than three noisy pixels in the level2.evt file, extra rows are filled as -1
| Pixel properties | Quadrant properties | ||||||
|---|---|---|---|---|---|---|---|
| Quadrant | DetID | PixID | Counts | Sigma | Mean | Median | Sigma |
| A | 15 | 233 | 13690 | 26.43 | 1859 | 1871 | 447.2 |
| A | 15 | 17 | 11143 | 20.73 | 1859 | 1871 | 447.2 |
| A | 12 | 189 | 10696 | 19.73 | 1859 | 1871 | 447.2 |
| B | 0 | 220 | 20235 | 39.67 | 1984 | 1995 | 459.8 |
| B | 5 | 249 | 12513 | 22.88 | 1984 | 1995 | 459.8 |
| B | 8 | 38 | 12337 | 22.49 | 1984 | 1995 | 459.8 |
| C | 15 | 241 | 43959 | 85.43 | 1781 | 1839 | 493.0 |
| C | 5 | 234 | 38453 | 74.26 | 1781 | 1839 | 493.0 |
| C | 3 | 111 | 25491 | 47.97 | 1781 | 1839 | 493.0 |
| D | 13 | 25 | 3893537 | 8017.9 | 1580 | 1635 | 485.4 |
| D | 12 | 22 | 157178 | 320.44 | 1580 | 1635 | 485.4 |
| D | 6 | 226 | 146445 | 298.33 | 1580 | 1635 | 485.4 |
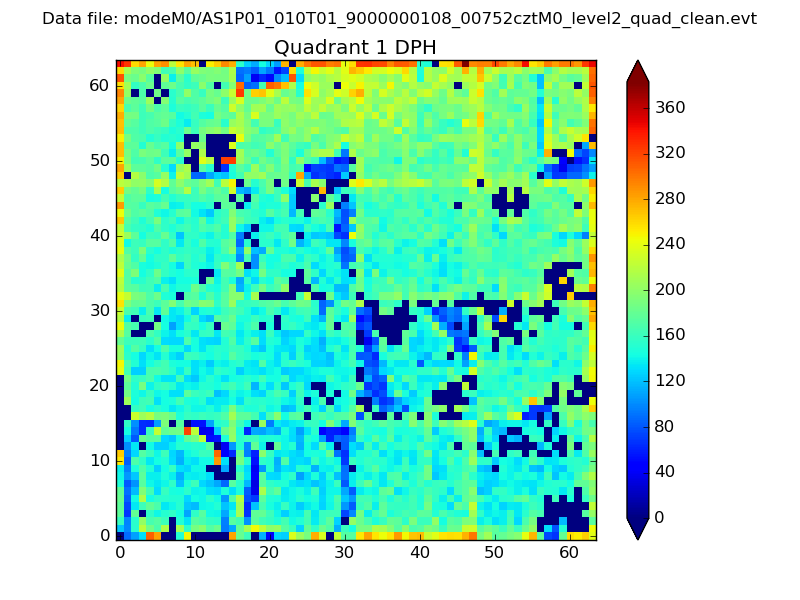
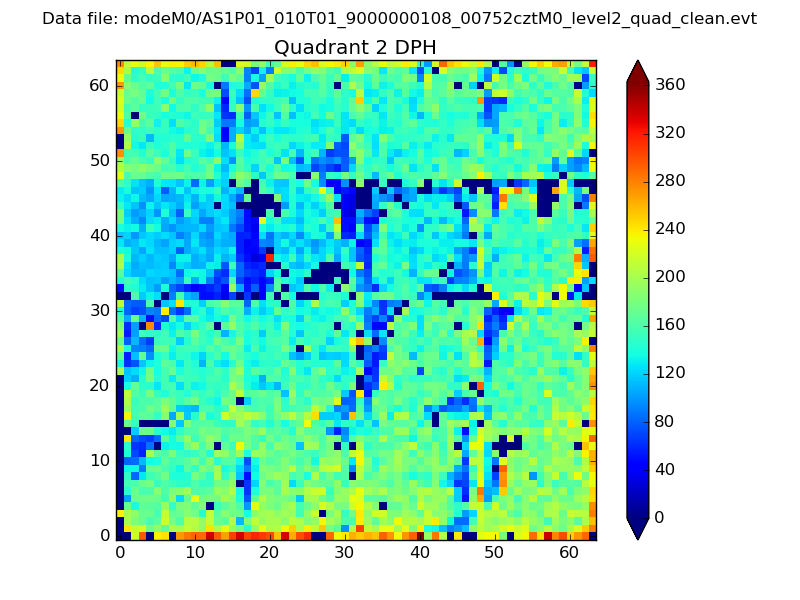
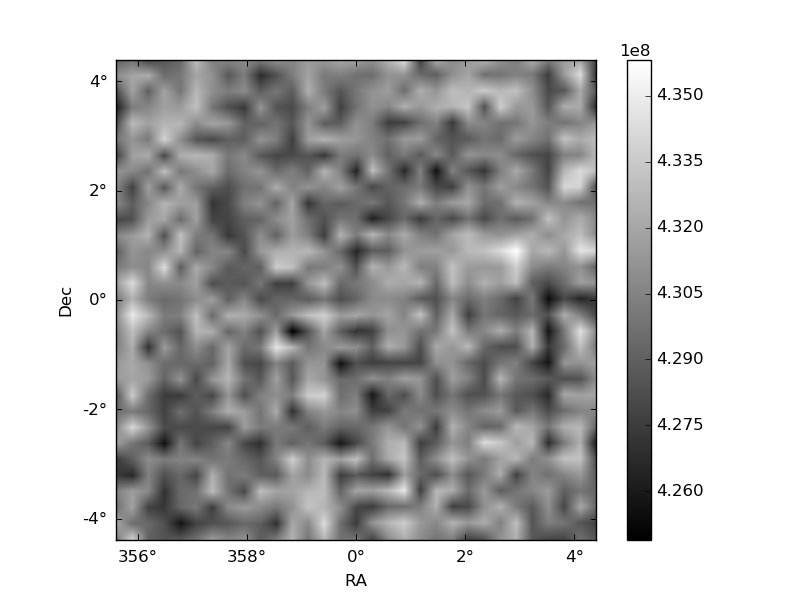
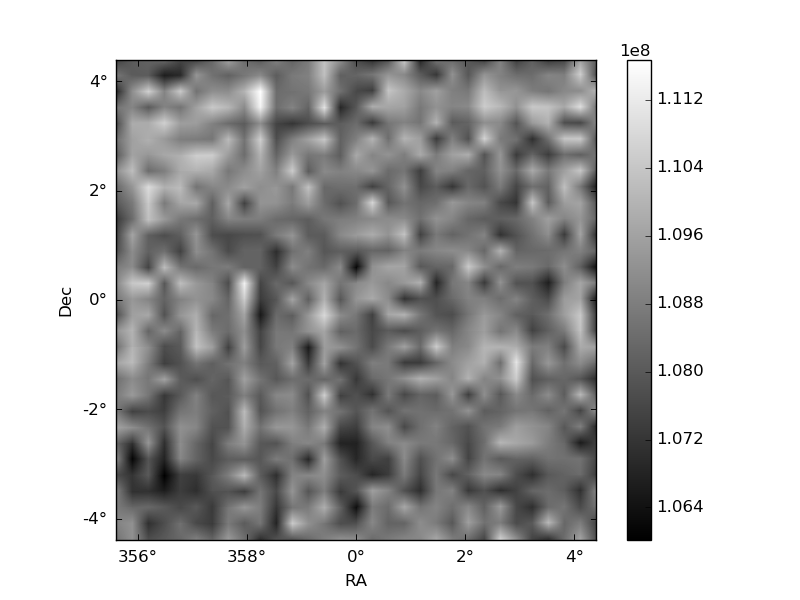
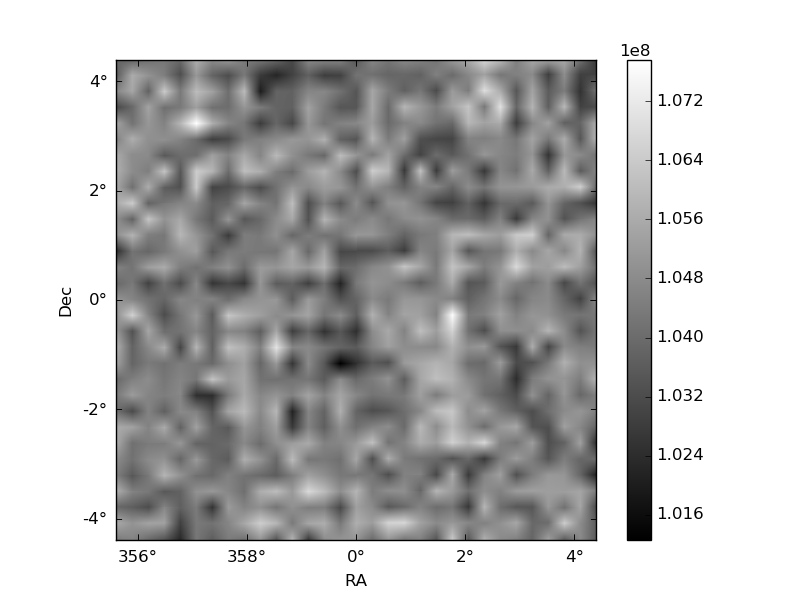
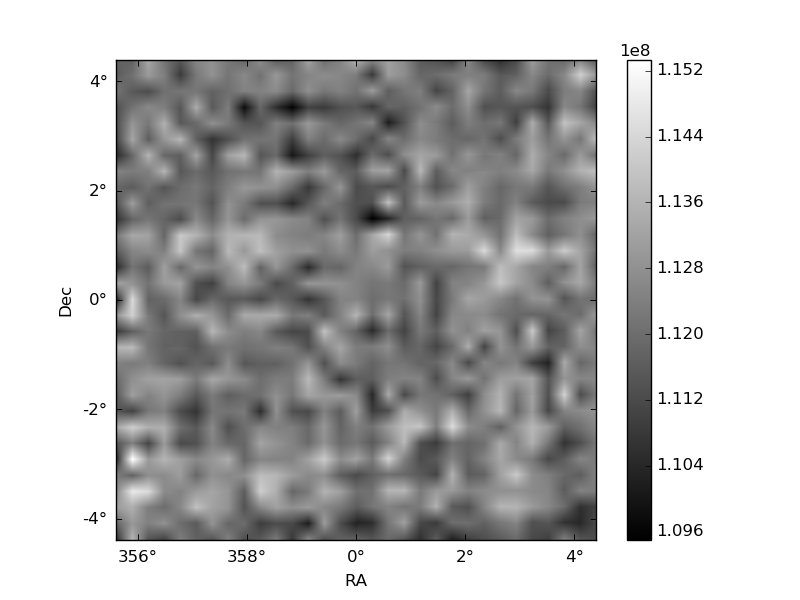
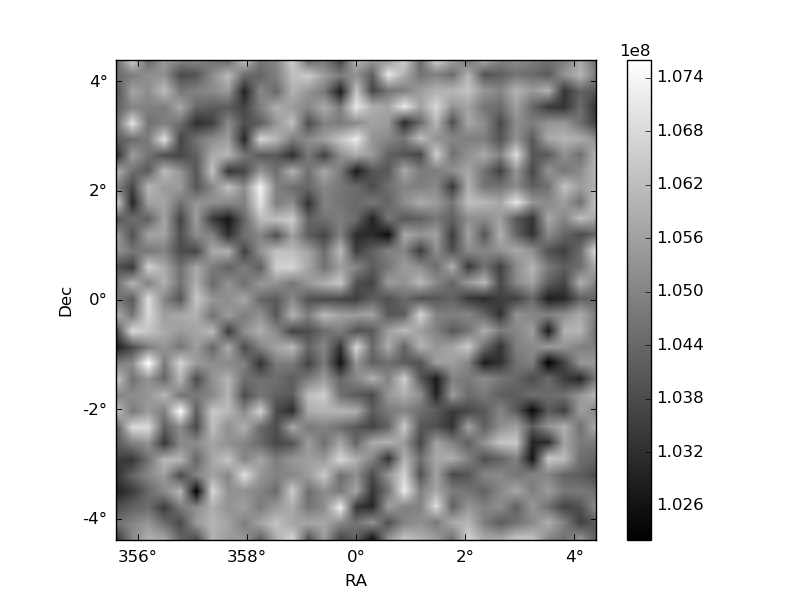
Histogram calculated using DETX and DETY for each event in the final _common_clean file
| Quadrant A | 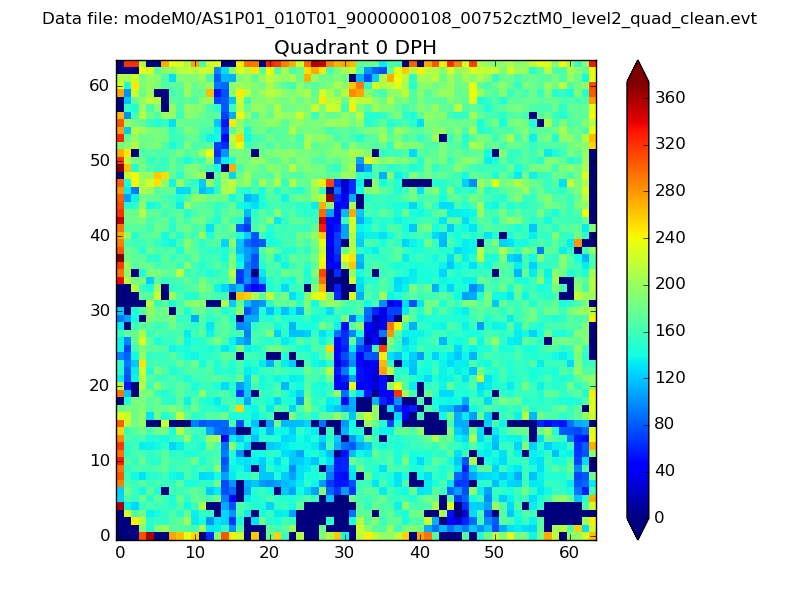 |
 |
Quadrant B |
|---|---|---|---|
| Quadrant D | 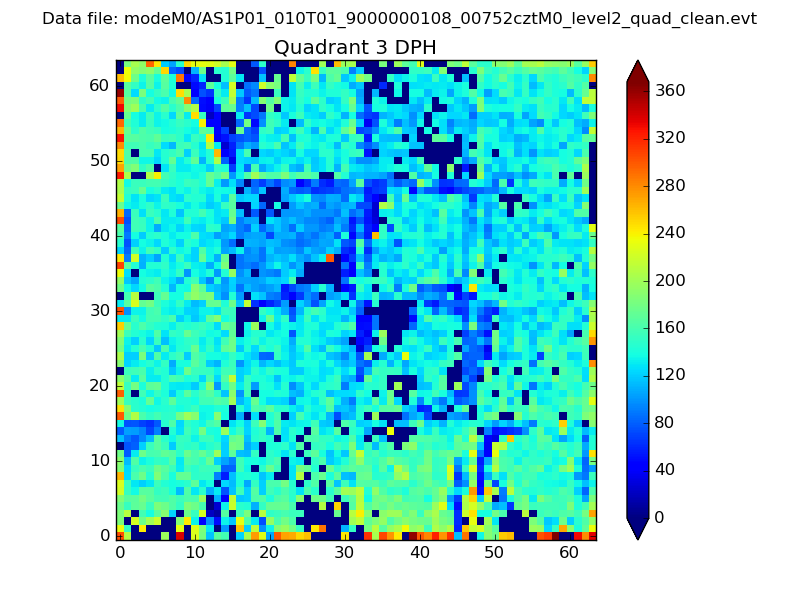 |
 |
Quadrant C |
| Plot type | Count rate plots | Images |
|---|---|---|
| Comparison with Poisson distribution Blue bars denote a histogram of data divided into 1 sec bins. Red curve is a Poisson curve with rate = median count rate of data. |
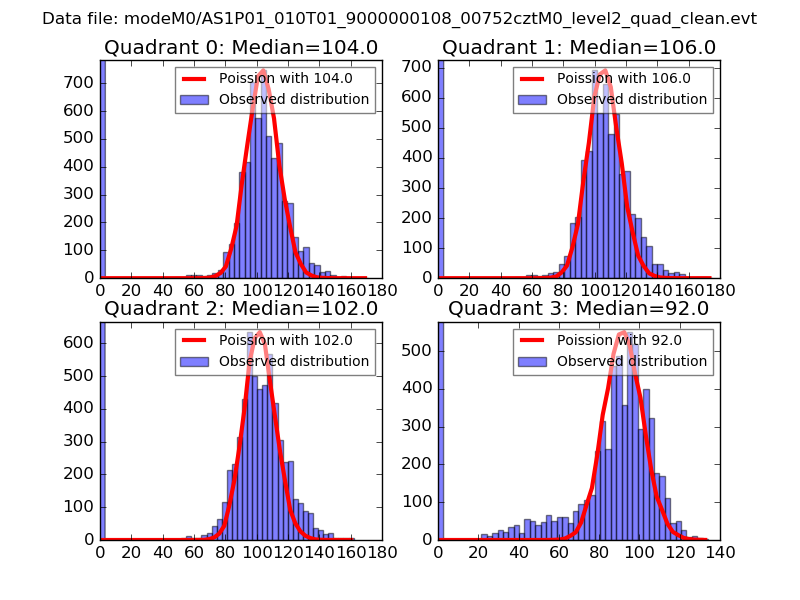 |
 |
| Quadrant-wise count rates Data is divided into 100 sec bins |
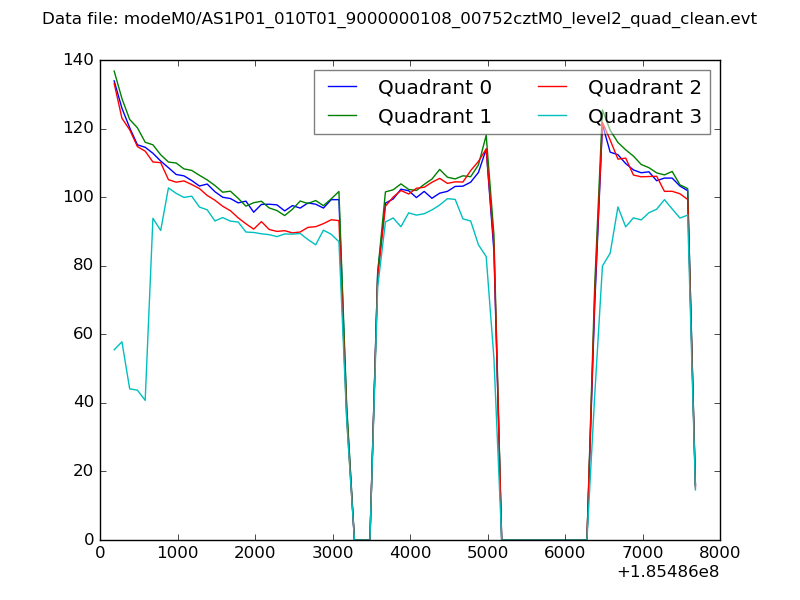 |
|
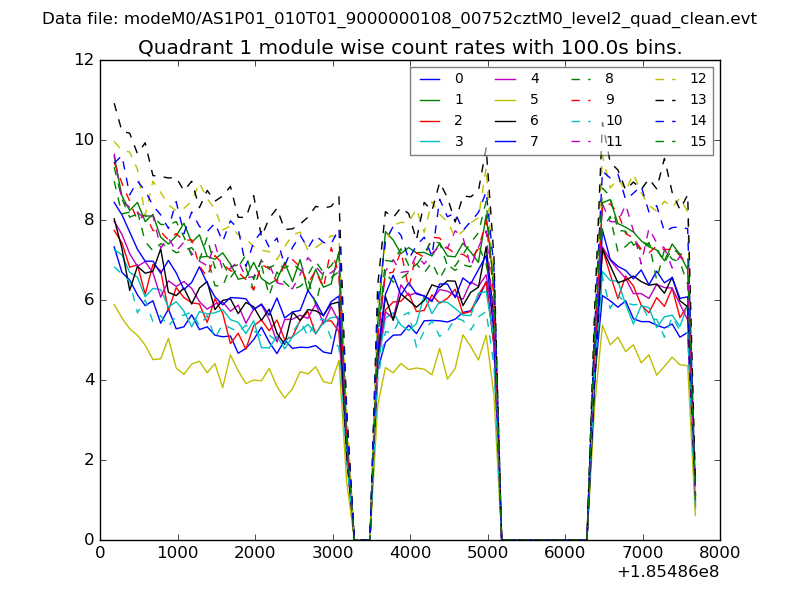
| Module-wise count rates for Quadrant A Data is divided into 100 sec bins |
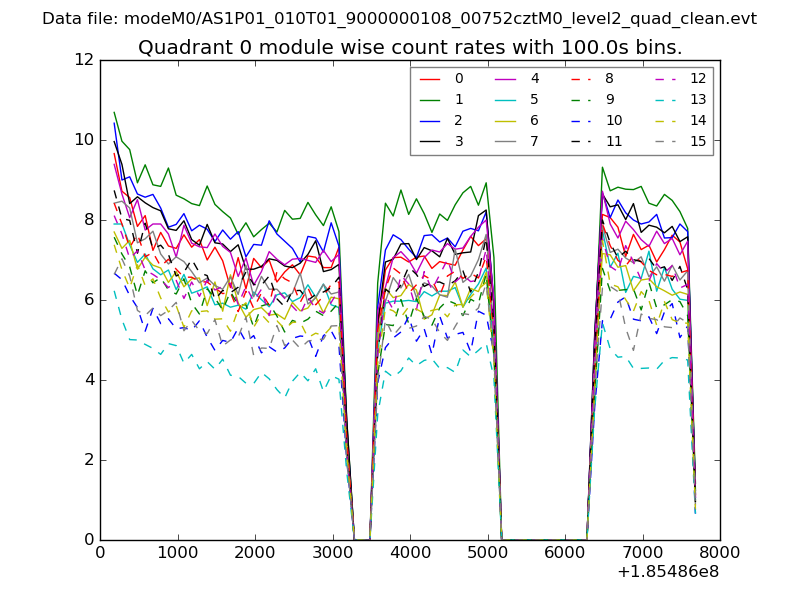 |
 |
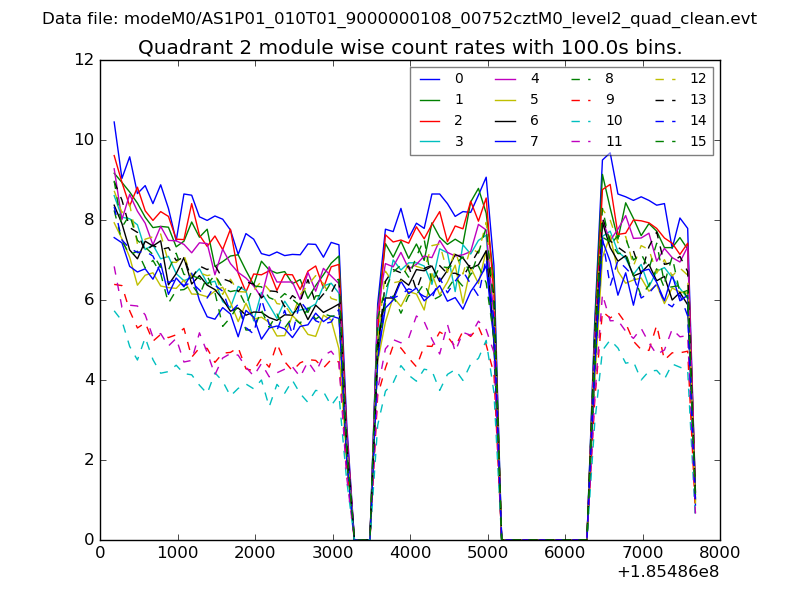
| Module-wise count rates for Quadrant B Data is divided into 100 sec bins |
 |
 |
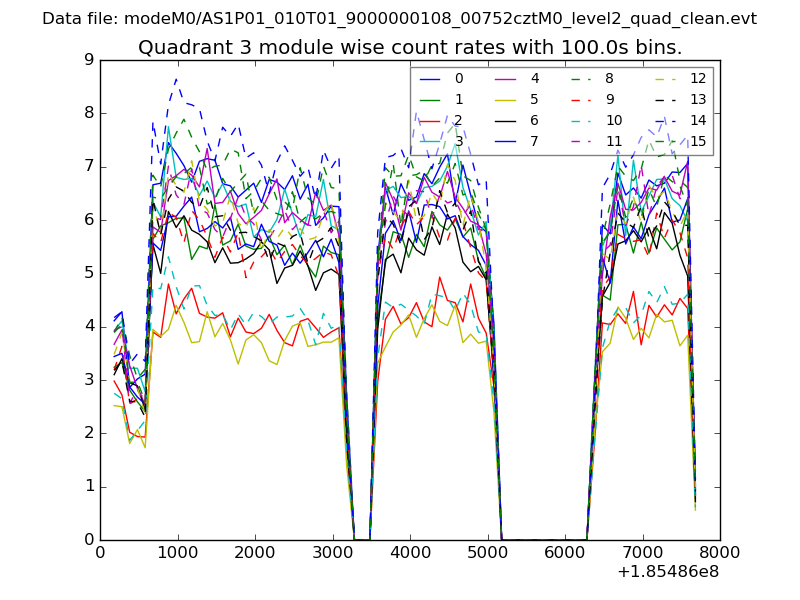
| Module-wise count rates for Quadrant C Data is divided into 100 sec bins |
 |
 |
| Module-wise count rates for Quadrant D Data is divided into 100 sec bins |
 |
 |
| Parameter | Plot |
|---|---|
| CZT HV Monitor | 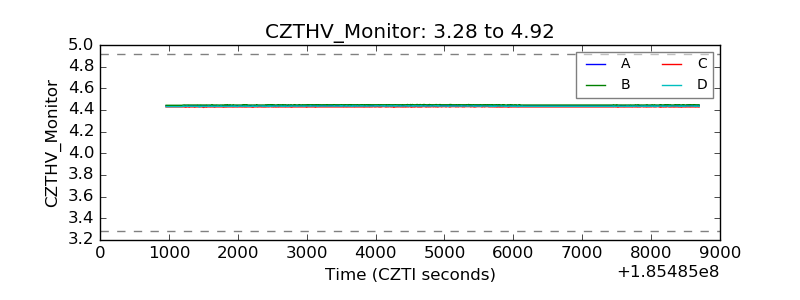 |
| D_VDD | 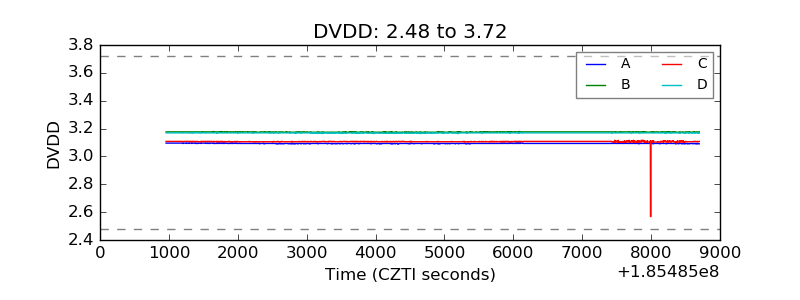 |
| Temperature 1 | 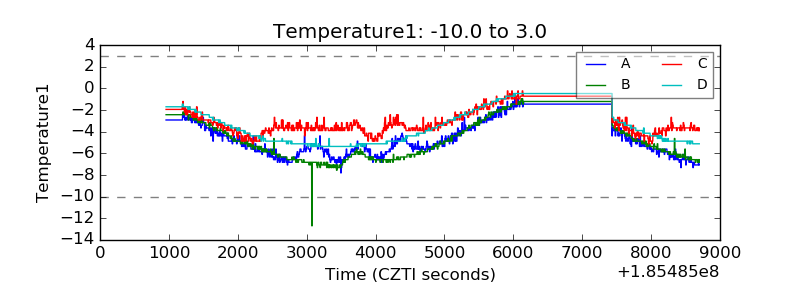 |
| Veto HV Monitor | 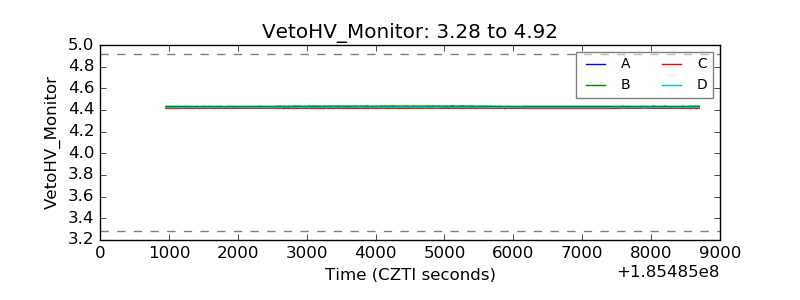 |
| Veto LLD | 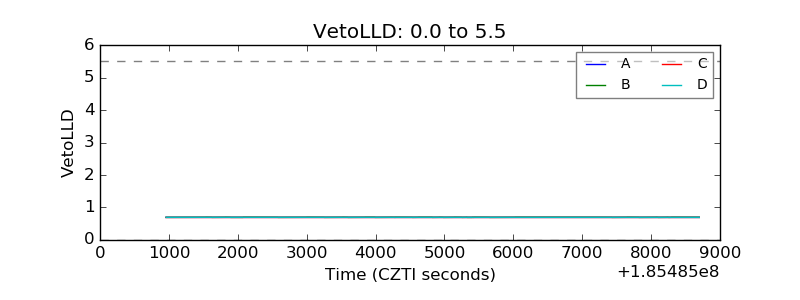 |
| Alpha Counter | 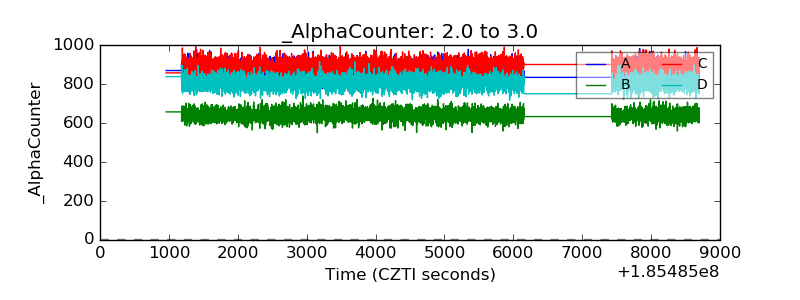 |
| _CPM_Rate | 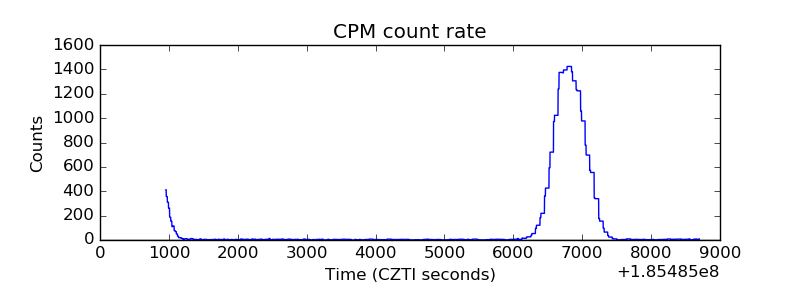 |
| CZT Counter | 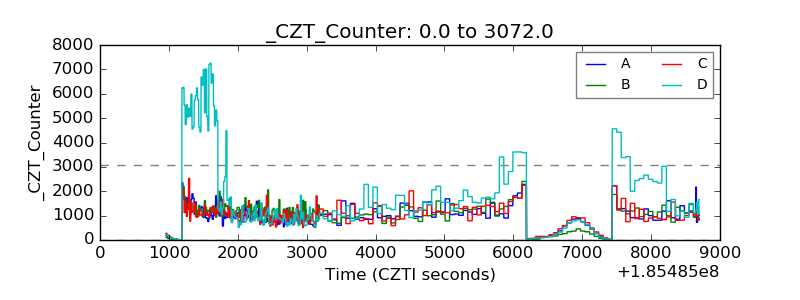 |
| +2.5 Volts monitor | 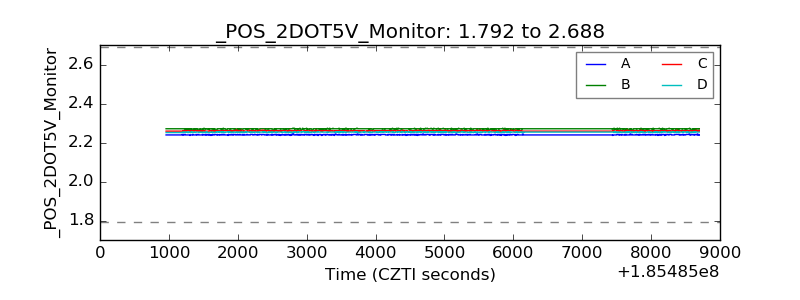 |
| +5 Volts monitor |  |
| _ROLL_ROT | 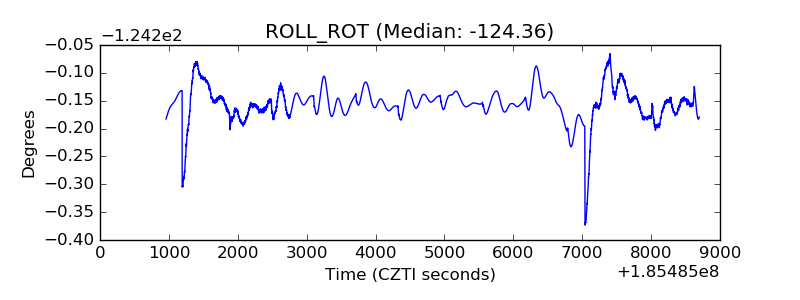 |
| _Roll_DEC | 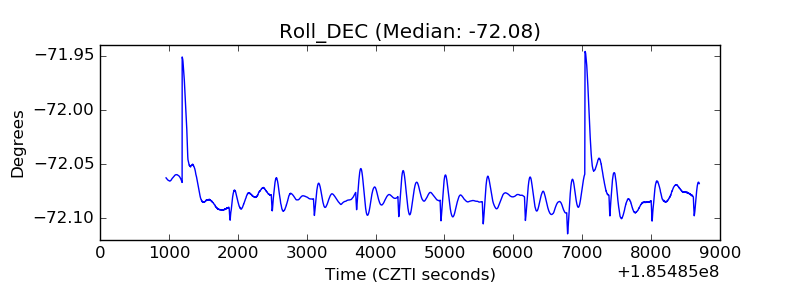 |
| _Roll_RA | 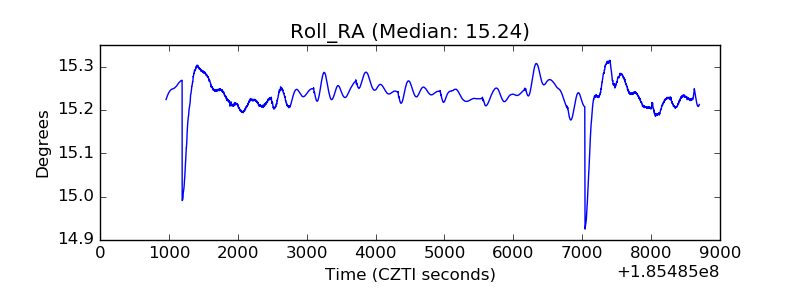 |
| Veto Counter | 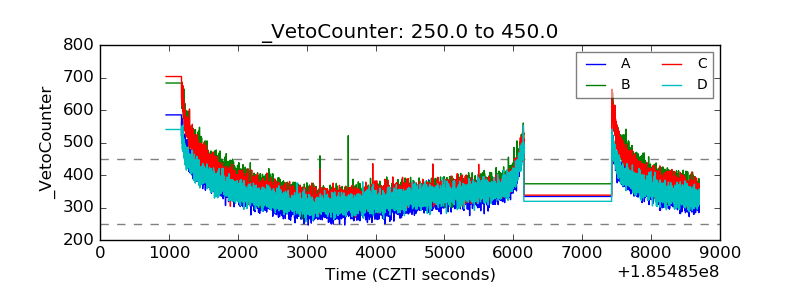 |