| Param | Original file | Final file |
|---|---|---|
| Filename | modeM0/AS1P01_010T01_9000000108_00754cztM0_level2.evt | modeM0/AS1P01_010T01_9000000108_00754cztM0_level2_quad_clean.evt |
| Size (bytes) | 1,073,378,880 | 97,701,120 |
| Size | 1023.7 MB | 93.2 MB |
| Events in quadrant A | 7,618,510 | 633,378 |
| Events in quadrant B | 8,283,410 | 640,934 |
| Events in quadrant C | 7,723,417 | 620,504 |
| Events in quadrant D | 8,436,039 | 595,199 |
| Mode SS | |||
|---|---|---|---|
| Quadrant | BADHDUFLAG | Total packets | Discarded packets |
| A | 0 | 136 | 0 |
| B | 0 | 136 | 0 |
| C | 0 | 136 | 0 |
| D | 0 | 136 | 0 |
| Mode M0 | |||
|---|---|---|---|
| Quadrant | BADHDUFLAG | Total packets | Discarded packets |
| A | 0 | 27409 | 0 |
| B | 0 | 29403 | 0 |
| C | 0 | 27707 | 0 |
| D | 0 | 29796 | 0 |
| Mode M9 | |||
|---|---|---|---|
| Quadrant | BADHDUFLAG | Total packets | Discarded packets |
| A | 0 | 14 | 0 |
| B | 0 | 14 | 0 |
| C | 0 | 14 | 0 |
| D | 0 | 14 | 0 |
| Quadrant | Total seconds | Saturated seconds | Saturation percentage |
|---|---|---|---|
| A | 6729 | 8 | 0.118888% |
| B | 6729 | 6 | 0.089166% |
| C | 6729 | 4 | 0.059444% |
| D | 6729 | 55 | 0.817358% |
Noise dominated data is calculated using 1-second bins in cleaned event files. If a bin has >2000 counts, and if more than 50% of those come from <1% of pixels, then it is considered to be noise-dominated and hence unusable.
| Quadrant | # 1 sec bins | Bins with >0 counts | Bins with >2000 counts | High rate bins dominated by noise | Noise dominated (total time) | Noise dominated (detector-on time) | Marked lightcurve |
|---|---|---|---|---|---|---|---|
| A | 7834 | 6730 | 114 | 114 | 1.46% | 1.69% | 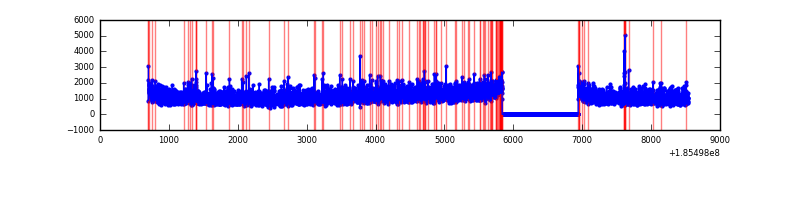 |
| B | 7834 | 6730 | 189 | 189 | 2.41% | 2.81% | 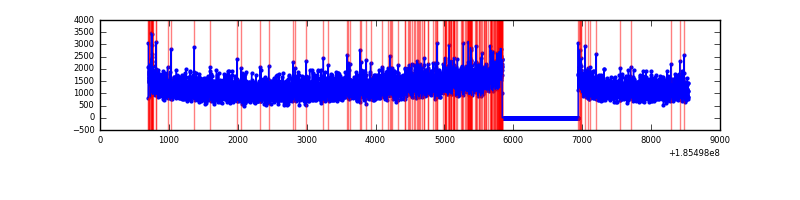 |
| C | 7834 | 6730 | 97 | 97 | 1.24% | 1.44% | 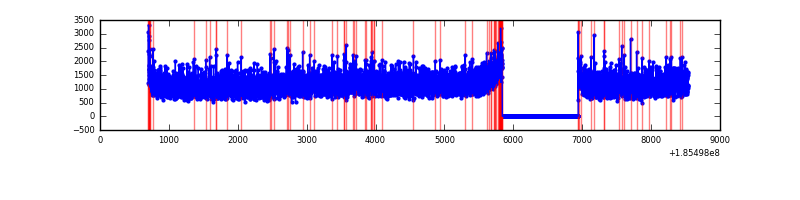 |
| D | 7834 | 6730 | 541 | 541 | 6.91% | 8.04% | 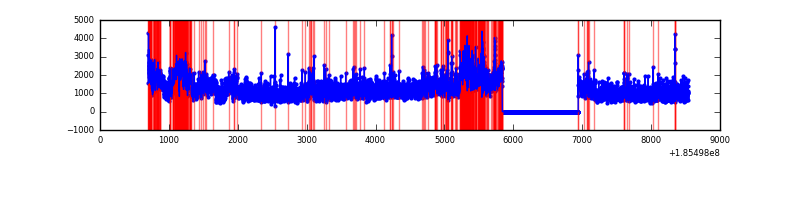 |
Top three noisy pixels from each quadrant. If the there are fewer than three noisy pixels in the level2.evt file, extra rows are filled as -1
| Pixel properties | Quadrant properties | ||||||
|---|---|---|---|---|---|---|---|
| Quadrant | DetID | PixID | Counts | Sigma | Mean | Median | Sigma |
| A | 15 | 233 | 29270 | 57.85 | 1971 | 1985 | 471.6 |
| A | 15 | 17 | 18979 | 36.03 | 1971 | 1985 | 471.6 |
| A | 13 | 17 | 8458 | 13.72 | 1971 | 1985 | 471.6 |
| B | 7 | 221 | 186932 | 380.04 | 2098 | 2106 | 486.3 |
| B | 0 | 220 | 68025 | 135.54 | 2098 | 2106 | 486.3 |
| B | 15 | 85 | 22703 | 42.35 | 2098 | 2106 | 486.3 |
| C | 5 | 234 | 119971 | 222.98 | 1912 | 1979 | 529.2 |
| C | 15 | 241 | 60448 | 110.49 | 1912 | 1979 | 529.2 |
| C | 3 | 111 | 27916 | 49.02 | 1912 | 1979 | 529.2 |
| D | 13 | 25 | 1115192 | 1974.44 | 1831 | 1892 | 563.9 |
| D | 12 | 188 | 103900 | 180.91 | 1831 | 1892 | 563.9 |
| D | 6 | 226 | 103236 | 179.73 | 1831 | 1892 | 563.9 |
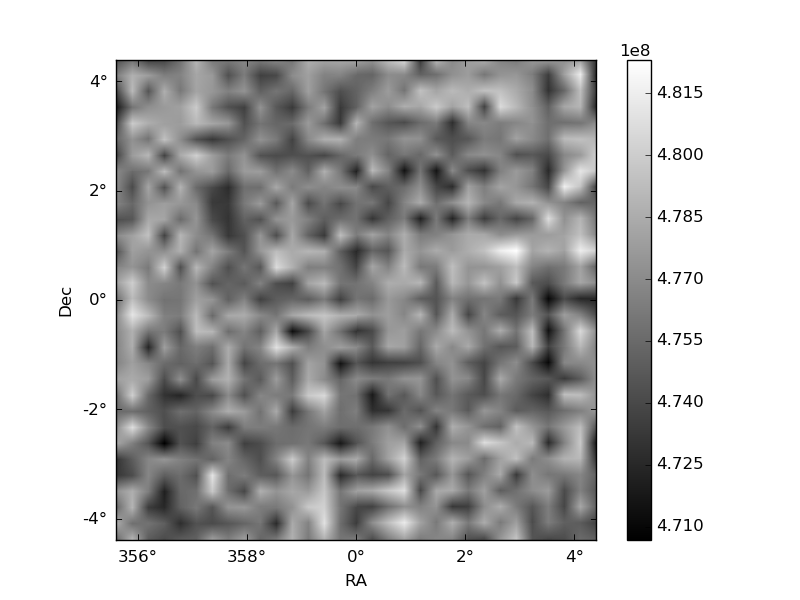
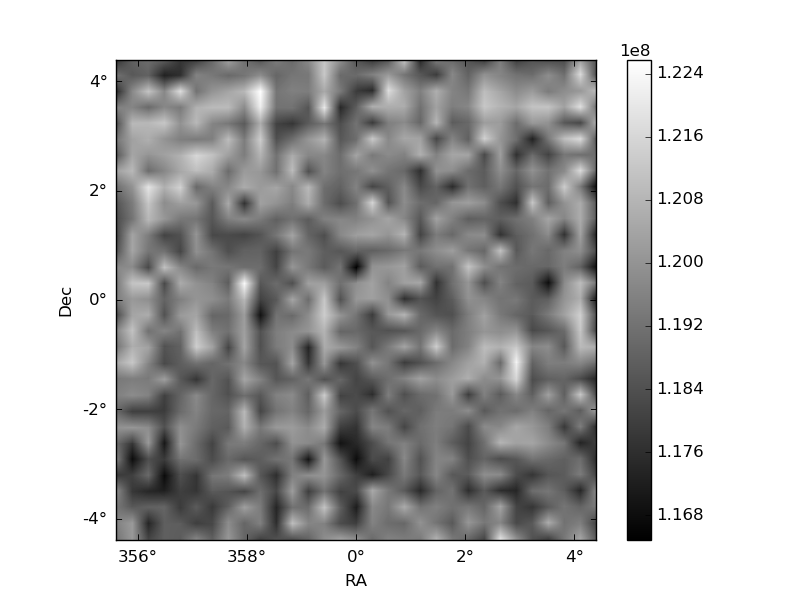
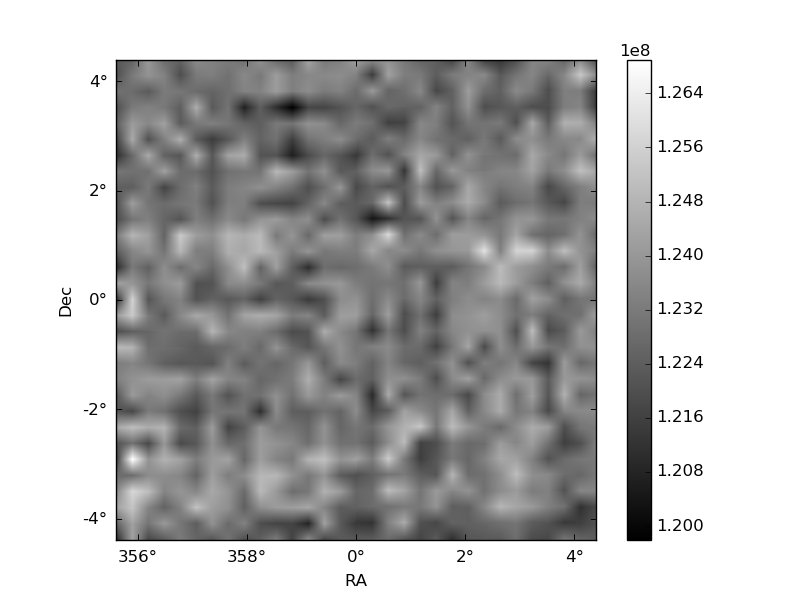
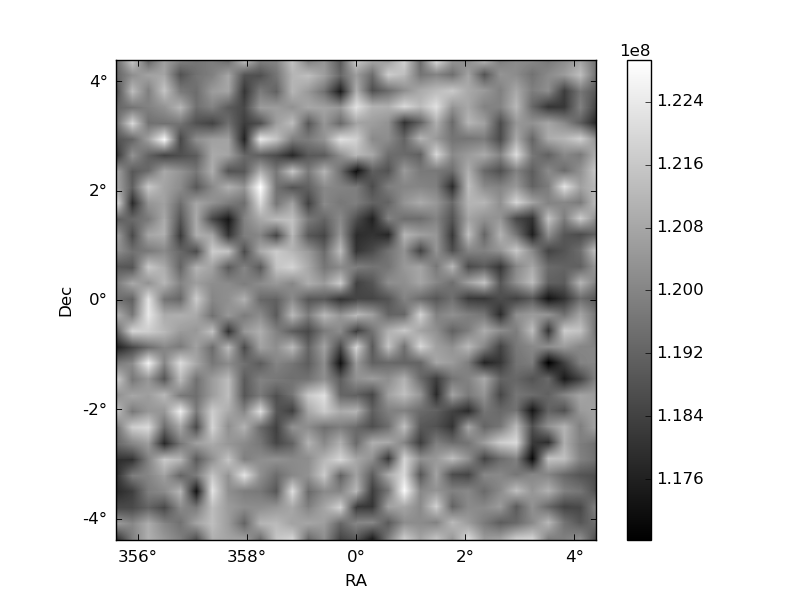
Histogram calculated using DETX and DETY for each event in the final _common_clean file
| Quadrant A | 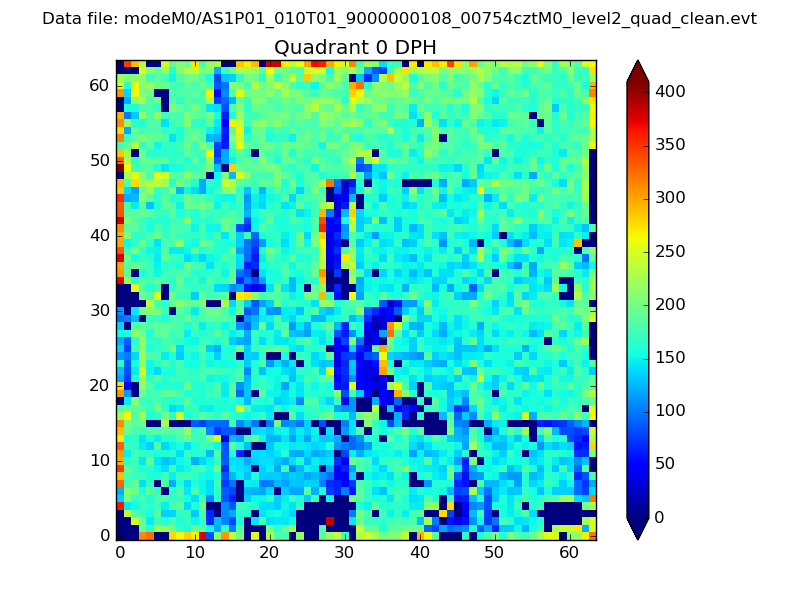 |
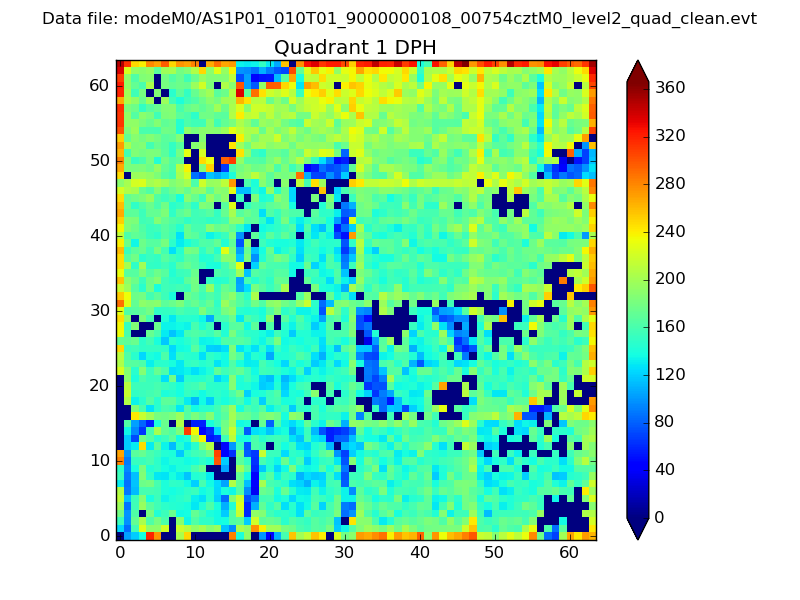 |
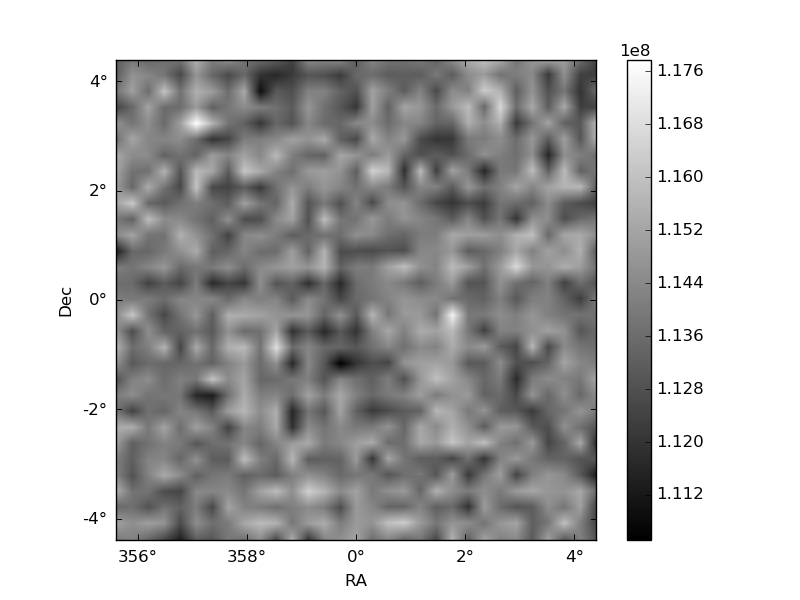
Quadrant B |
|---|---|---|---|
| Quadrant D | 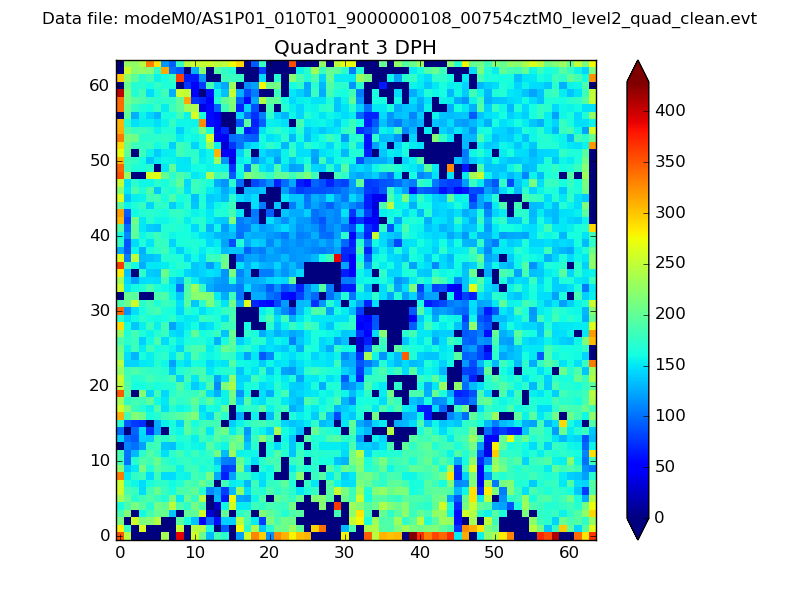 |
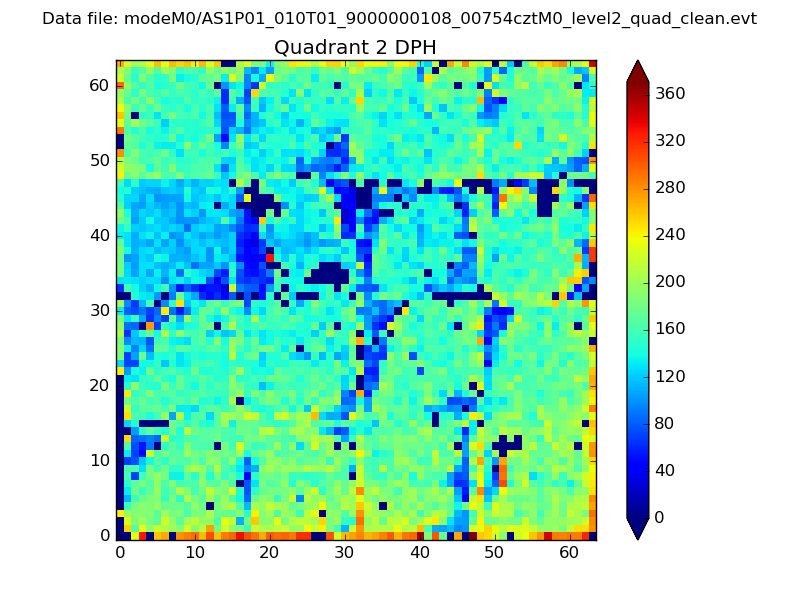 |
Quadrant C |
| Plot type | Count rate plots | Images |
|---|---|---|
| Comparison with Poisson distribution Blue bars denote a histogram of data divided into 1 sec bins. Red curve is a Poisson curve with rate = median count rate of data. |
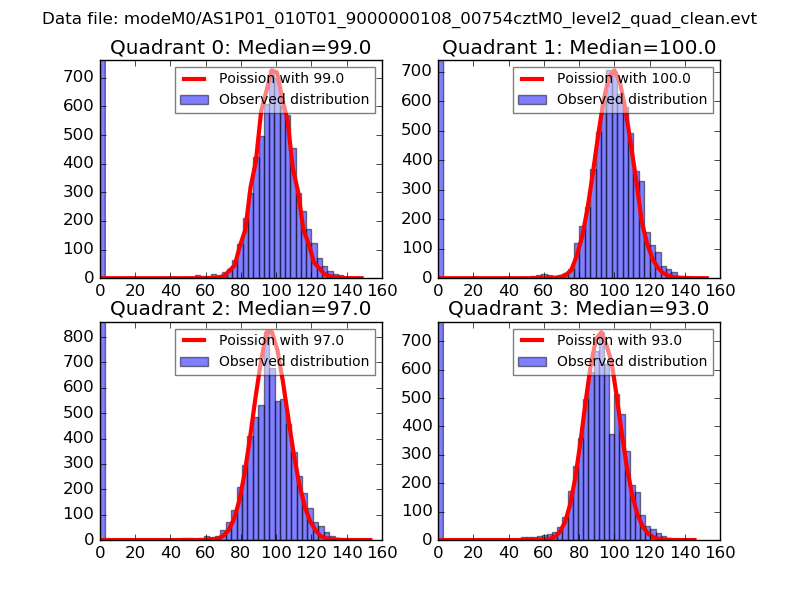 |
 |
| Quadrant-wise count rates Data is divided into 100 sec bins |
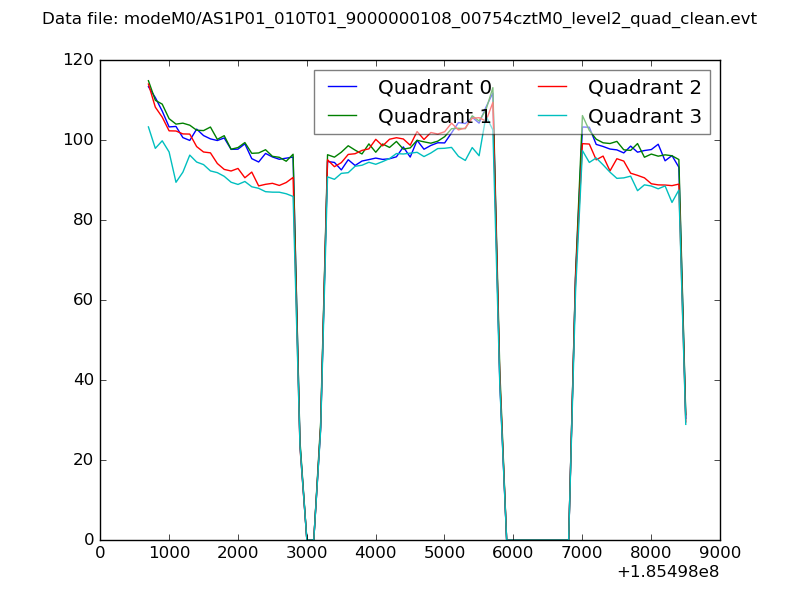 |
|
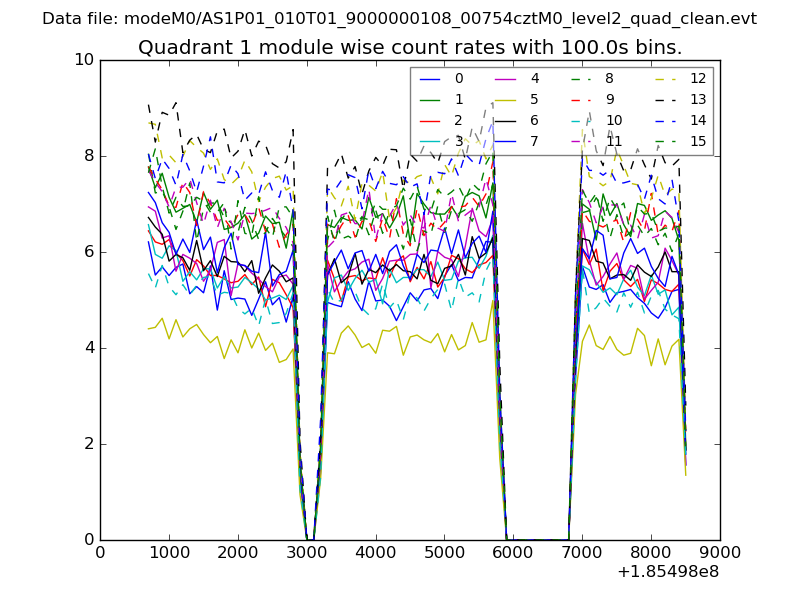
| Module-wise count rates for Quadrant A Data is divided into 100 sec bins |
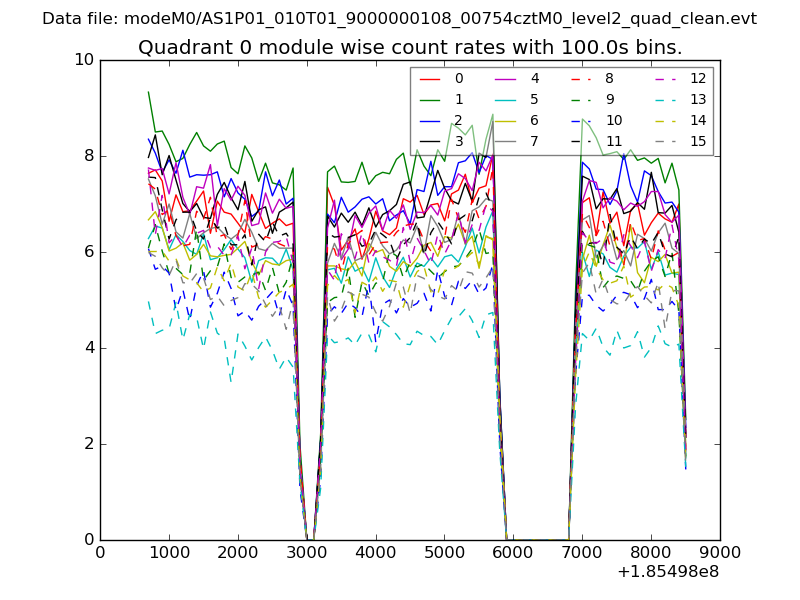 |
 |
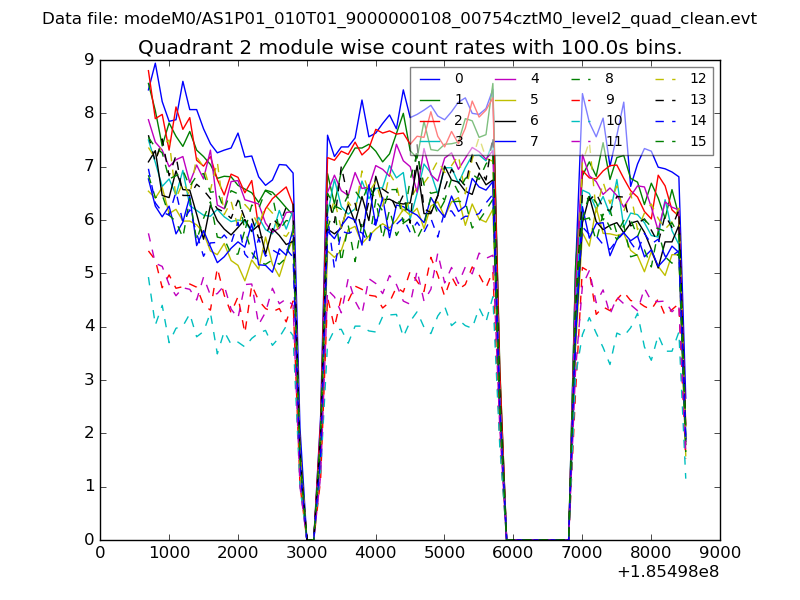
| Module-wise count rates for Quadrant B Data is divided into 100 sec bins |
 |
 |
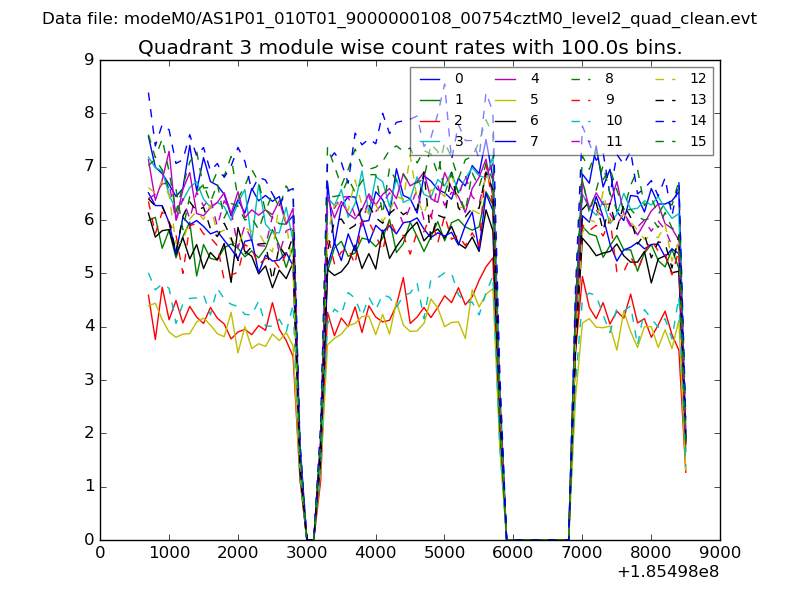
| Module-wise count rates for Quadrant C Data is divided into 100 sec bins |
 |
 |
| Module-wise count rates for Quadrant D Data is divided into 100 sec bins |
 |
 |
| Parameter | Plot |
|---|---|
| CZT HV Monitor | 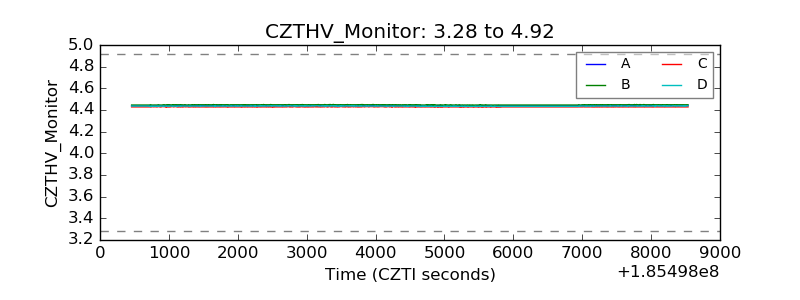 |
| D_VDD | 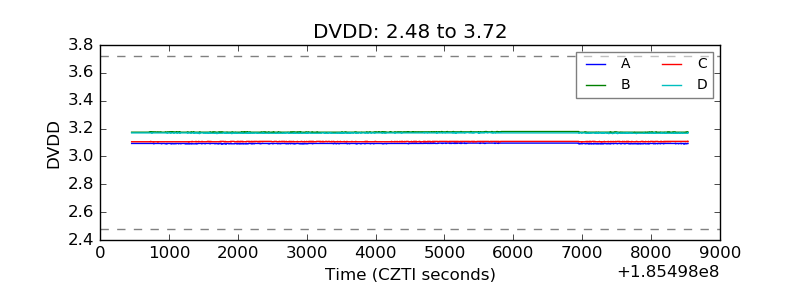 |
| Temperature 1 | 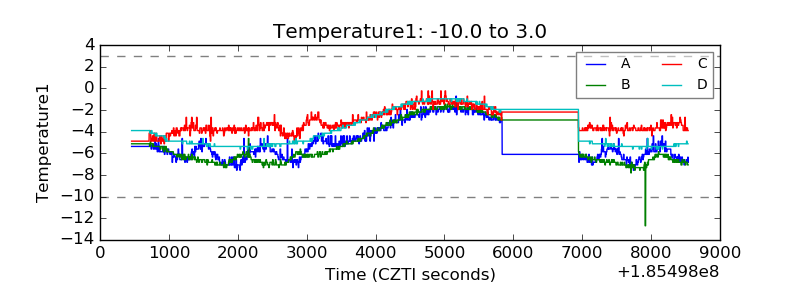 |
| Veto HV Monitor | 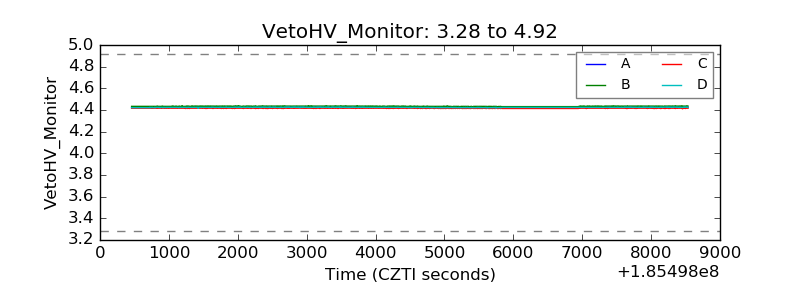 |
| Veto LLD | 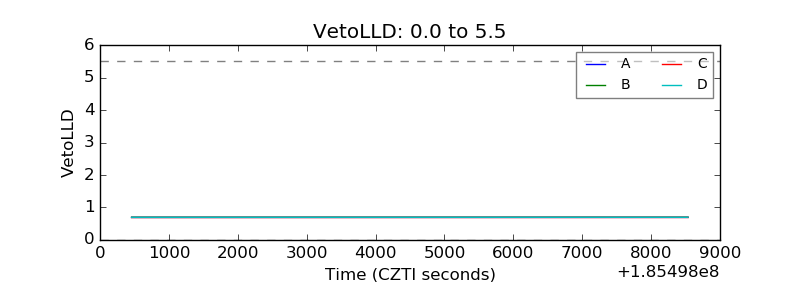 |
| Alpha Counter | 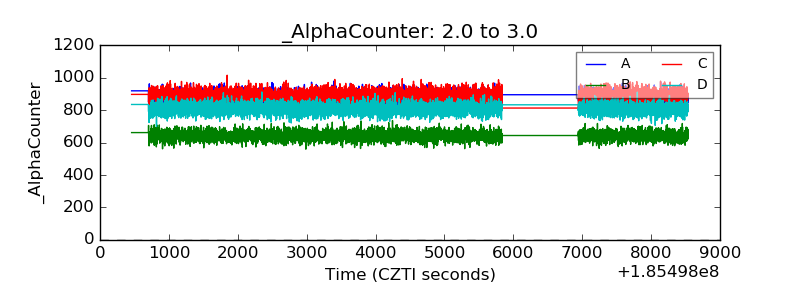 |
| _CPM_Rate | 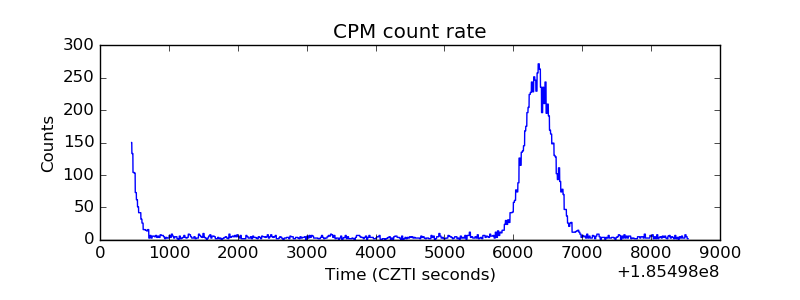 |
| CZT Counter | 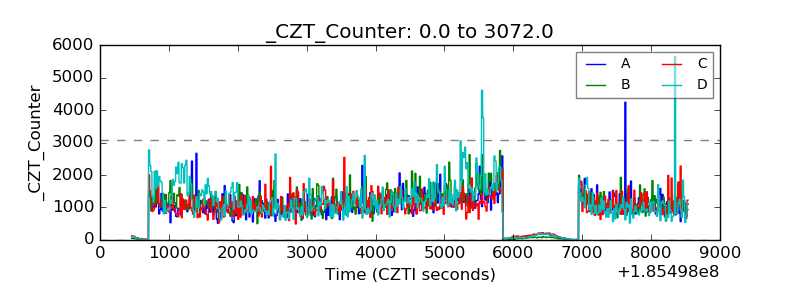 |
| +2.5 Volts monitor | 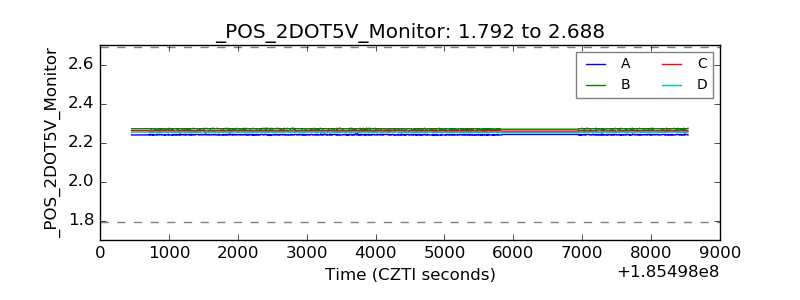 |
| +5 Volts monitor |  |
| _ROLL_ROT | 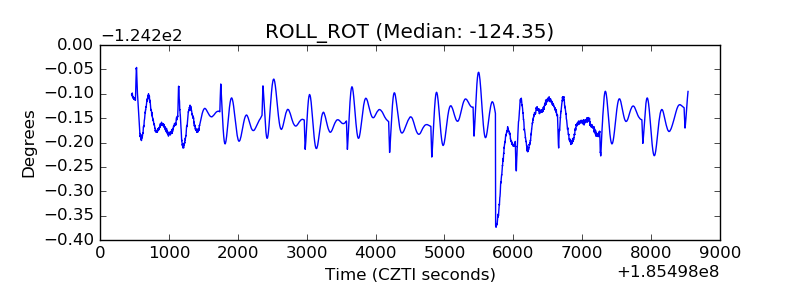 |
| _Roll_DEC | 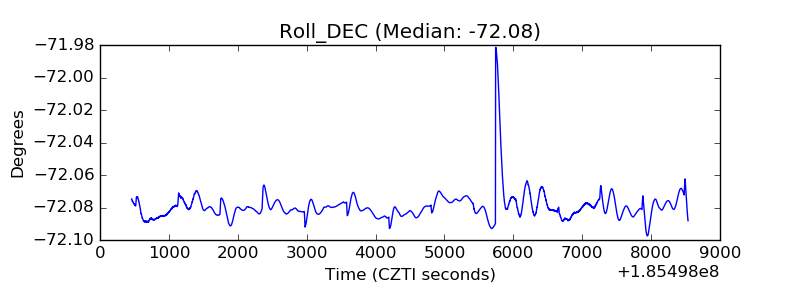 |
| _Roll_RA | 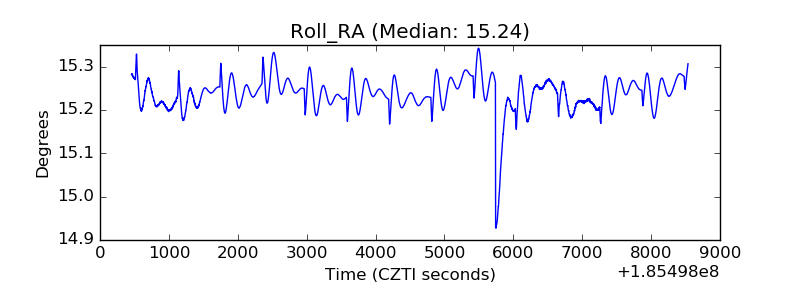 |
| Veto Counter | 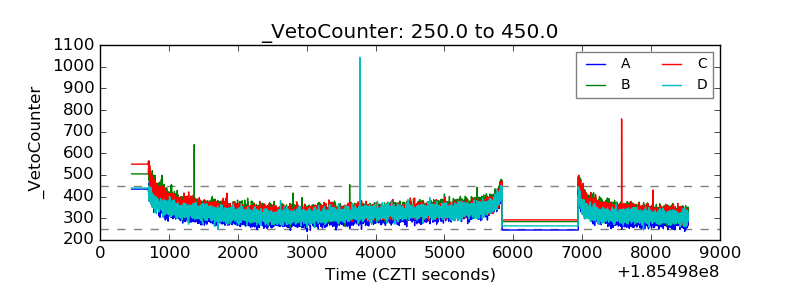 |