| Param | Original file | Final file |
|---|---|---|
| Filename | modeM0/AS1P01_010T01_9000000108_00757cztM0_level2.evt | modeM0/AS1P01_010T01_9000000108_00757cztM0_level2_quad_clean.evt |
| Size (bytes) | 1,206,976,320 | 98,625,600 |
| Size | 1.1 GB | 94.1 MB |
| Events in quadrant A | 8,759,850 | 630,459 |
| Events in quadrant B | 9,463,248 | 635,390 |
| Events in quadrant C | 8,540,539 | 623,612 |
| Events in quadrant D | 9,318,249 | 600,780 |
| Mode SS | |||
|---|---|---|---|
| Quadrant | BADHDUFLAG | Total packets | Discarded packets |
| A | 0 | 144 | 0 |
| B | 0 | 144 | 0 |
| C | 0 | 144 | 0 |
| D | 0 | 144 | 0 |
| Mode M0 | |||
|---|---|---|---|
| Quadrant | BADHDUFLAG | Total packets | Discarded packets |
| A | 0 | 31078 | 0 |
| B | 0 | 33148 | 0 |
| C | 0 | 30390 | 0 |
| D | 0 | 32761 | 0 |
| Quadrant | Total seconds | Saturated seconds | Saturation percentage |
|---|---|---|---|
| A | 7125 | 15 | 0.210526% |
| B | 7125 | 39 | 0.547368% |
| C | 7126 | 18 | 0.252596% |
| D | 7126 | 50 | 0.701656% |
Noise dominated data is calculated using 1-second bins in cleaned event files. If a bin has >2000 counts, and if more than 50% of those come from <1% of pixels, then it is considered to be noise-dominated and hence unusable.
| Quadrant | # 1 sec bins | Bins with >0 counts | Bins with >2000 counts | High rate bins dominated by noise | Noise dominated (total time) | Noise dominated (detector-on time) | Marked lightcurve |
|---|---|---|---|---|---|---|---|
| A | 7125 | 7125 | 399 | 399 | 5.60% | 5.60% | 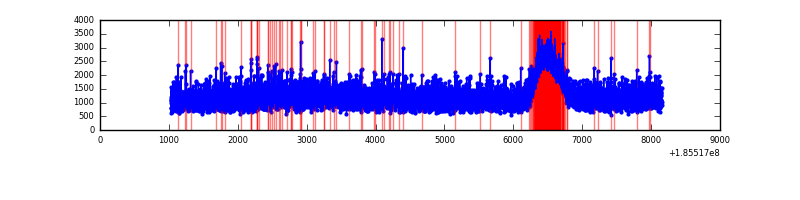 |
| B | 7125 | 7125 | 523 | 523 | 7.34% | 7.34% | 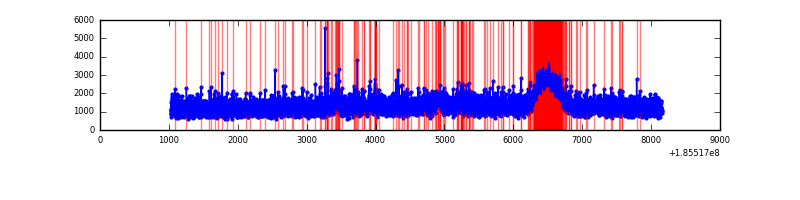 |
| C | 7126 | 7126 | 389 | 389 | 5.46% | 5.46% | 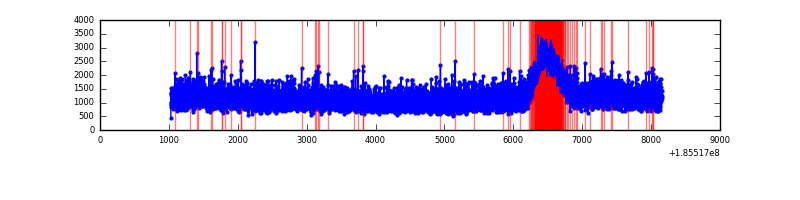 |
| D | 7126 | 7126 | 661 | 661 | 9.28% | 9.28% | 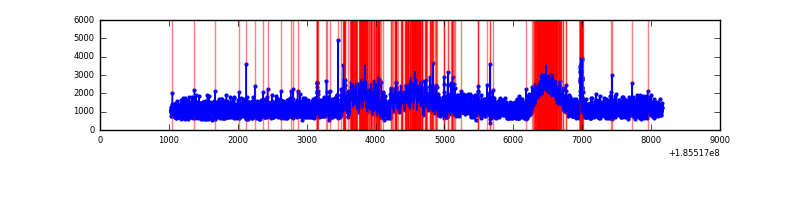 |
Top three noisy pixels from each quadrant. If the there are fewer than three noisy pixels in the level2.evt file, extra rows are filled as -1
| Pixel properties | Quadrant properties | ||||||
|---|---|---|---|---|---|---|---|
| Quadrant | DetID | PixID | Counts | Sigma | Mean | Median | Sigma |
| A | 0 | 117 | 106594 | 190.88 | 2249 | 2267 | 546.6 |
| A | 15 | 17 | 15559 | 24.32 | 2249 | 2267 | 546.6 |
| A | 11 | 79 | 8990 | 12.3 | 2249 | 2267 | 546.6 |
| B | 8 | 4 | 240320 | 432.49 | 2336 | 2341 | 550.3 |
| B | 8 | 38 | 225343 | 405.27 | 2336 | 2341 | 550.3 |
| B | 7 | 221 | 106096 | 188.56 | 2336 | 2341 | 550.3 |
| C | 15 | 241 | 65185 | 103.63 | 2148 | 2224 | 607.5 |
| C | 3 | 111 | 42015 | 65.5 | 2148 | 2224 | 607.5 |
| C | 3 | 79 | 36017 | 55.62 | 2148 | 2224 | 607.5 |
| D | 13 | 25 | 1137602 | 1755.33 | 2077 | 2148 | 646.9 |
| D | 6 | 226 | 117700 | 178.63 | 2077 | 2148 | 646.9 |
| D | 1 | 4 | 103144 | 156.13 | 2077 | 2148 | 646.9 |
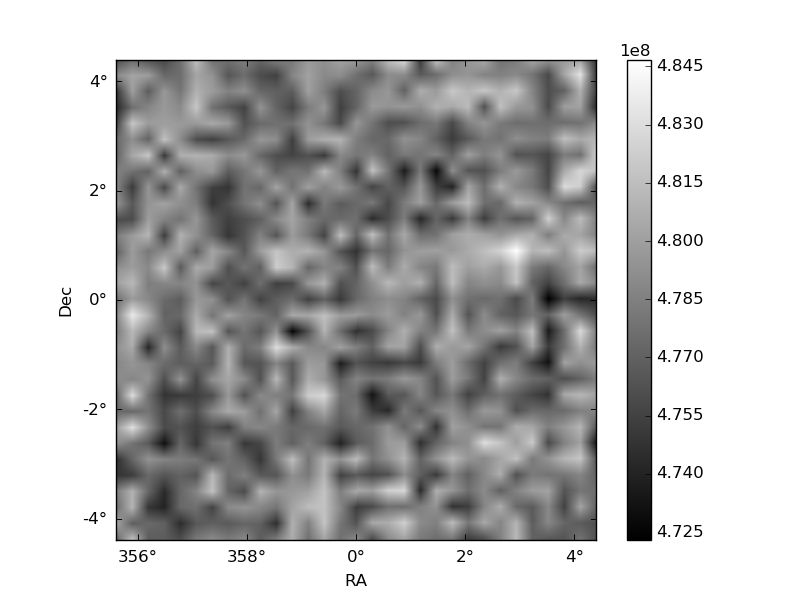
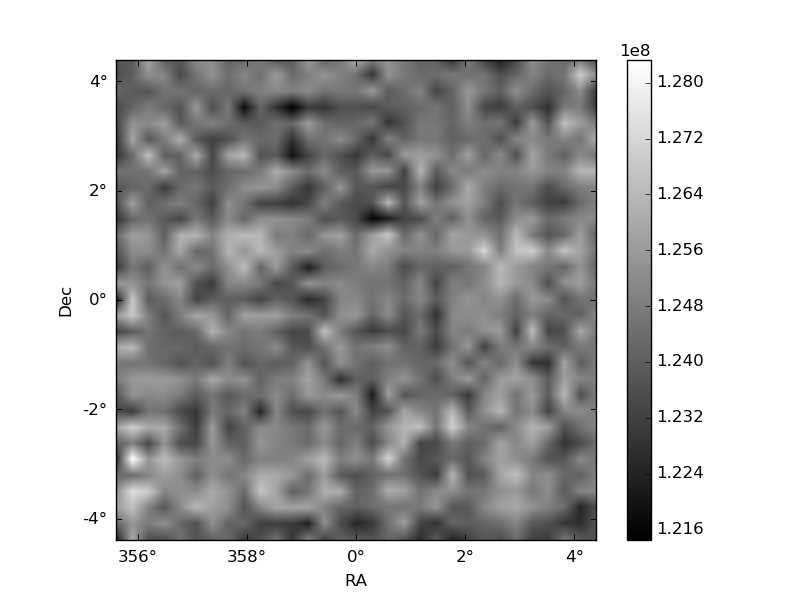
Histogram calculated using DETX and DETY for each event in the final _common_clean file
| Quadrant A | 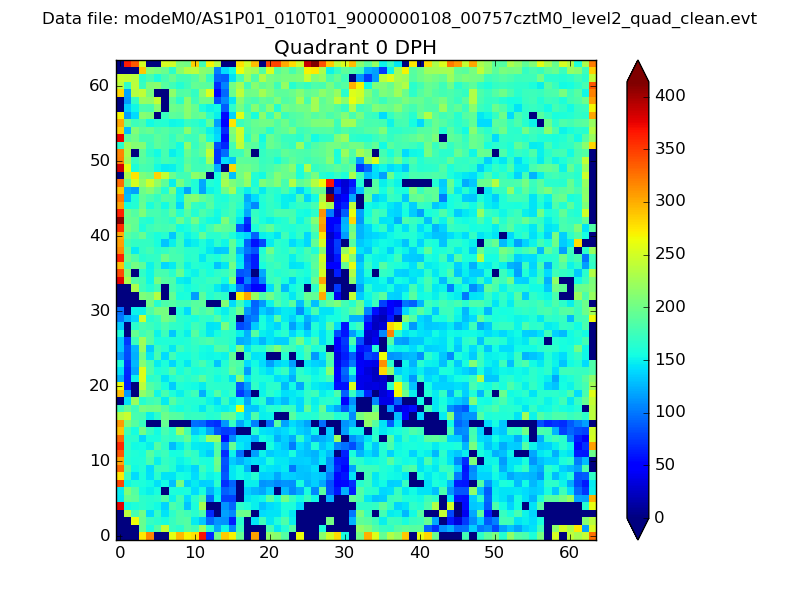 |
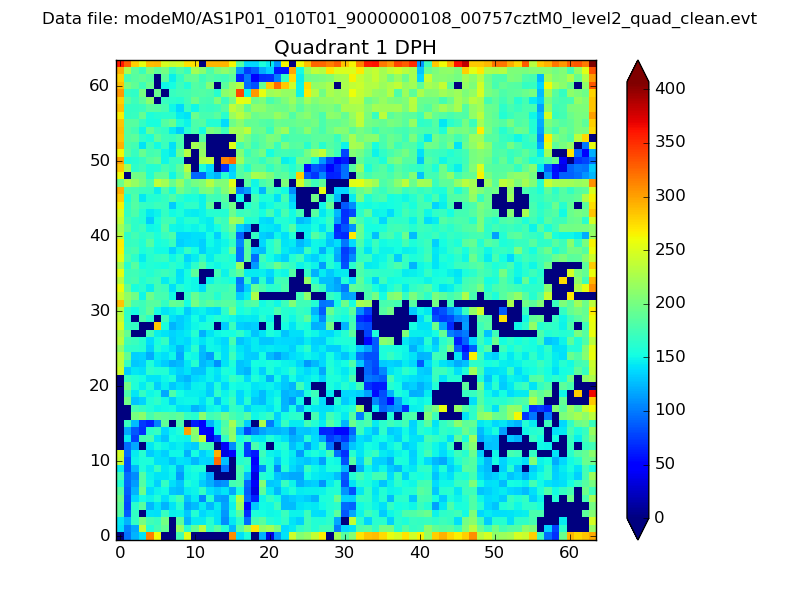 |
Quadrant B |
|---|---|---|---|
| Quadrant D | 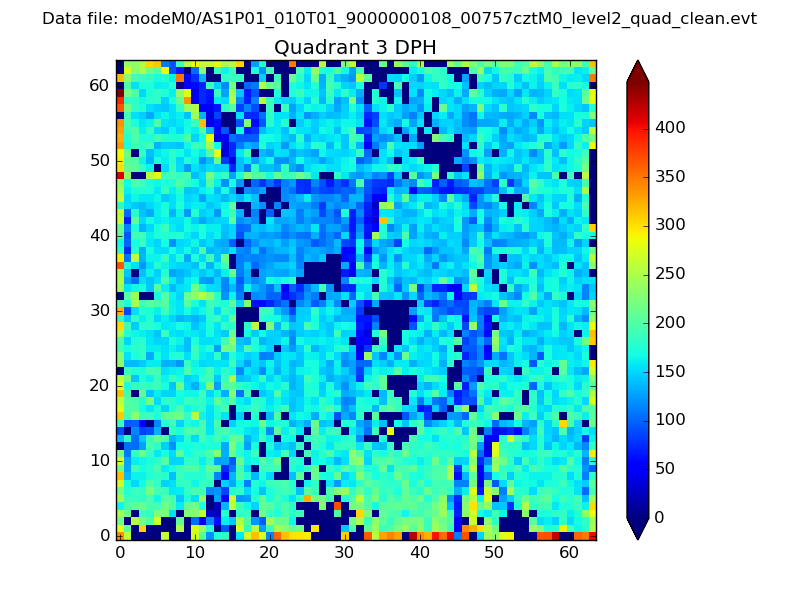 |
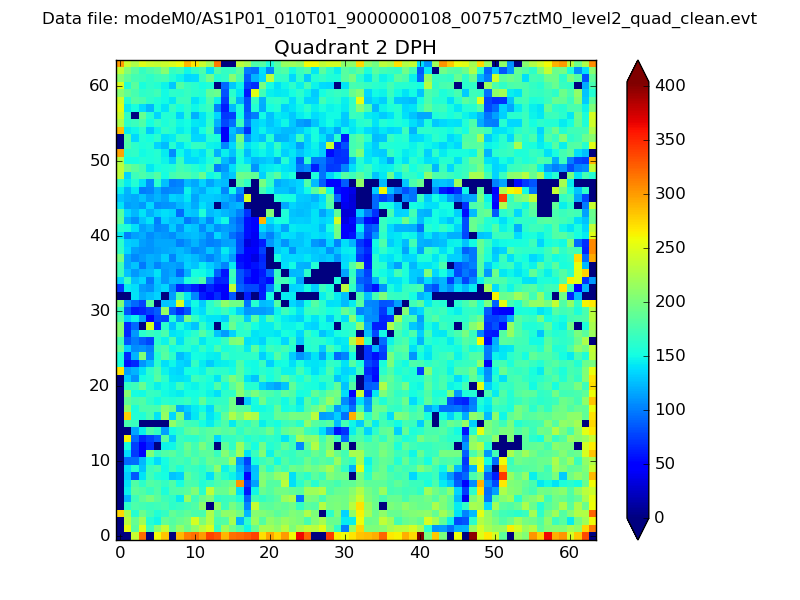 |
Quadrant C |
| Plot type | Count rate plots | Images |
|---|---|---|
| Comparison with Poisson distribution Blue bars denote a histogram of data divided into 1 sec bins. Red curve is a Poisson curve with rate = median count rate of data. |
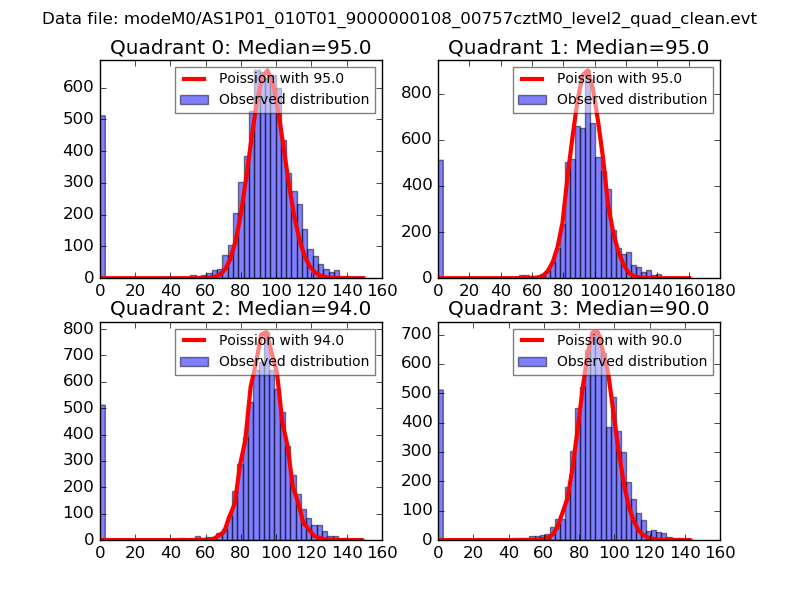 |
 |
| Quadrant-wise count rates Data is divided into 100 sec bins |
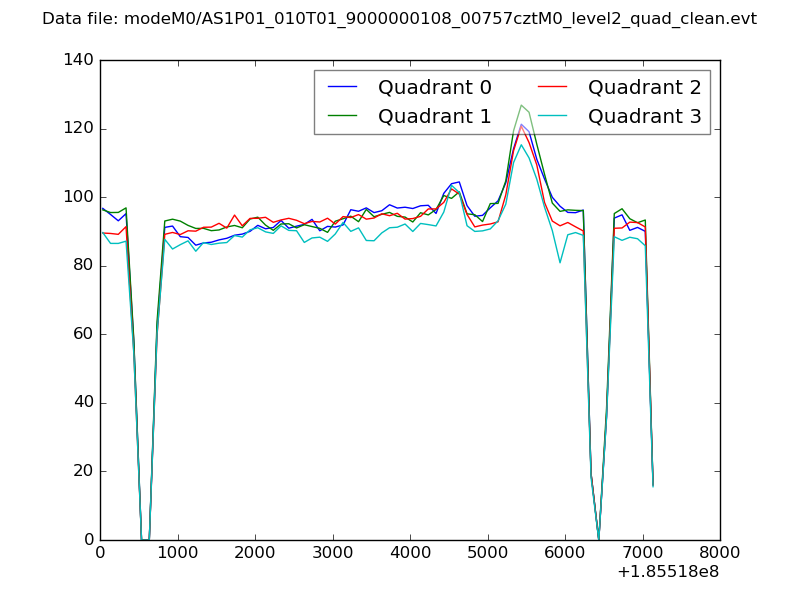 |
|
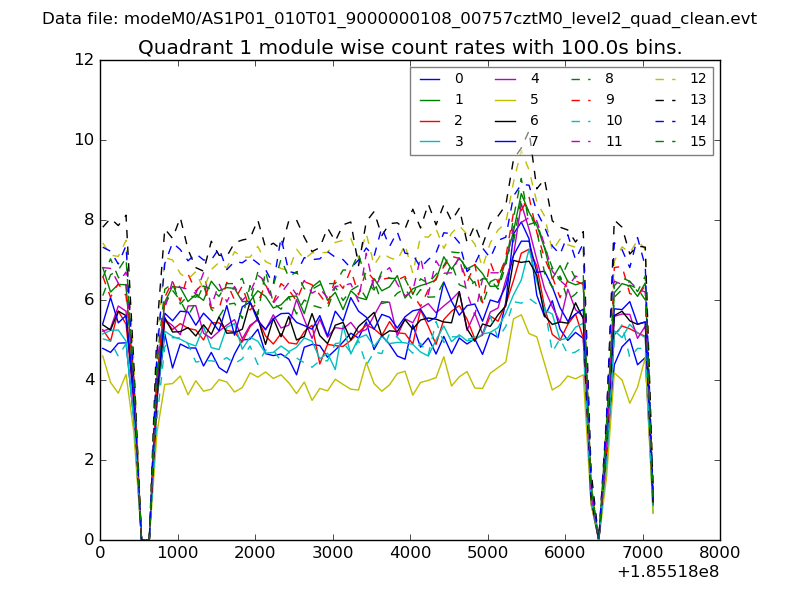
| Module-wise count rates for Quadrant A Data is divided into 100 sec bins |
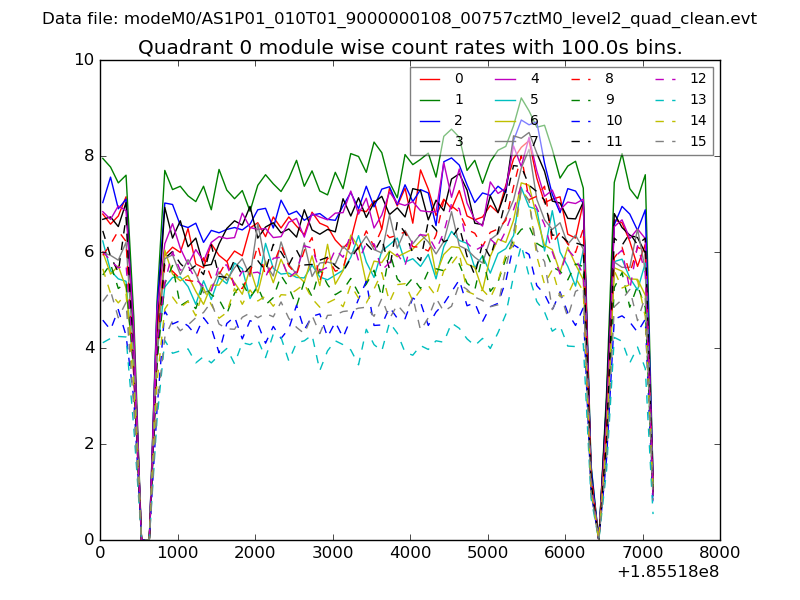 |
 |
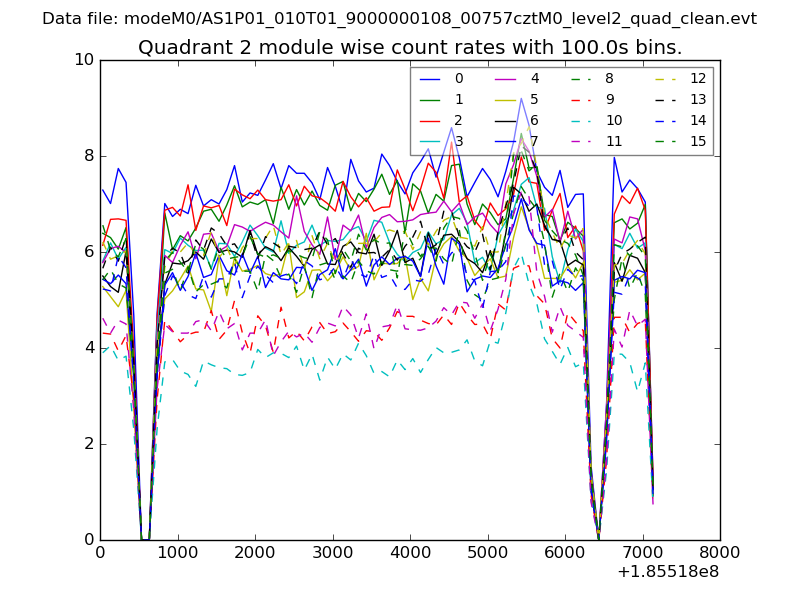
| Module-wise count rates for Quadrant B Data is divided into 100 sec bins |
 |
 |
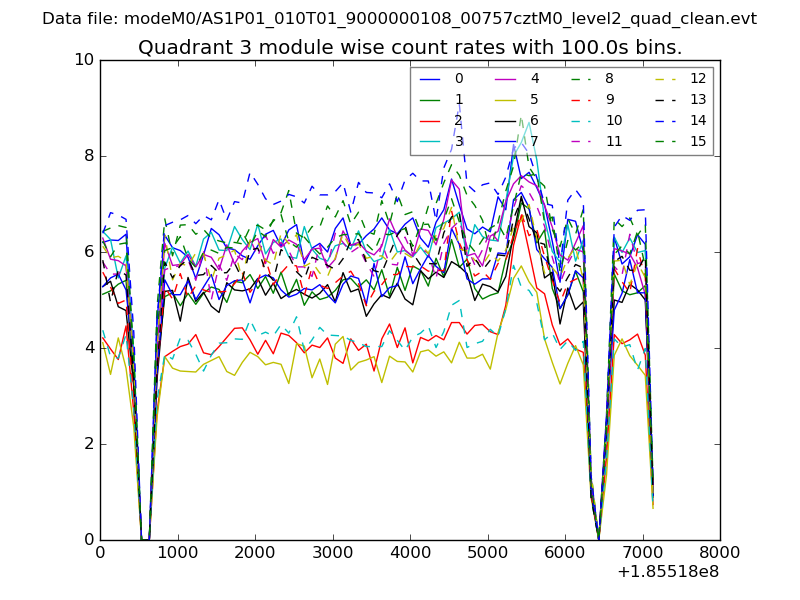
| Module-wise count rates for Quadrant C Data is divided into 100 sec bins |
 |
 |
| Module-wise count rates for Quadrant D Data is divided into 100 sec bins |
 |
 |
| Parameter | Plot |
|---|---|
| CZT HV Monitor | 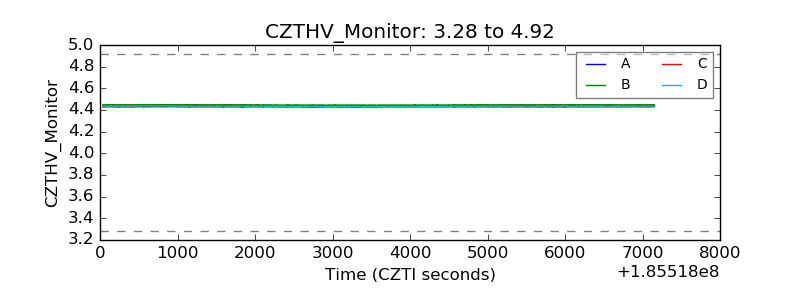 |
| D_VDD | 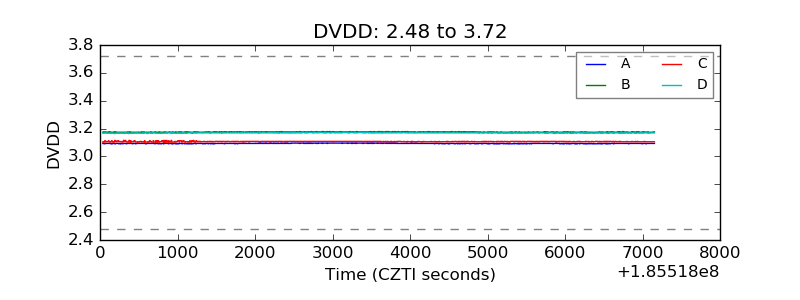 |
| Temperature 1 | 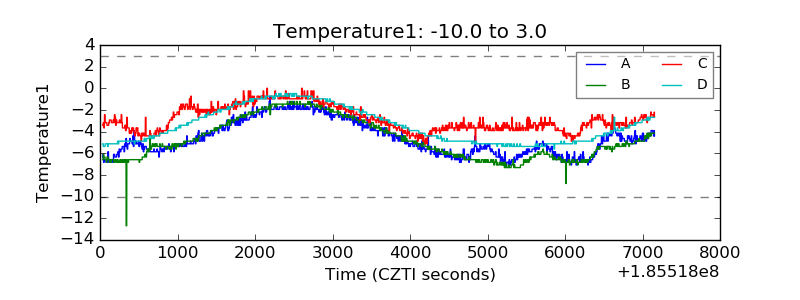 |
| Veto HV Monitor | 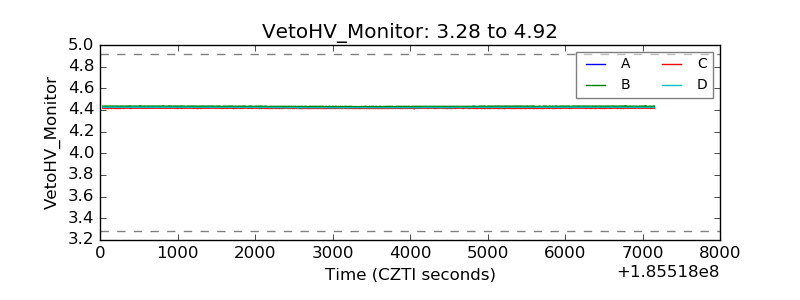 |
| Veto LLD | 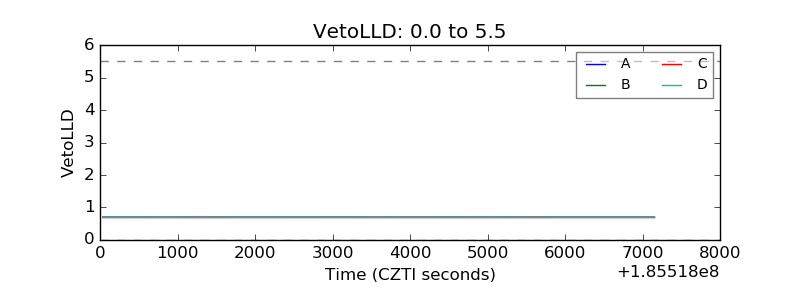 |
| Alpha Counter | 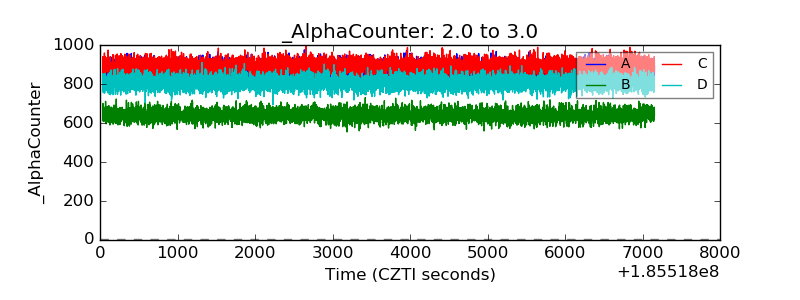 |
| _CPM_Rate | 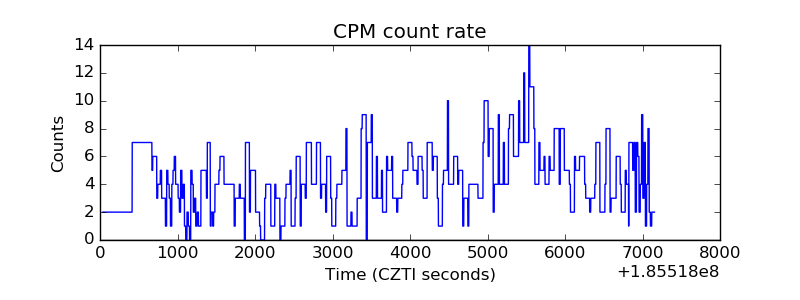 |
| CZT Counter | 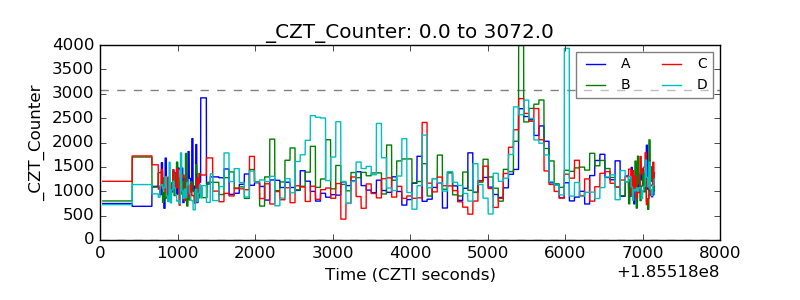 |
| +2.5 Volts monitor | 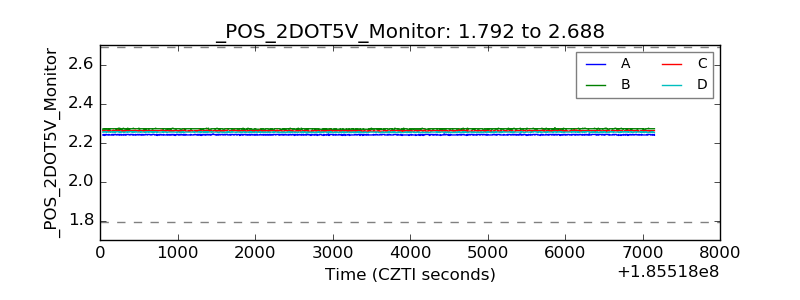 |
| +5 Volts monitor |  |
| _ROLL_ROT | 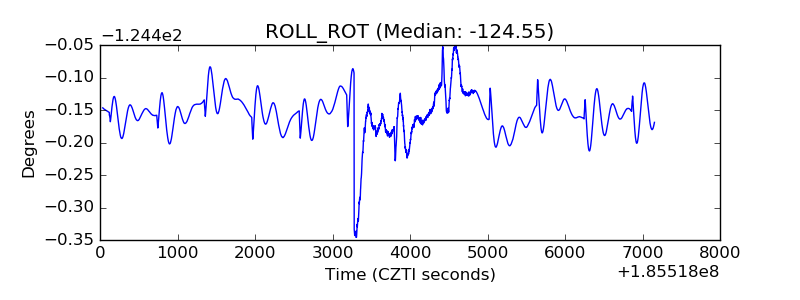 |
| _Roll_DEC | 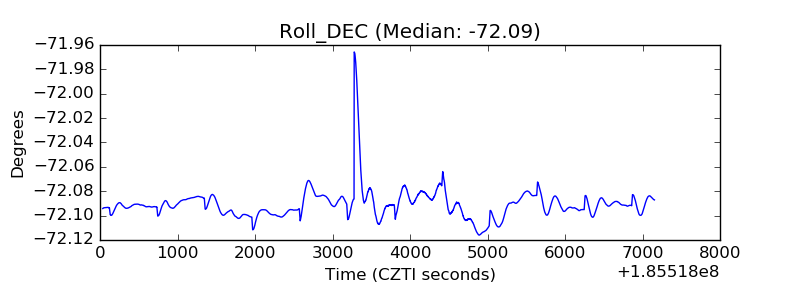 |
| _Roll_RA | 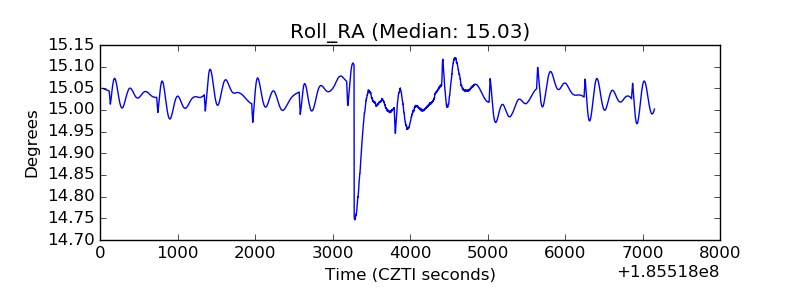 |
| Veto Counter | 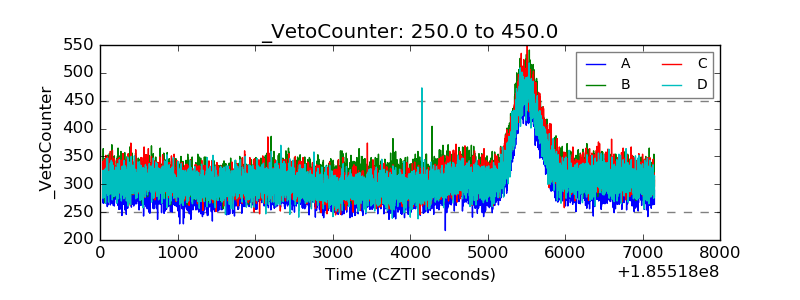 |