| Param | Original file | Final file |
|---|---|---|
| Filename | modeM0/AS1P01_010T01_9000000108_00758cztM0_level2.evt | modeM0/AS1P01_010T01_9000000108_00758cztM0_level2_quad_clean.evt |
| Size (bytes) | 1,303,945,920 | 101,589,120 |
| Size | 1.2 GB | 96.9 MB |
| Events in quadrant A | 9,511,704 | 648,747 |
| Events in quadrant B | 9,809,150 | 660,402 |
| Events in quadrant C | 9,055,501 | 648,618 |
| Events in quadrant D | 10,628,773 | 607,281 |
| Mode SS | |||
|---|---|---|---|
| Quadrant | BADHDUFLAG | Total packets | Discarded packets |
| A | 0 | 150 | 0 |
| B | 0 | 150 | 0 |
| C | 0 | 150 | 0 |
| D | 0 | 150 | 0 |
| Mode M0 | |||
|---|---|---|---|
| Quadrant | BADHDUFLAG | Total packets | Discarded packets |
| A | 0 | 33485 | 0 |
| B | 0 | 34375 | 0 |
| C | 0 | 32156 | 0 |
| D | 0 | 36956 | 0 |
| Mode M9 | |||
|---|---|---|---|
| Quadrant | BADHDUFLAG | Total packets | Discarded packets |
| A | 0 | 2 | 0 |
| B | 0 | 2 | 0 |
| C | 0 | 2 | 0 |
| D | 0 | 2 | 0 |
| Quadrant | Total seconds | Saturated seconds | Saturation percentage |
|---|---|---|---|
| A | 7341 | 245 | 3.337420% |
| B | 7342 | 187 | 2.546990% |
| C | 7342 | 144 | 1.961318% |
| D | 7342 | 818 | 11.141378% |
Noise dominated data is calculated using 1-second bins in cleaned event files. If a bin has >2000 counts, and if more than 50% of those come from <1% of pixels, then it is considered to be noise-dominated and hence unusable.
| Quadrant | # 1 sec bins | Bins with >0 counts | Bins with >2000 counts | High rate bins dominated by noise | Noise dominated (total time) | Noise dominated (detector-on time) | Marked lightcurve |
|---|---|---|---|---|---|---|---|
| A | 7456 | 7343 | 565 | 565 | 7.58% | 7.69% | 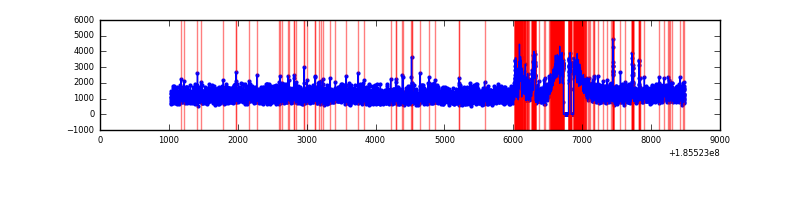 |
| B | 7457 | 7344 | 528 | 528 | 7.08% | 7.19% | 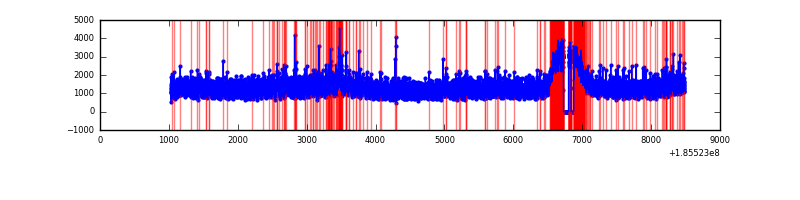 |
| C | 7457 | 7344 | 423 | 423 | 5.67% | 5.76% |  |
| D | 7457 | 7344 | 1481 | 1481 | 19.86% | 20.17% | 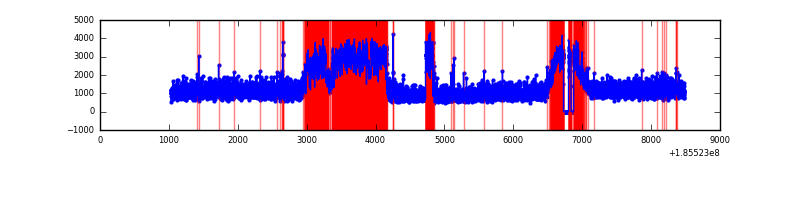 |
Top three noisy pixels from each quadrant. If the there are fewer than three noisy pixels in the level2.evt file, extra rows are filled as -1
| Pixel properties | Quadrant properties | ||||||
|---|---|---|---|---|---|---|---|
| Quadrant | DetID | PixID | Counts | Sigma | Mean | Median | Sigma |
| A | 15 | 233 | 368935 | 638.29 | 2355 | 2368 | 574.3 |
| A | 12 | 236 | 46805 | 77.38 | 2355 | 2368 | 574.3 |
| A | 0 | 117 | 32328 | 52.17 | 2355 | 2368 | 574.3 |
| B | 7 | 221 | 380308 | 646.73 | 2447 | 2451 | 584.3 |
| B | 8 | 38 | 101142 | 168.92 | 2447 | 2451 | 584.3 |
| B | 5 | 191 | 10747 | 14.2 | 2447 | 2451 | 584.3 |
| C | 8 | 208 | 68730 | 104.26 | 2260 | 2336 | 636.8 |
| C | 15 | 241 | 63973 | 96.79 | 2260 | 2336 | 636.8 |
| C | 3 | 111 | 40374 | 59.73 | 2260 | 2336 | 636.8 |
| D | 13 | 25 | 2368561 | 3541.63 | 2146 | 2223 | 668.1 |
| D | 1 | 4 | 83410 | 121.51 | 2146 | 2223 | 668.1 |
| D | 6 | 226 | 70091 | 101.58 | 2146 | 2223 | 668.1 |
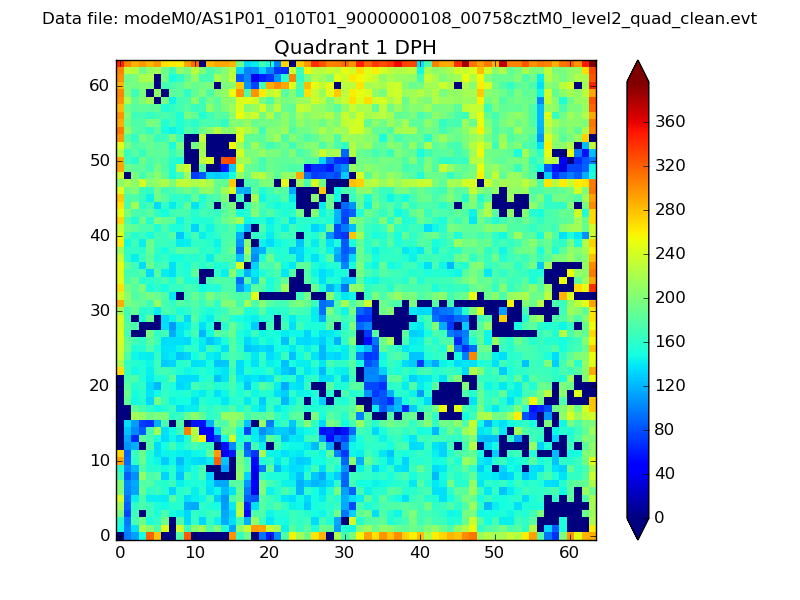
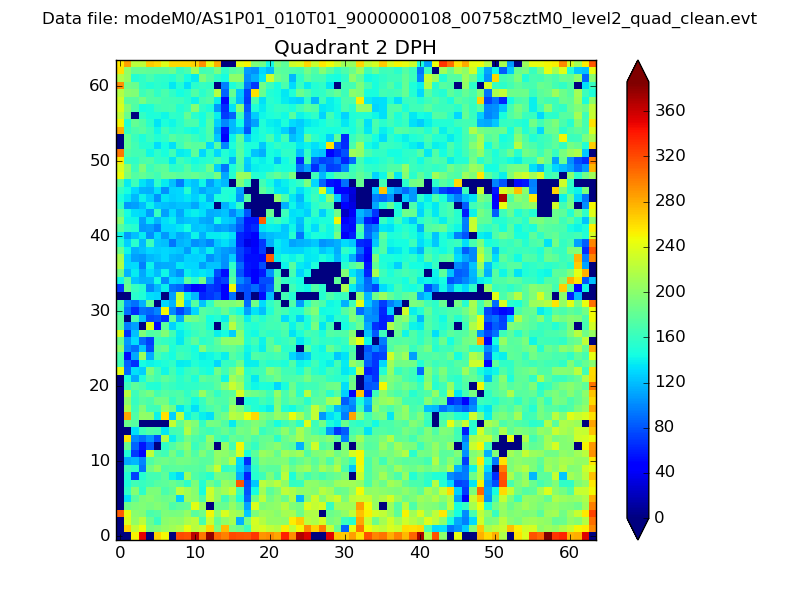
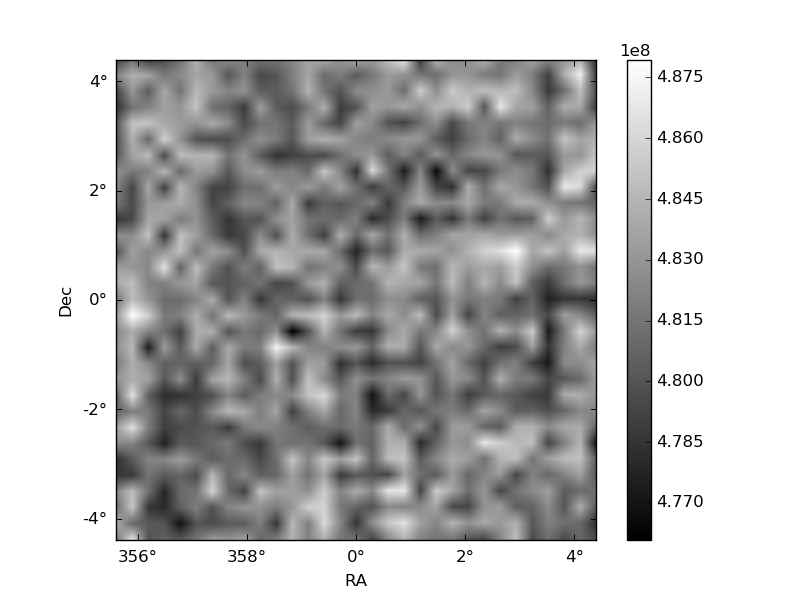
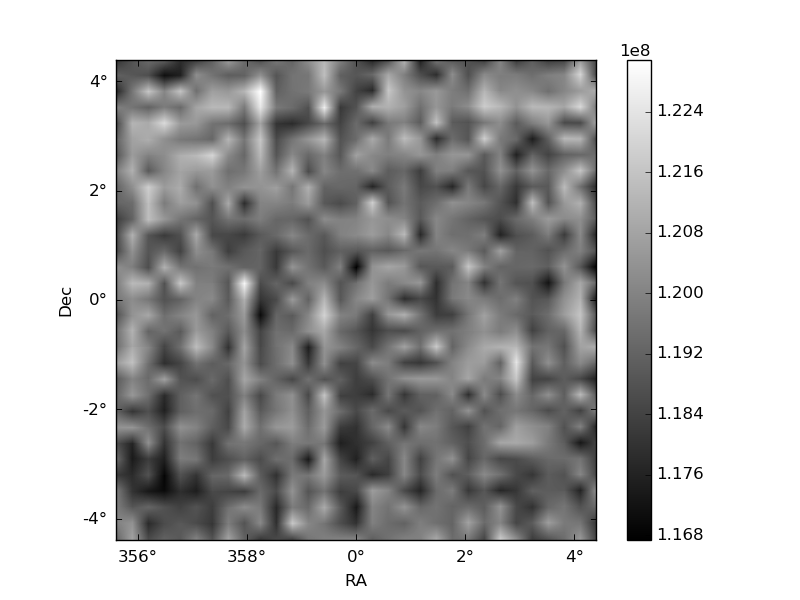
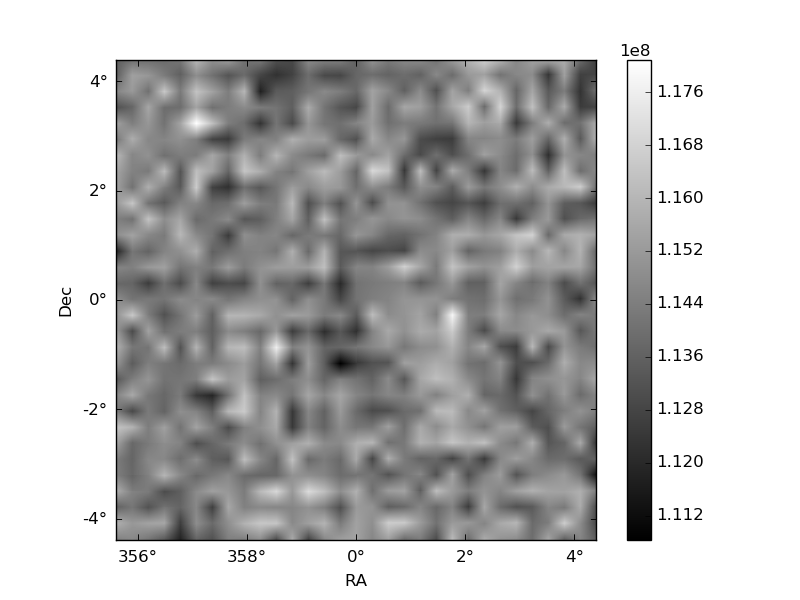
Histogram calculated using DETX and DETY for each event in the final _common_clean file
| Quadrant A | 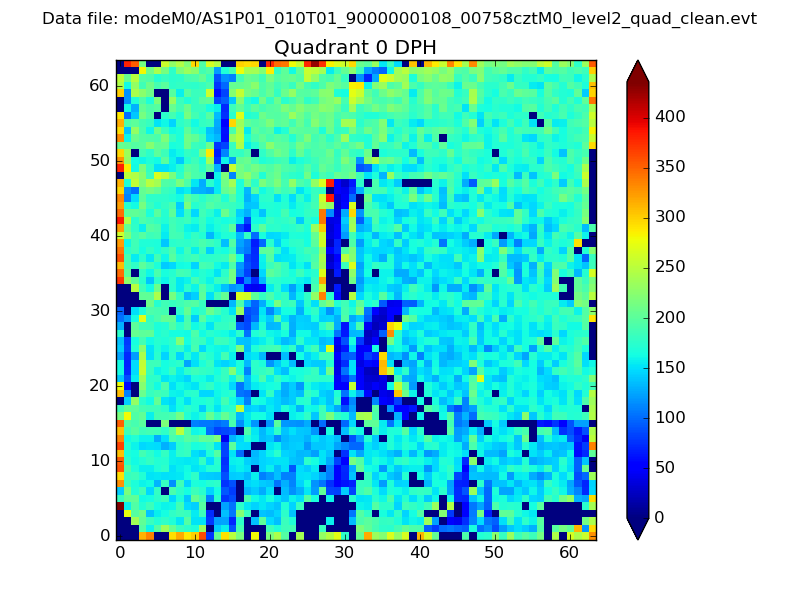 |
 |
Quadrant B |
|---|---|---|---|
| Quadrant D | 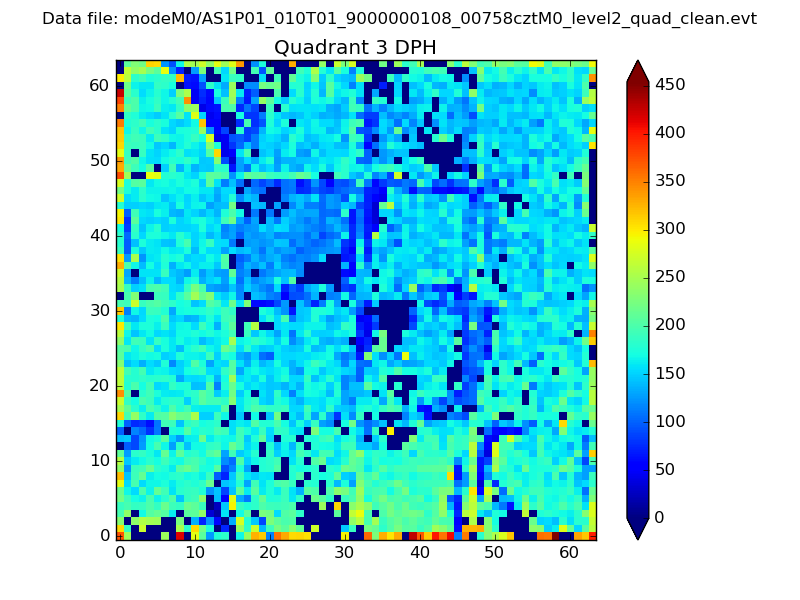 |
 |
Quadrant C |
| Plot type | Count rate plots | Images |
|---|---|---|
| Comparison with Poisson distribution Blue bars denote a histogram of data divided into 1 sec bins. Red curve is a Poisson curve with rate = median count rate of data. |
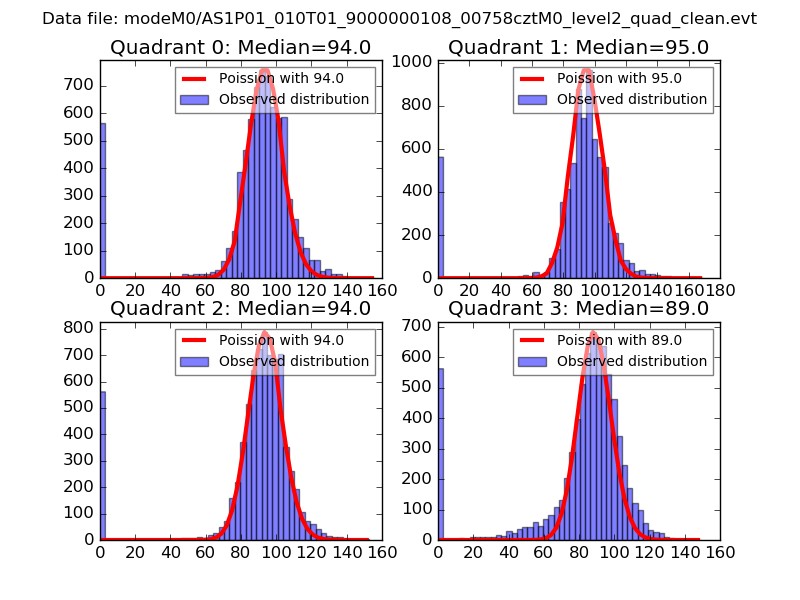 |
 |
| Quadrant-wise count rates Data is divided into 100 sec bins |
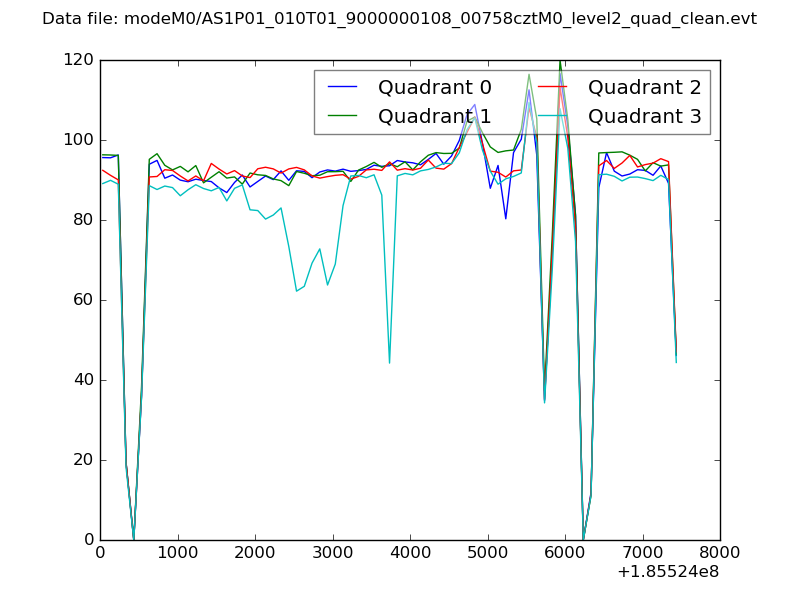 |
|
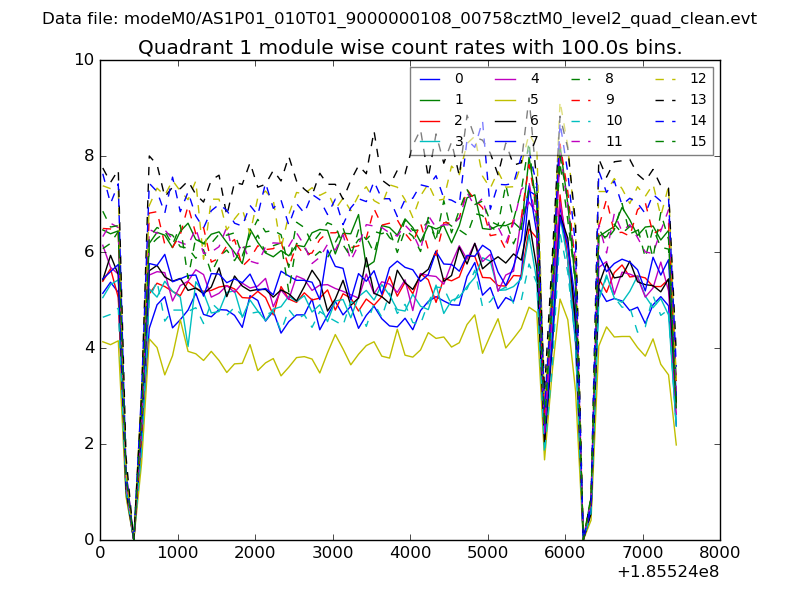
| Module-wise count rates for Quadrant A Data is divided into 100 sec bins |
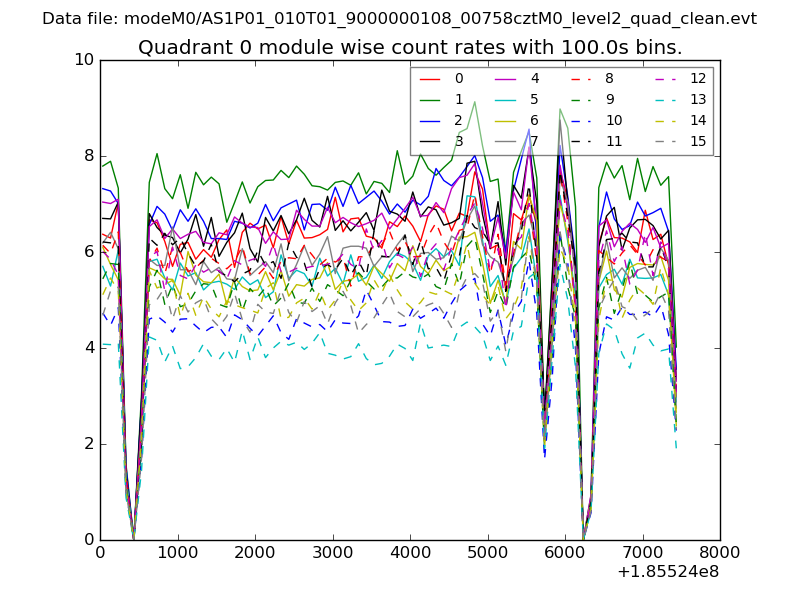 |
 |
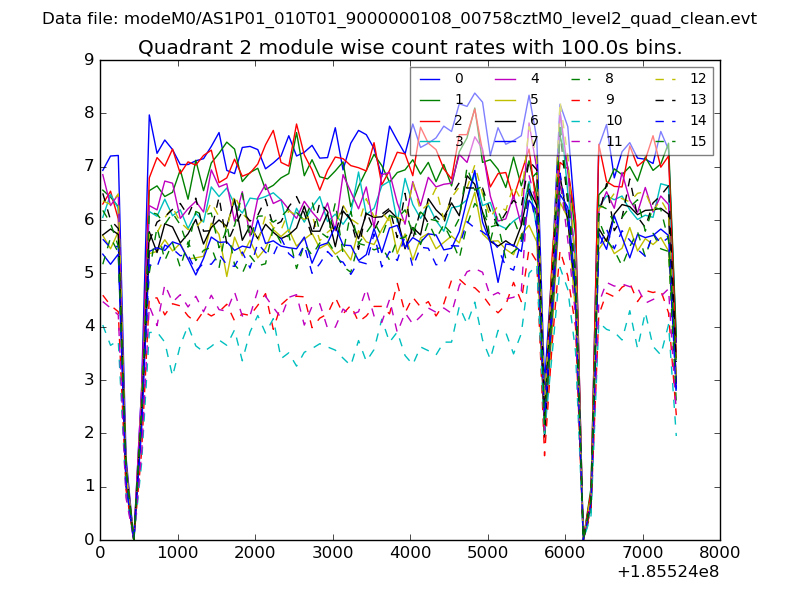
| Module-wise count rates for Quadrant B Data is divided into 100 sec bins |
 |
 |
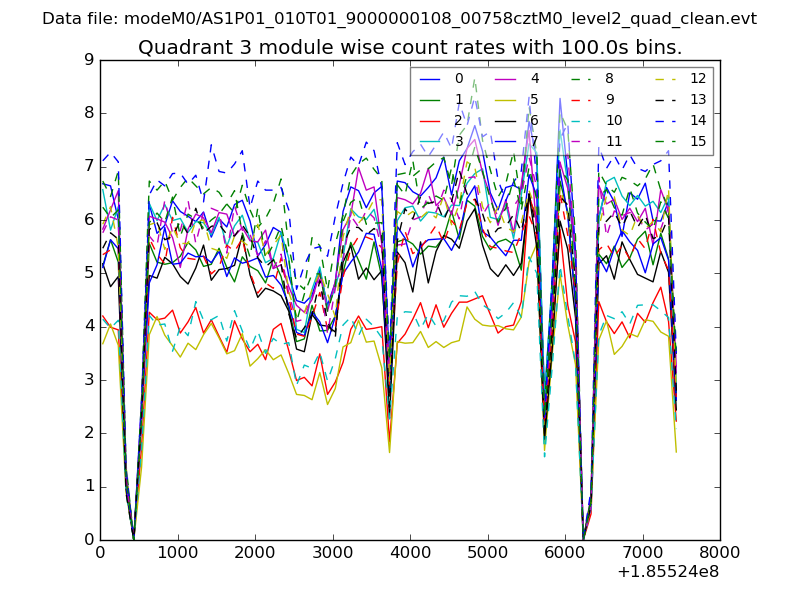
| Module-wise count rates for Quadrant C Data is divided into 100 sec bins |
 |
 |
| Module-wise count rates for Quadrant D Data is divided into 100 sec bins |
 |
 |
| Parameter | Plot |
|---|---|
| CZT HV Monitor | 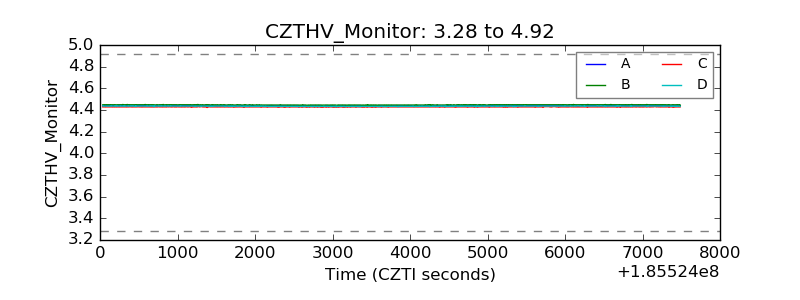 |
| D_VDD | 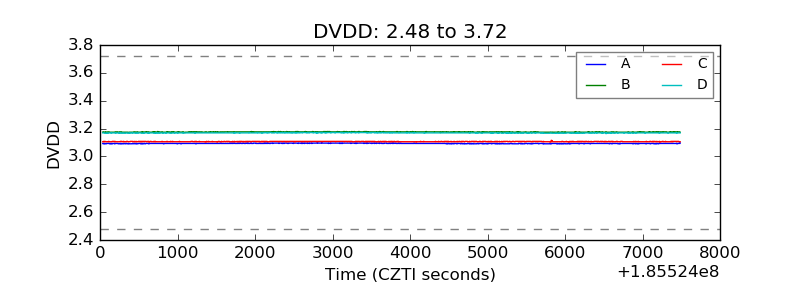 |
| Temperature 1 | 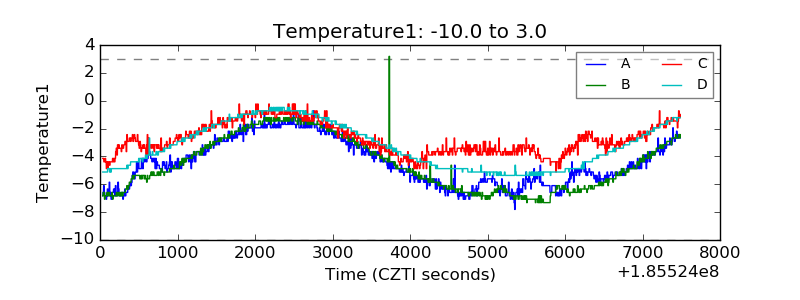 |
| Veto HV Monitor | 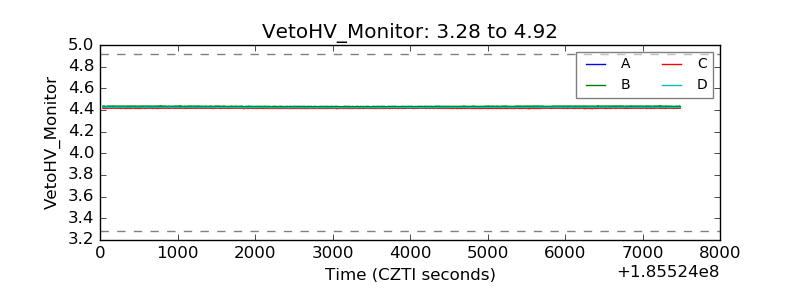 |
| Veto LLD | 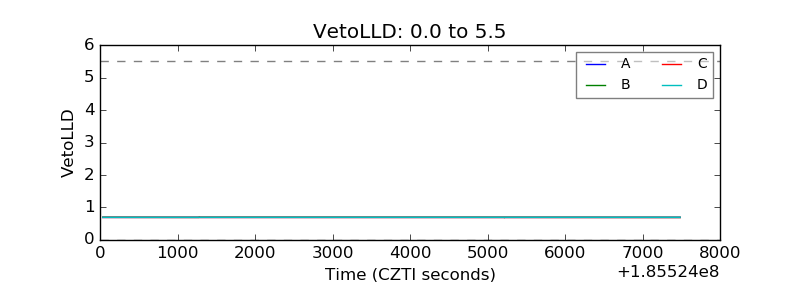 |
| Alpha Counter | 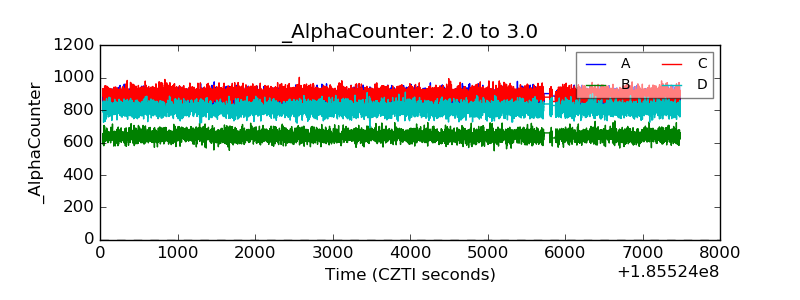 |
| _CPM_Rate | 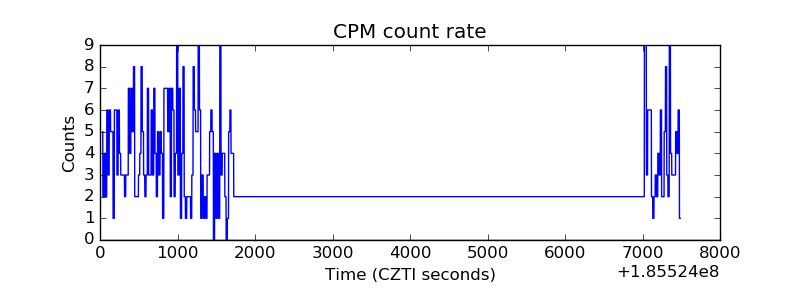 |
| CZT Counter | 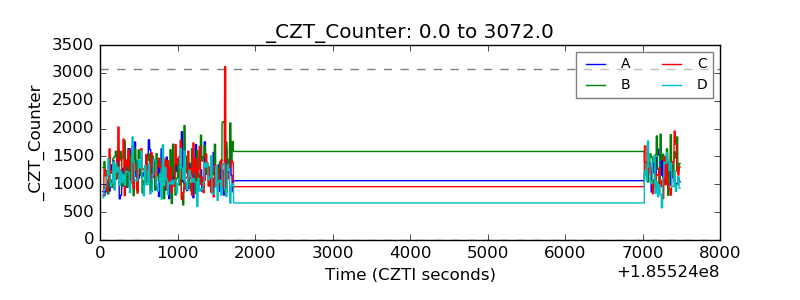 |
| +2.5 Volts monitor |  |
| +5 Volts monitor | 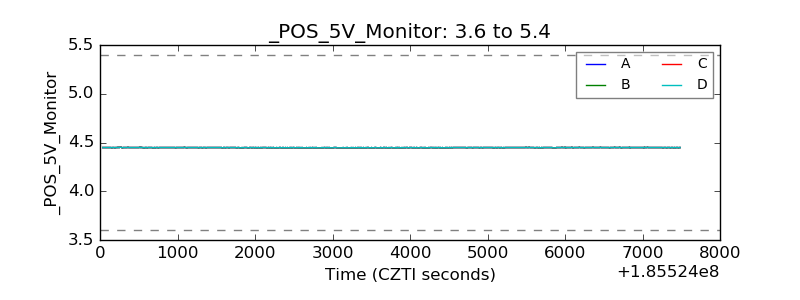 |
| _ROLL_ROT | 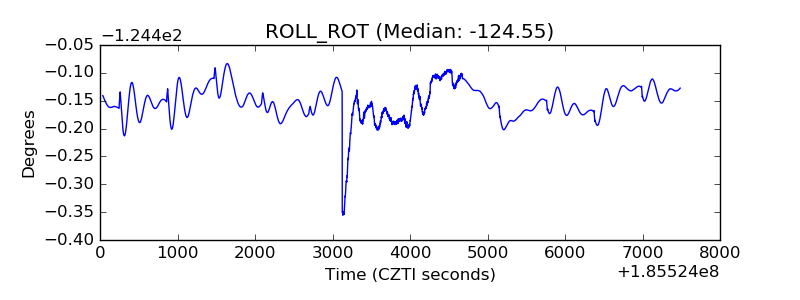 |
| _Roll_DEC | 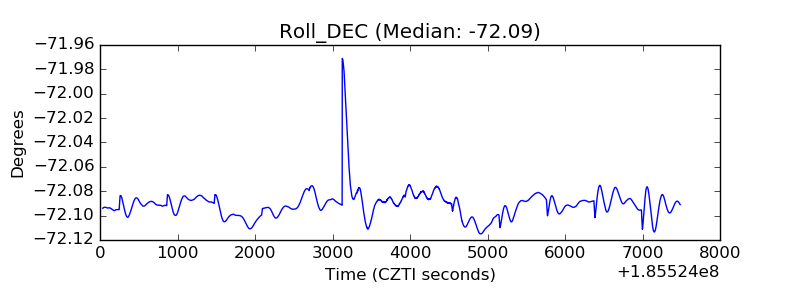 |
| _Roll_RA | 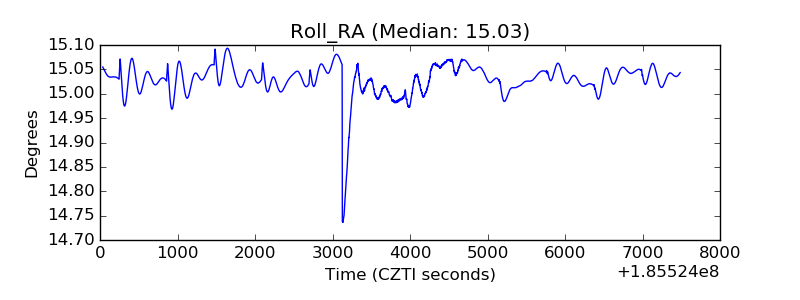 |
| Veto Counter | 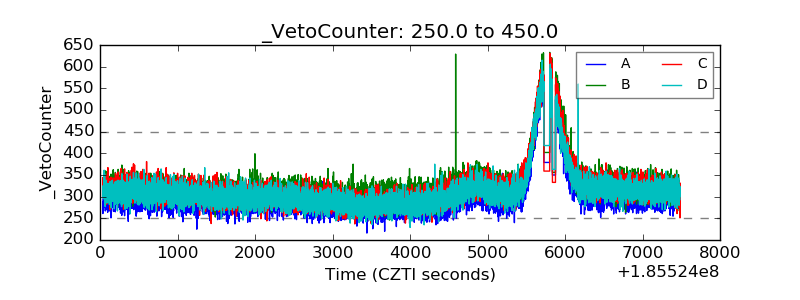 |