| Param | Original file | Final file |
|---|---|---|
| Filename | modeM0/AS1P01_010T01_9000000108_00760cztM0_level2.evt | modeM0/AS1P01_010T01_9000000108_00760cztM0_level2_quad_clean.evt |
| Size (bytes) | 328,492,800 | 26,899,200 |
| Size | 313.3 MB | 25.7 MB |
| Events in quadrant A | 2,459,167 | 168,149 |
| Events in quadrant B | 2,572,683 | 171,975 |
| Events in quadrant C | 2,169,865 | 173,649 |
| Events in quadrant D | 2,620,331 | 163,720 |
| Mode SS | |||
|---|---|---|---|
| Quadrant | BADHDUFLAG | Total packets | Discarded packets |
| A | 0 | 38 | 0 |
| B | 0 | 38 | 0 |
| C | 0 | 38 | 0 |
| D | 0 | 38 | 0 |
| Mode M0 | |||
|---|---|---|---|
| Quadrant | BADHDUFLAG | Total packets | Discarded packets |
| A | 0 | 8633 | 0 |
| B | 0 | 8962 | 0 |
| C | 0 | 7762 | 0 |
| D | 0 | 9128 | 0 |
| Quadrant | Total seconds | Saturated seconds | Saturation percentage |
|---|---|---|---|
| A | 1870 | 37 | 1.978610% |
| B | 1870 | 10 | 0.534759% |
| C | 1870 | 0 | 0.000000% |
| D | 1870 | 75 | 4.010695% |
Noise dominated data is calculated using 1-second bins in cleaned event files. If a bin has >2000 counts, and if more than 50% of those come from <1% of pixels, then it is considered to be noise-dominated and hence unusable.
| Quadrant | # 1 sec bins | Bins with >0 counts | Bins with >2000 counts | High rate bins dominated by noise | Noise dominated (total time) | Noise dominated (detector-on time) | Marked lightcurve |
|---|---|---|---|---|---|---|---|
| A | 1870 | 1870 | 109 | 109 | 5.83% | 5.83% |  |
| B | 1870 | 1870 | 99 | 99 | 5.29% | 5.29% |  |
| C | 1870 | 1870 | 13 | 13 | 0.70% | 0.70% | 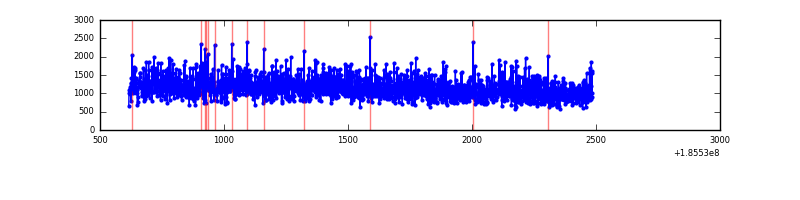 |
| D | 1870 | 1870 | 254 | 254 | 13.58% | 13.58% | 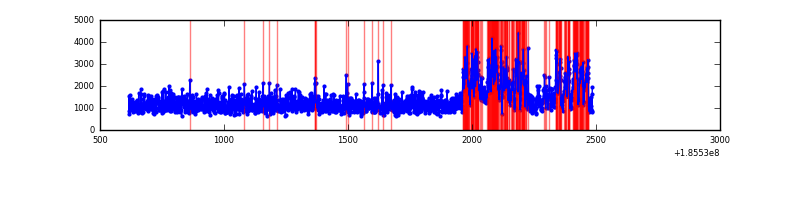 |
Top three noisy pixels from each quadrant. If the there are fewer than three noisy pixels in the level2.evt file, extra rows are filled as -1
| Pixel properties | Quadrant properties | ||||||
|---|---|---|---|---|---|---|---|
| Quadrant | DetID | PixID | Counts | Sigma | Mean | Median | Sigma |
| A | 15 | 233 | 212840 | 1507.97 | 575 | 576 | 140.8 |
| A | 0 | 117 | 29438 | 205.04 | 575 | 576 | 140.8 |
| A | 8 | 65 | 5818 | 37.24 | 575 | 576 | 140.8 |
| B | 7 | 221 | 317560 | 2231.19 | 582 | 583 | 142.1 |
| B | 8 | 38 | 18884 | 128.82 | 582 | 583 | 142.1 |
| B | 0 | 220 | 6643 | 42.66 | 582 | 583 | 142.1 |
| C | 15 | 241 | 17490 | 109.17 | 543 | 562 | 155.1 |
| C | 3 | 111 | 11557 | 70.9 | 543 | 562 | 155.1 |
| C | 3 | 79 | 10032 | 61.07 | 543 | 562 | 155.1 |
| D | 12 | 33 | 487859 | 2915.26 | 541 | 556 | 167.2 |
| D | 1 | 4 | 31350 | 184.22 | 541 | 556 | 167.2 |
| D | 13 | 25 | 30688 | 180.26 | 541 | 556 | 167.2 |
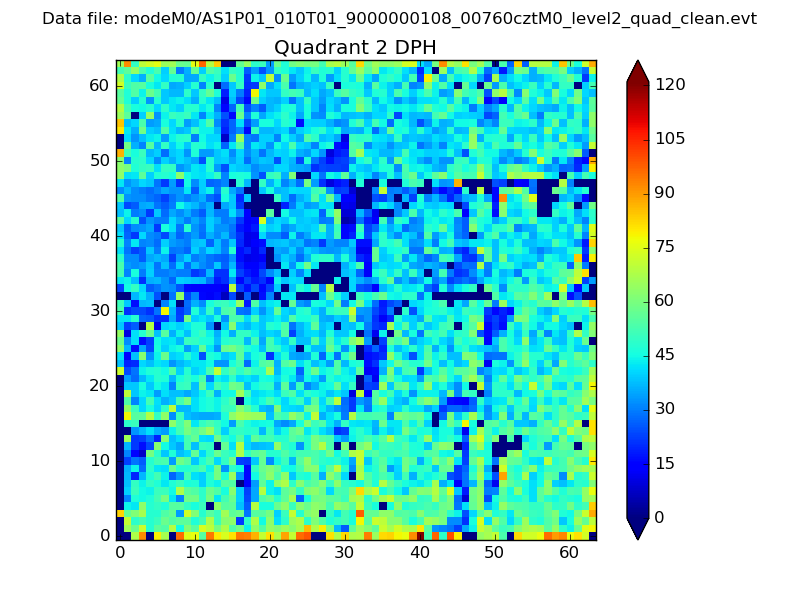
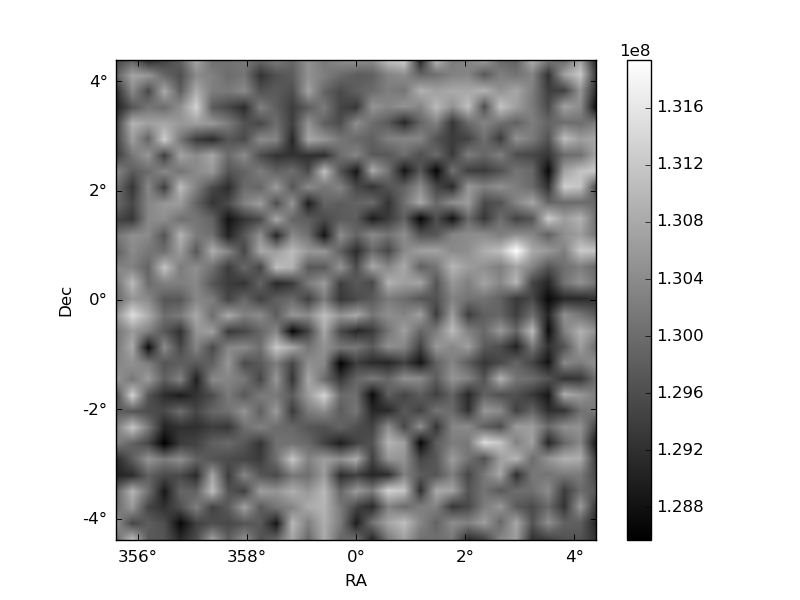
Histogram calculated using DETX and DETY for each event in the final _common_clean file
| Quadrant A |  |
 |
Quadrant B |
|---|---|---|---|
| Quadrant D | 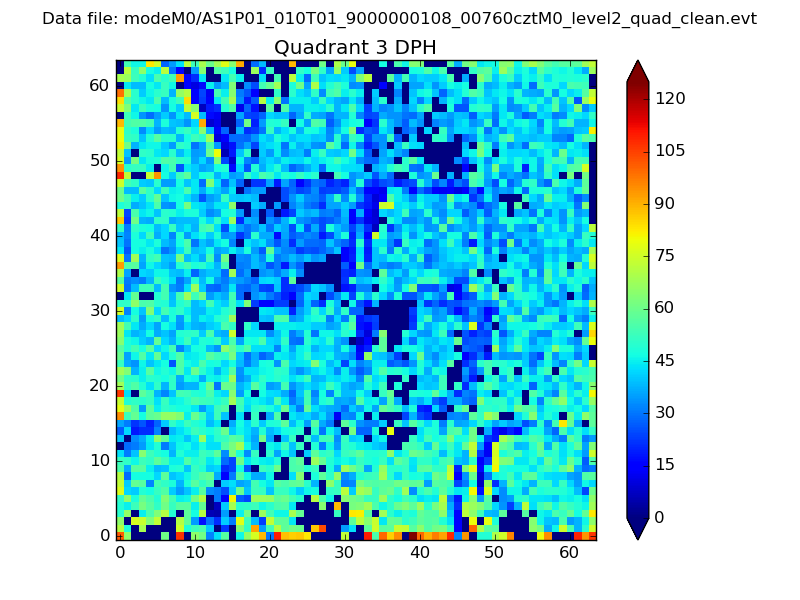 |
 |
Quadrant C |
| Plot type | Count rate plots | Images |
|---|---|---|
| Comparison with Poisson distribution Blue bars denote a histogram of data divided into 1 sec bins. Red curve is a Poisson curve with rate = median count rate of data. |
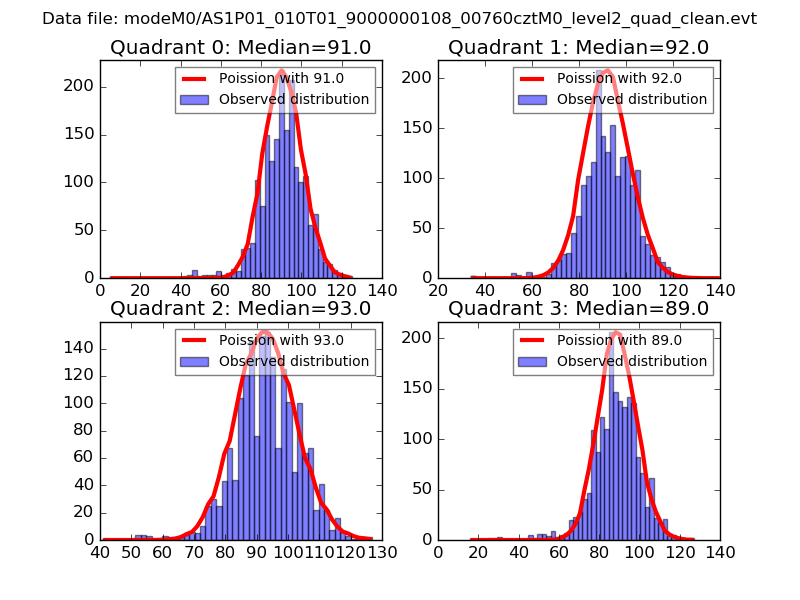 |
 |
| Quadrant-wise count rates Data is divided into 100 sec bins |
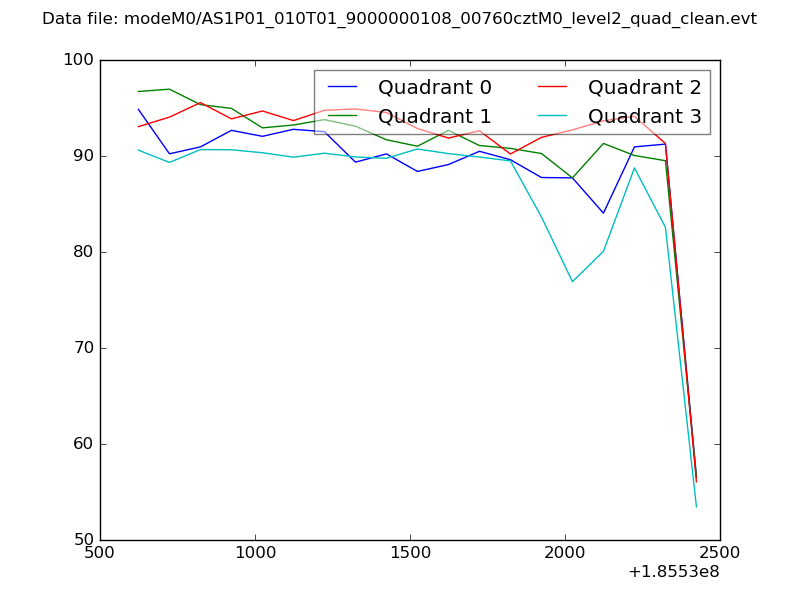 |
|
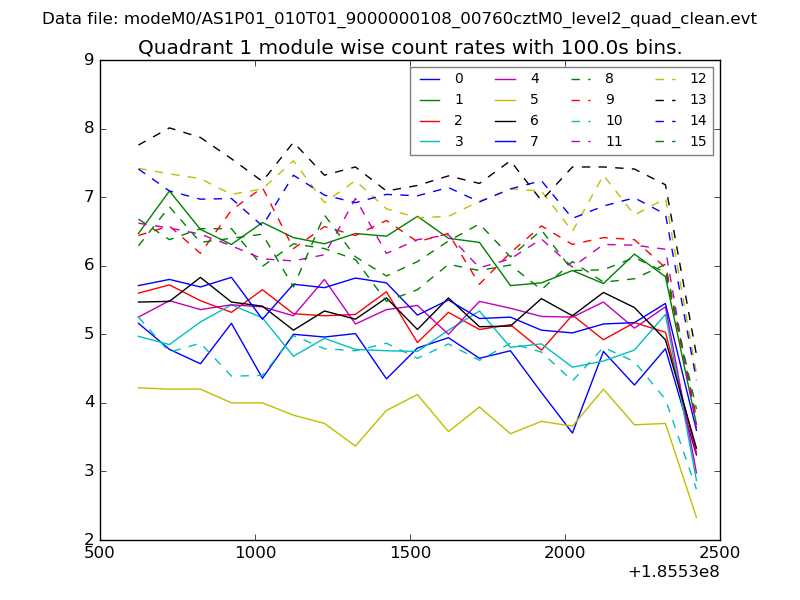
| Module-wise count rates for Quadrant A Data is divided into 100 sec bins |
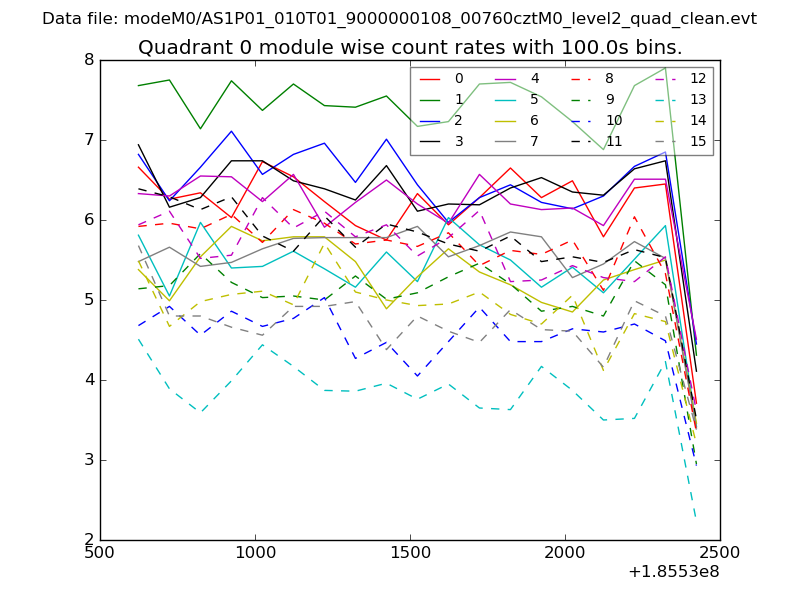 |
 |
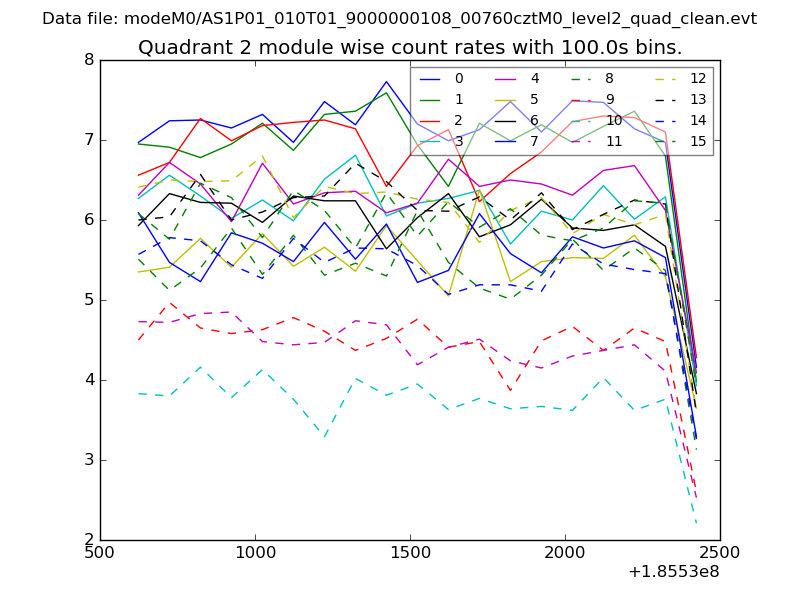
| Module-wise count rates for Quadrant B Data is divided into 100 sec bins |
 |
 |
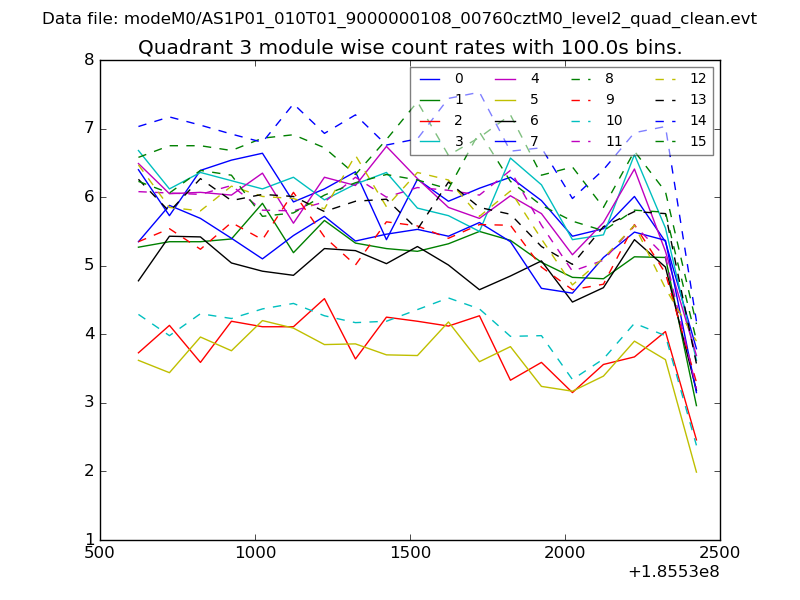
| Module-wise count rates for Quadrant C Data is divided into 100 sec bins |
 |
 |
| Module-wise count rates for Quadrant D Data is divided into 100 sec bins |
 |
 |
| Parameter | Plot |
|---|---|
| CZT HV Monitor | 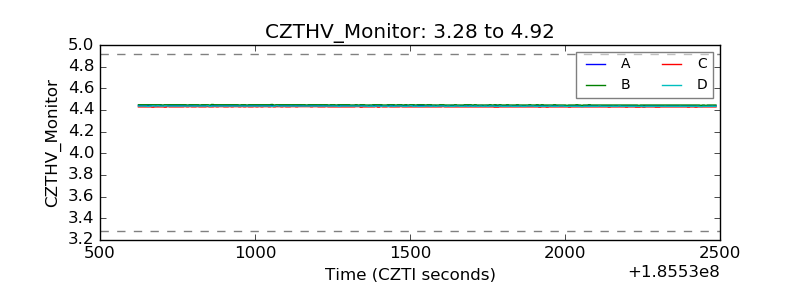 |
| D_VDD | 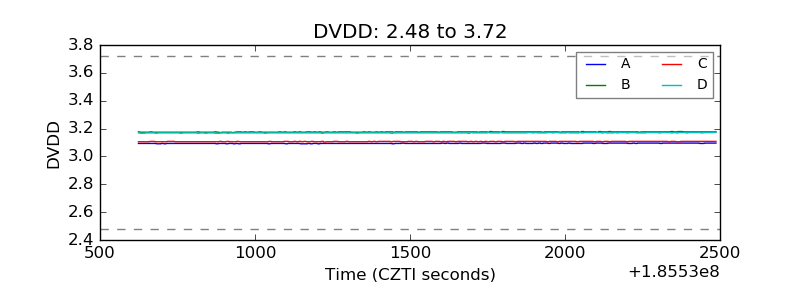 |
| Temperature 1 | 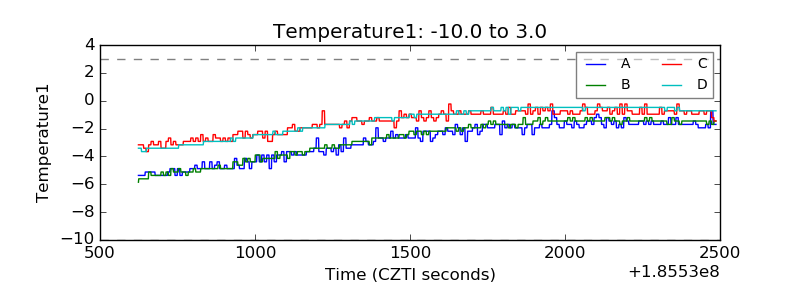 |
| Veto HV Monitor | 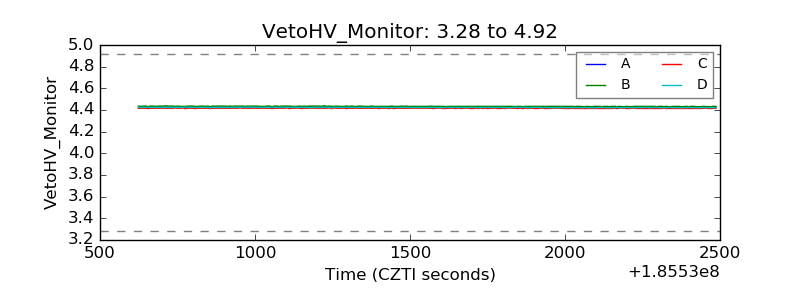 |
| Veto LLD | 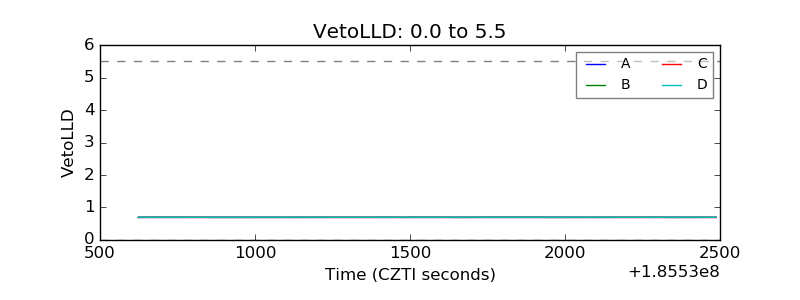 |
| Alpha Counter | 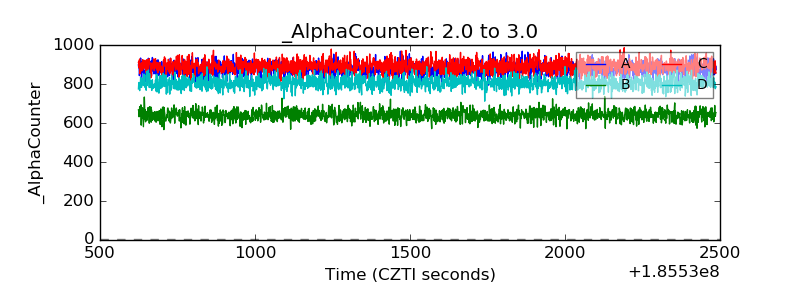 |
| _CPM_Rate | 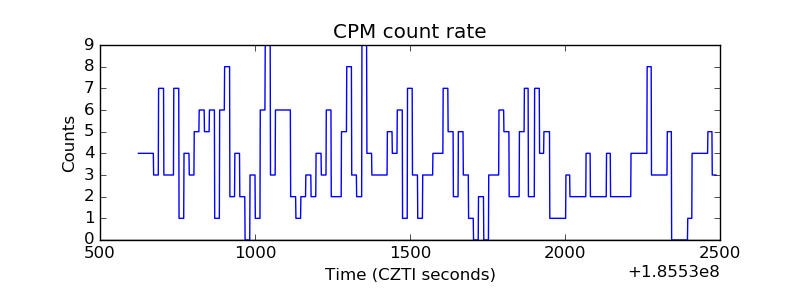 |
| CZT Counter | 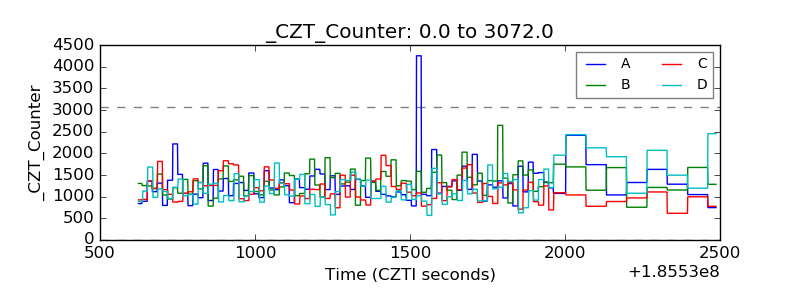 |
| +2.5 Volts monitor |  |
| +5 Volts monitor |  |
| _ROLL_ROT | 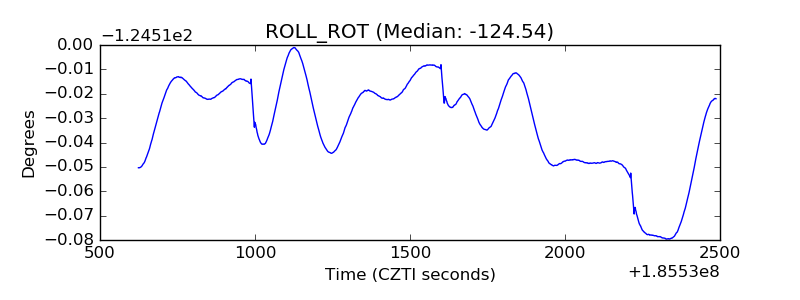 |
| _Roll_DEC | 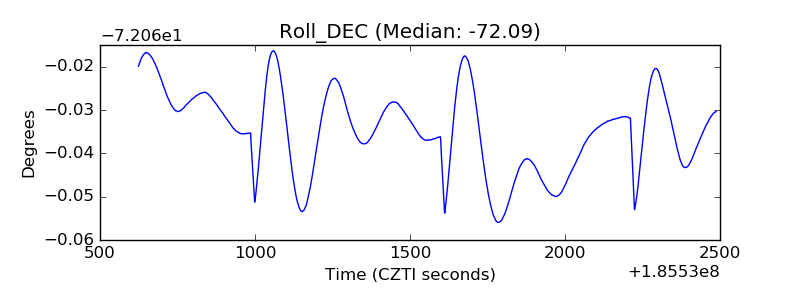 |
| _Roll_RA |  |
| Veto Counter | 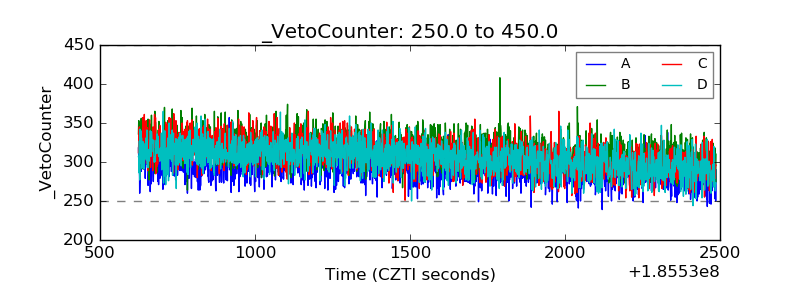 |