| Param | Original file | Final file |
|---|---|---|
| Filename | modeM0/AS1P01_010T01_9000000108_00766cztM0_level2.evt | modeM0/AS1P01_010T01_9000000108_00766cztM0_level2_quad_clean.evt |
| Size (bytes) | 1,070,075,520 | 98,527,680 |
| Size | 1020.5 MB | 94.0 MB |
| Events in quadrant A | 9,096,013 | 640,926 |
| Events in quadrant B | 7,815,093 | 666,913 |
| Events in quadrant C | 7,243,249 | 638,772 |
| Events in quadrant D | 7,839,333 | 601,218 |
| Mode SS | |||
|---|---|---|---|
| Quadrant | BADHDUFLAG | Total packets | Discarded packets |
| A | 0 | 128 | 0 |
| B | 0 | 128 | 0 |
| C | 0 | 128 | 0 |
| D | 0 | 128 | 0 |
| Mode M0 | |||
|---|---|---|---|
| Quadrant | BADHDUFLAG | Total packets | Discarded packets |
| A | 0 | 31494 | 0 |
| B | 0 | 27647 | 0 |
| C | 0 | 26006 | 0 |
| D | 0 | 27780 | 0 |
| Mode M9 | |||
|---|---|---|---|
| Quadrant | BADHDUFLAG | Total packets | Discarded packets |
| A | 0 | 14 | 0 |
| B | 0 | 14 | 0 |
| C | 0 | 14 | 0 |
| D | 0 | 14 | 0 |
| Quadrant | Total seconds | Saturated seconds | Saturation percentage |
|---|---|---|---|
| A | 6240 | 314 | 5.032051% |
| B | 6240 | 45 | 0.721154% |
| C | 6240 | 25 | 0.400641% |
| D | 6240 | 395 | 6.330128% |
Noise dominated data is calculated using 1-second bins in cleaned event files. If a bin has >2000 counts, and if more than 50% of those come from <1% of pixels, then it is considered to be noise-dominated and hence unusable.
| Quadrant | # 1 sec bins | Bins with >0 counts | Bins with >2000 counts | High rate bins dominated by noise | Noise dominated (total time) | Noise dominated (detector-on time) | Marked lightcurve |
|---|---|---|---|---|---|---|---|
| A | 7520 | 6241 | 978 | 978 | 13.01% | 15.67% | 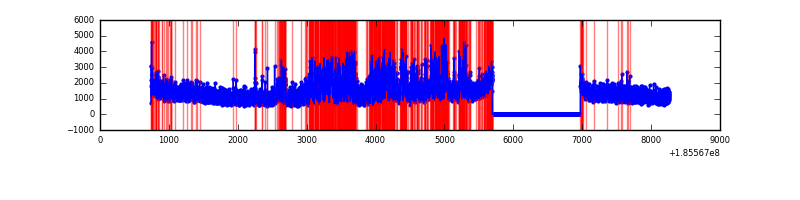 |
| B | 7520 | 6241 | 269 | 269 | 3.58% | 4.31% | 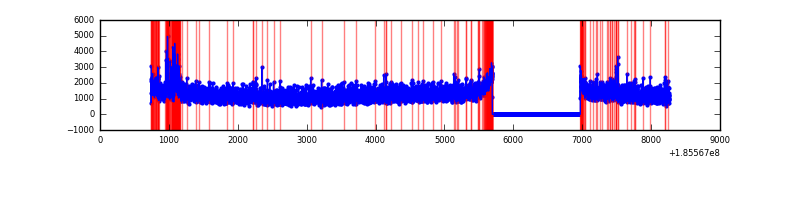 |
| C | 7520 | 6241 | 167 | 167 | 2.22% | 2.68% | 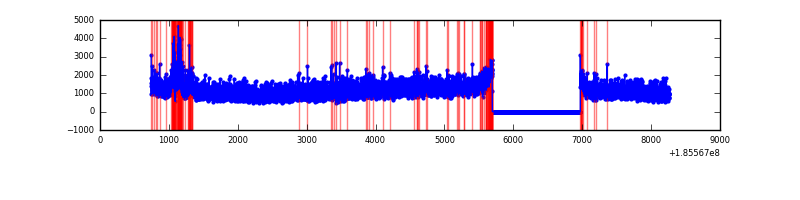 |
| D | 7520 | 6241 | 609 | 609 | 8.10% | 9.76% | 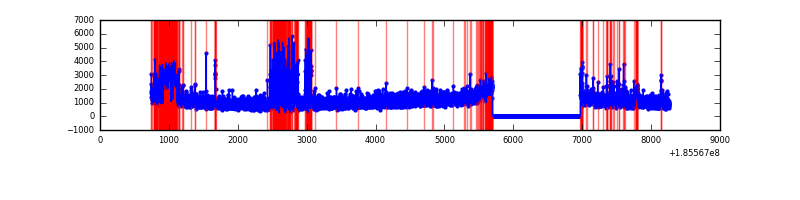 |
Top three noisy pixels from each quadrant. If the there are fewer than three noisy pixels in the level2.evt file, extra rows are filled as -1
| Pixel properties | Quadrant properties | ||||||
|---|---|---|---|---|---|---|---|
| Quadrant | DetID | PixID | Counts | Sigma | Mean | Median | Sigma |
| A | 0 | 117 | 1722294 | 3872.49 | 1851 | 1871 | 444.3 |
| A | 15 | 249 | 170680 | 379.97 | 1851 | 1871 | 444.3 |
| A | 15 | 17 | 47585 | 102.9 | 1851 | 1871 | 444.3 |
| B | 5 | 171 | 176723 | 378.71 | 1974 | 1980 | 461.4 |
| B | 0 | 220 | 67046 | 141.02 | 1974 | 1980 | 461.4 |
| B | 0 | 23 | 29578 | 59.81 | 1974 | 1980 | 461.4 |
| C | 10 | 17 | 199111 | 405.84 | 1756 | 1814 | 486.1 |
| C | 9 | 83 | 89158 | 179.67 | 1756 | 1814 | 486.1 |
| C | 15 | 241 | 33482 | 65.14 | 1756 | 1814 | 486.1 |
| D | 2 | 53 | 475279 | 865.76 | 1733 | 1735 | 547.0 |
| D | 10 | 85 | 314926 | 572.59 | 1733 | 1735 | 547.0 |
| D | 1 | 4 | 86043 | 154.14 | 1733 | 1735 | 547.0 |
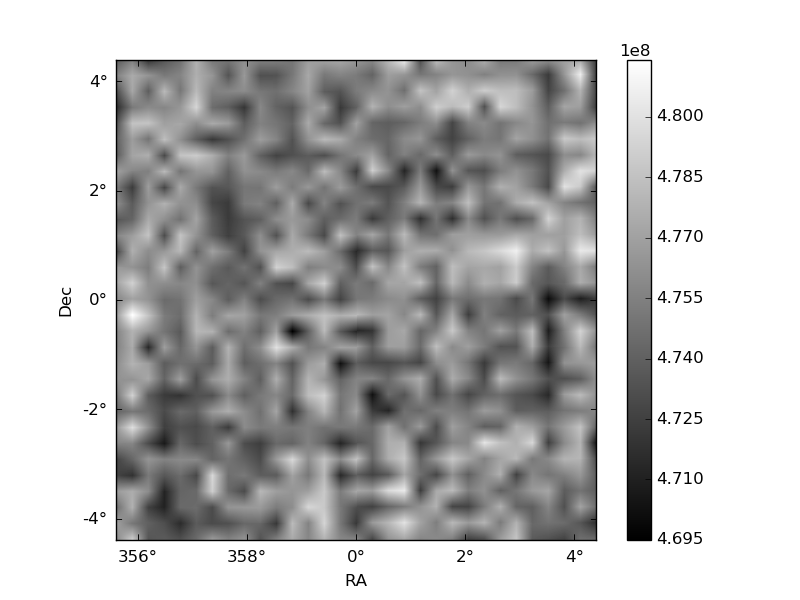
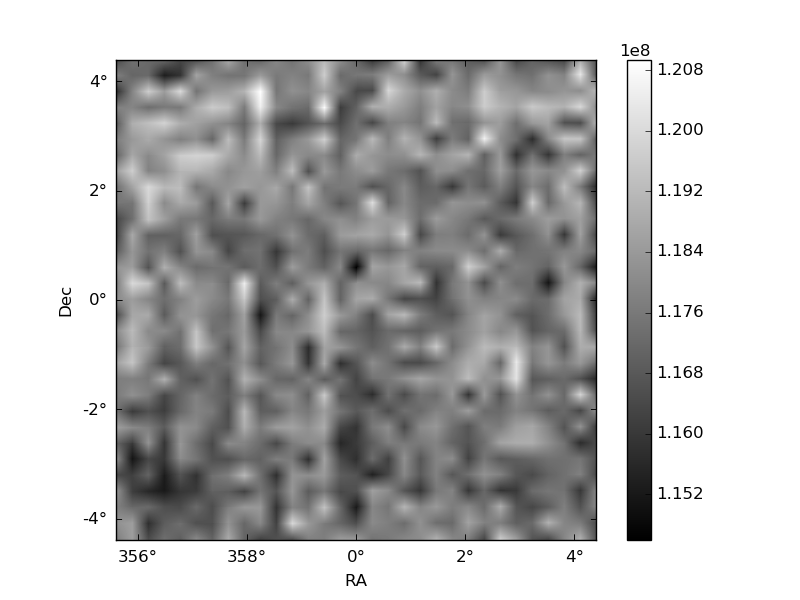
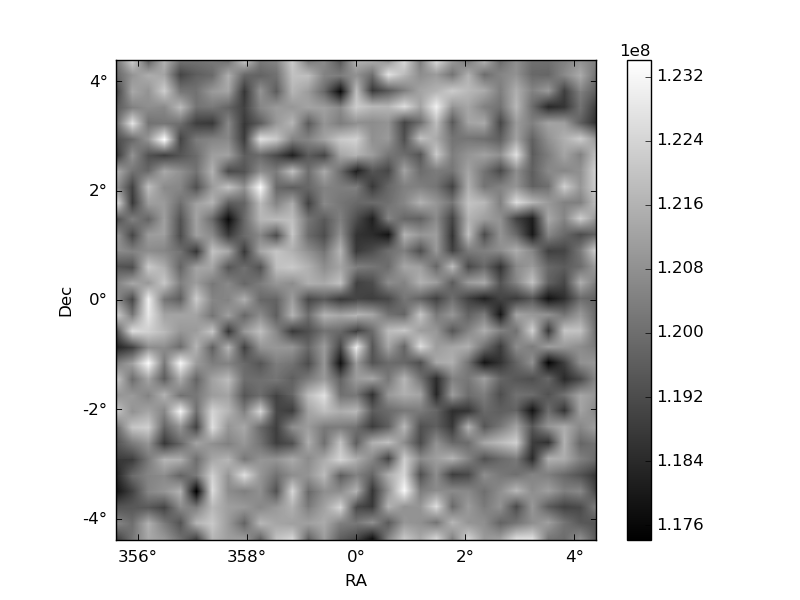
Histogram calculated using DETX and DETY for each event in the final _common_clean file
| Quadrant A | 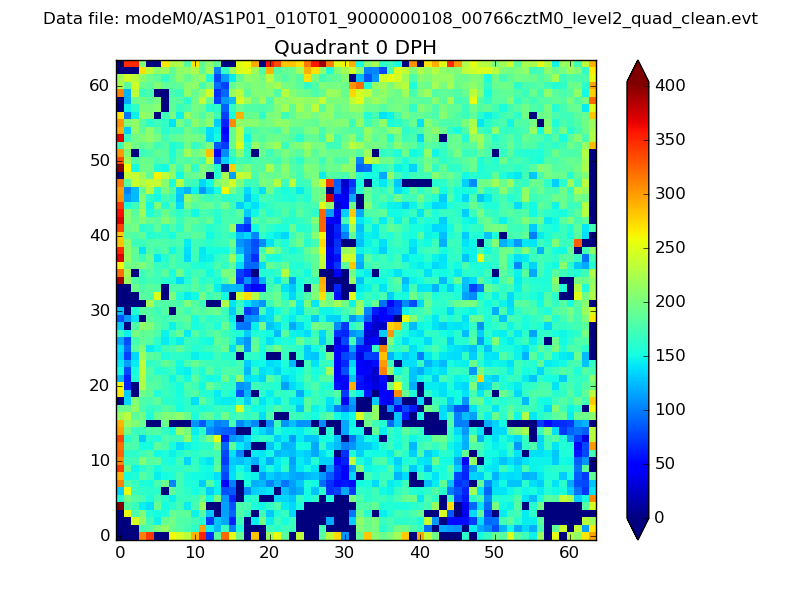 |
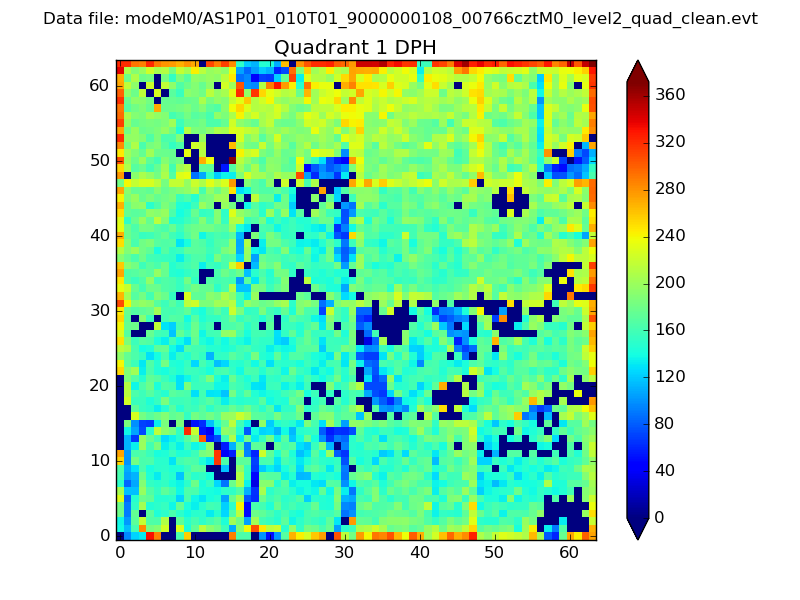 |
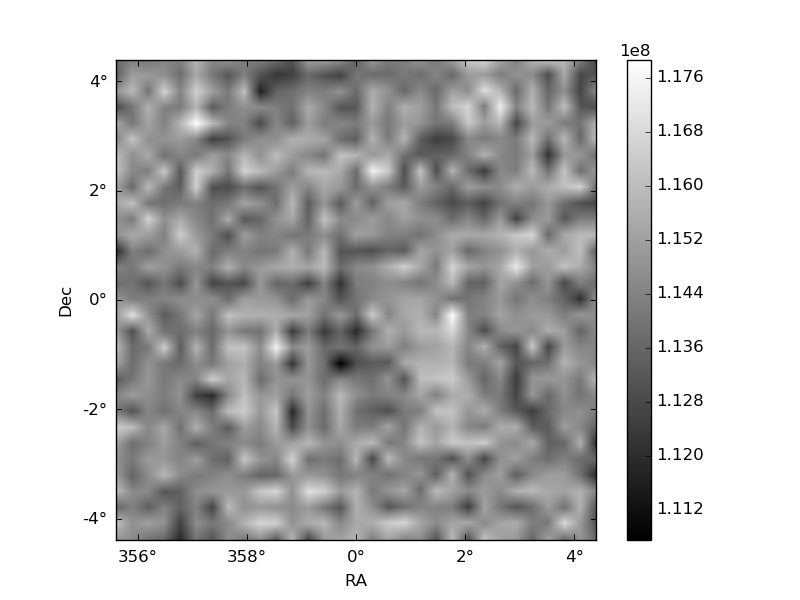
Quadrant B |
|---|---|---|---|
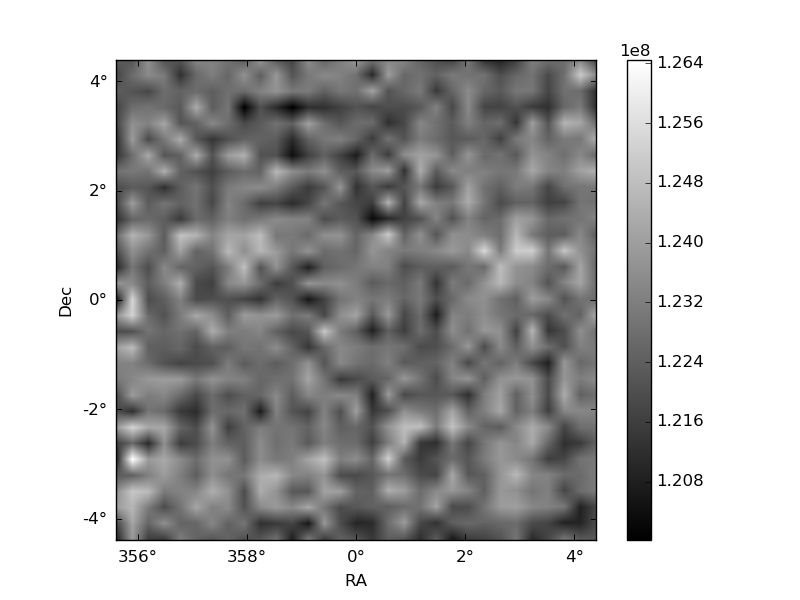
| Quadrant D | 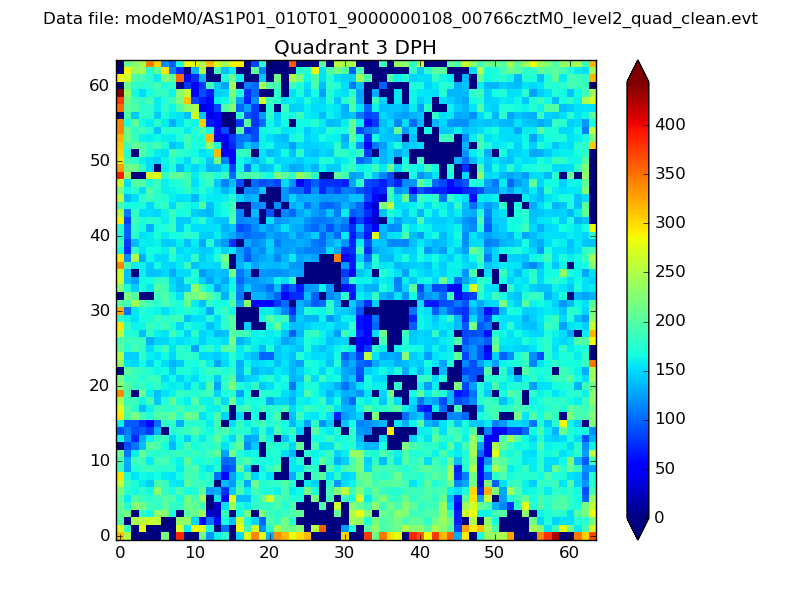 |
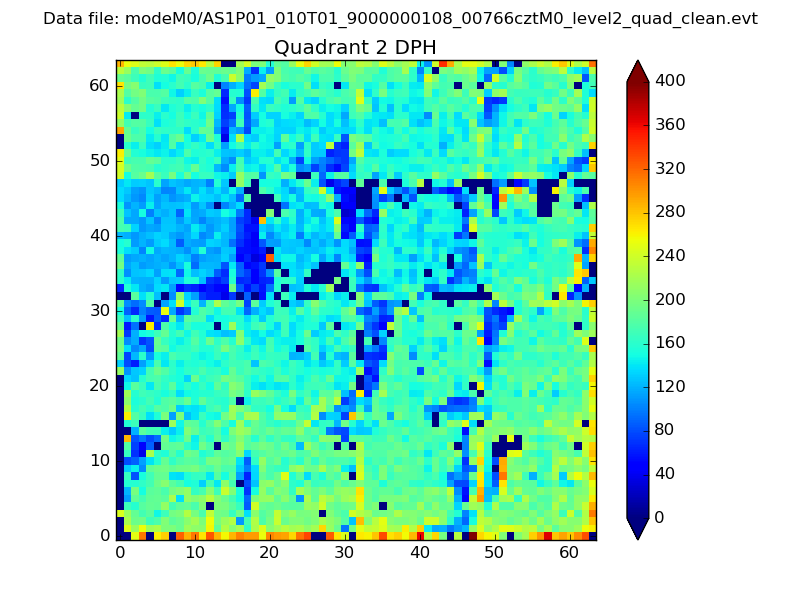 |
Quadrant C |
| Plot type | Count rate plots | Images |
|---|---|---|
| Comparison with Poisson distribution Blue bars denote a histogram of data divided into 1 sec bins. Red curve is a Poisson curve with rate = median count rate of data. |
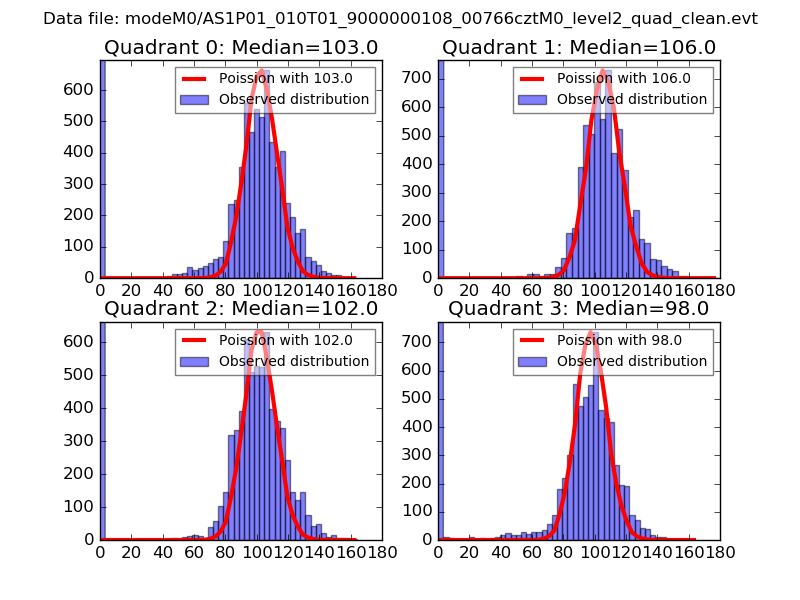 |
 |
| Quadrant-wise count rates Data is divided into 100 sec bins |
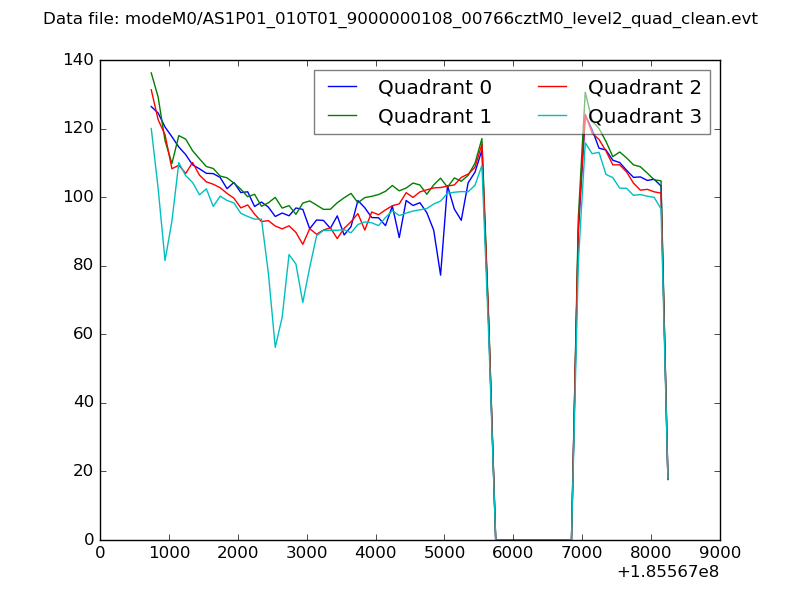 |
|
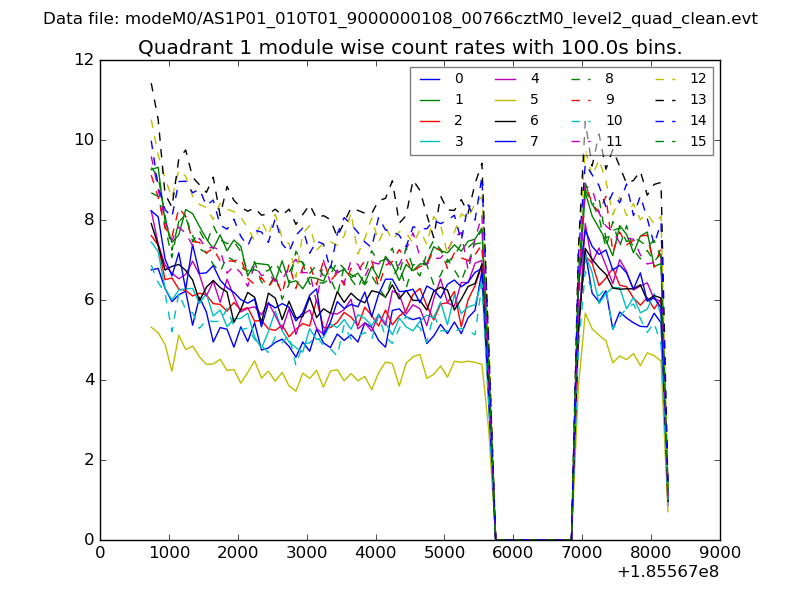
| Module-wise count rates for Quadrant A Data is divided into 100 sec bins |
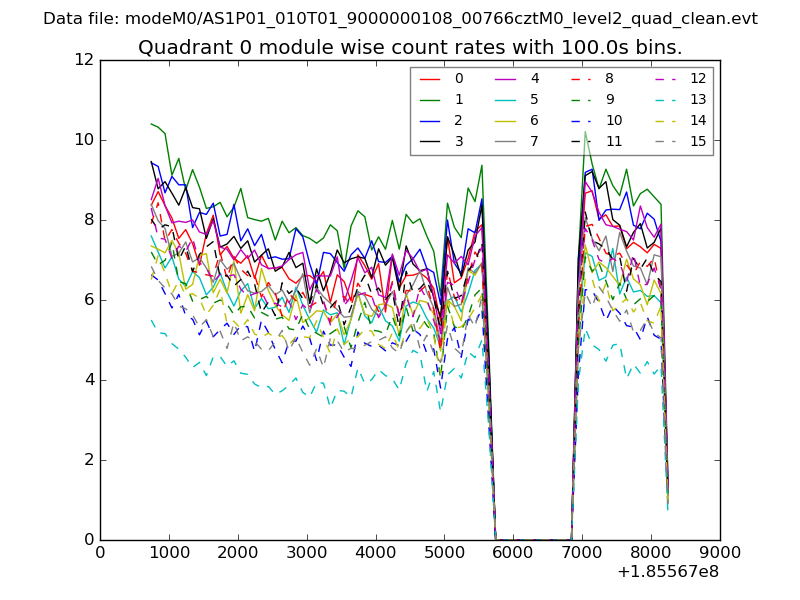 |
 |
| Module-wise count rates for Quadrant B Data is divided into 100 sec bins |
 |
 |
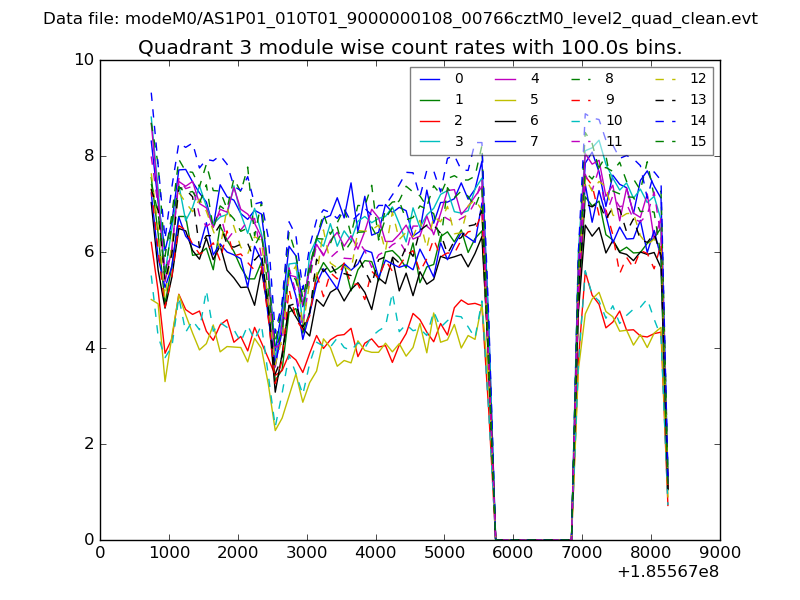
| Module-wise count rates for Quadrant C Data is divided into 100 sec bins |
 |
 |
| Module-wise count rates for Quadrant D Data is divided into 100 sec bins |
 |
 |
| Parameter | Plot |
|---|---|
| CZT HV Monitor |  |
| D_VDD | 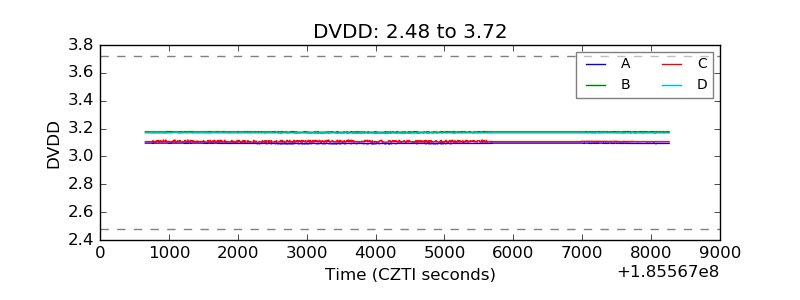 |
| Temperature 1 | 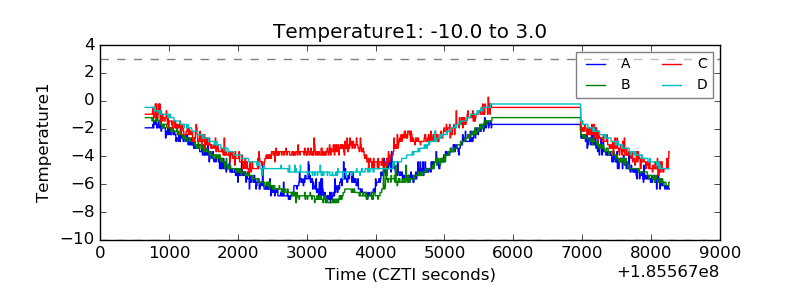 |
| Veto HV Monitor | 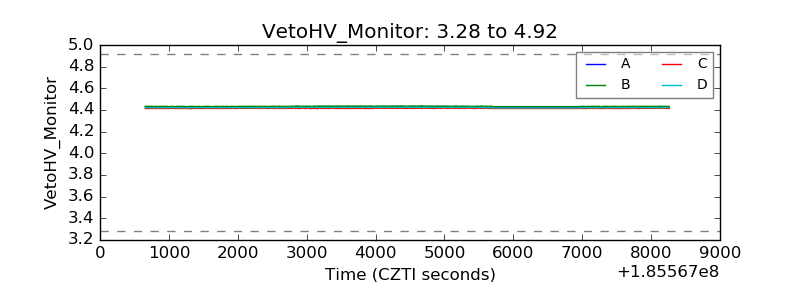 |
| Veto LLD | 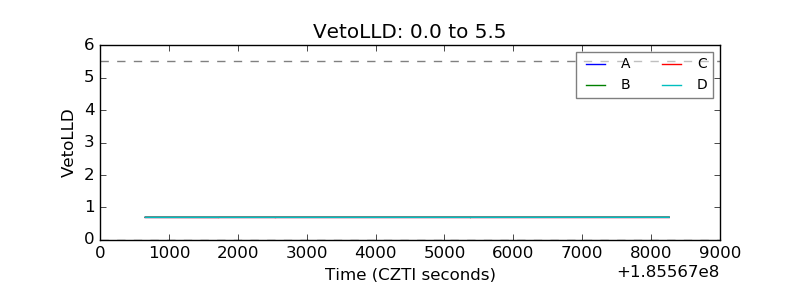 |
| Alpha Counter | 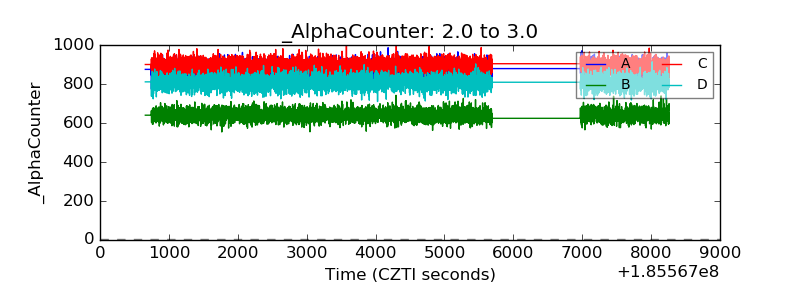 |
| _CPM_Rate | 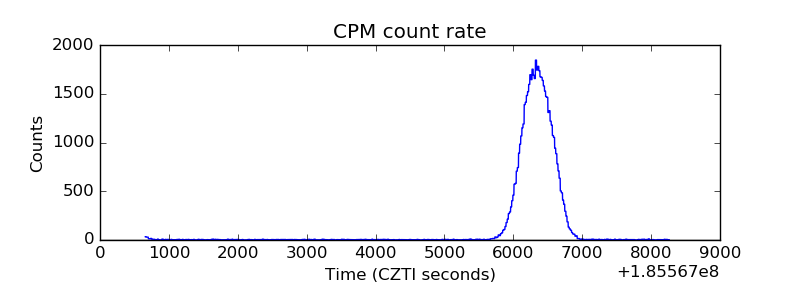 |
| CZT Counter | 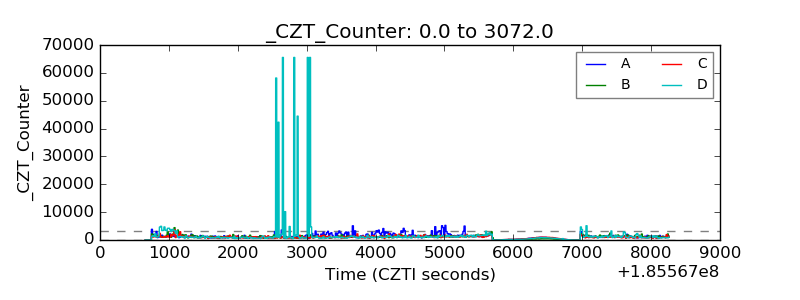 |
| +2.5 Volts monitor |  |
| +5 Volts monitor |  |
| _ROLL_ROT | 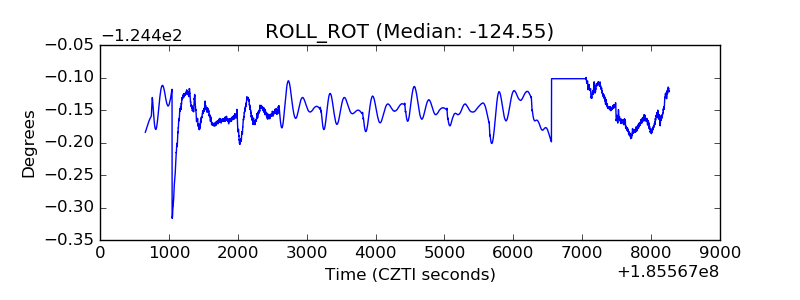 |
| _Roll_DEC | 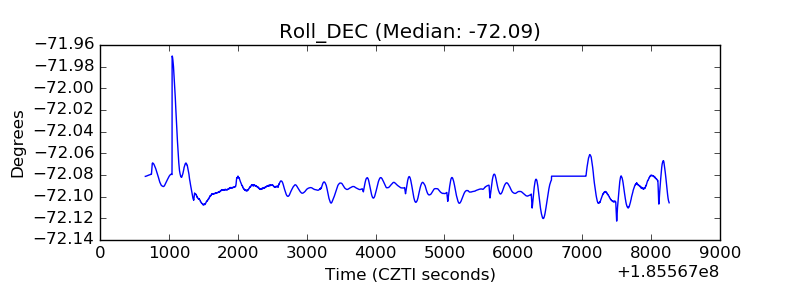 |
| _Roll_RA | 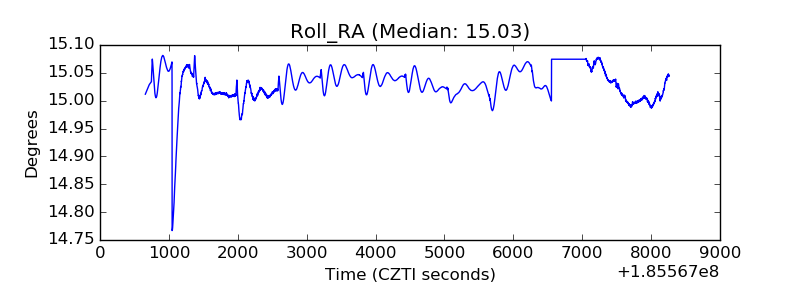 |
| Veto Counter | 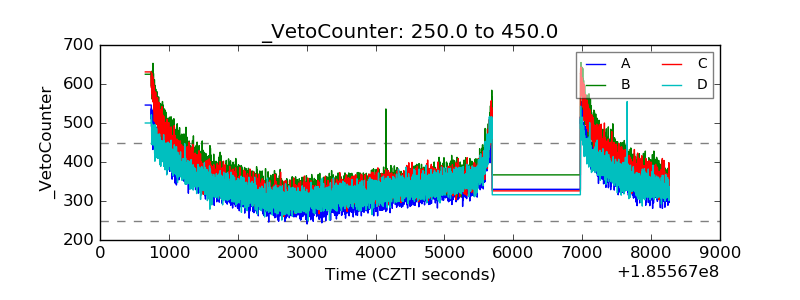 |