| Param | Original file | Final file |
|---|---|---|
| Filename | modeM0/AS1P01_010T01_9000000108_00767cztM0_level2.evt | modeM0/AS1P01_010T01_9000000108_00767cztM0_level2_quad_clean.evt |
| Size (bytes) | 998,827,200 | 97,248,960 |
| Size | 952.6 MB | 92.7 MB |
| Events in quadrant A | 8,368,089 | 630,192 |
| Events in quadrant B | 7,701,225 | 651,227 |
| Events in quadrant C | 6,993,147 | 627,109 |
| Events in quadrant D | 6,778,855 | 607,008 |
| Mode SS | |||
|---|---|---|---|
| Quadrant | BADHDUFLAG | Total packets | Discarded packets |
| A | 0 | 124 | 0 |
| B | 0 | 124 | 0 |
| C | 0 | 126 | 0 |
| D | 0 | 126 | 0 |
| Mode M0 | |||
|---|---|---|---|
| Quadrant | BADHDUFLAG | Total packets | Discarded packets |
| A | 0 | 29246 | 0 |
| B | 0 | 27228 | 0 |
| C | 0 | 25143 | 0 |
| D | 0 | 24496 | 0 |
| Mode M9 | |||
|---|---|---|---|
| Quadrant | BADHDUFLAG | Total packets | Discarded packets |
| A | 0 | 13 | 0 |
| B | 0 | 13 | 0 |
| C | 0 | 13 | 0 |
| D | 0 | 13 | 0 |
| Quadrant | Total seconds | Saturated seconds | Saturation percentage |
|---|---|---|---|
| A | 6156 | 122 | 1.981806% |
| B | 6156 | 20 | 0.324886% |
| C | 6155 | 4 | 0.064988% |
| D | 6156 | 22 | 0.357375% |
Noise dominated data is calculated using 1-second bins in cleaned event files. If a bin has >2000 counts, and if more than 50% of those come from <1% of pixels, then it is considered to be noise-dominated and hence unusable.
| Quadrant | # 1 sec bins | Bins with >0 counts | Bins with >2000 counts | High rate bins dominated by noise | Noise dominated (total time) | Noise dominated (detector-on time) | Marked lightcurve |
|---|---|---|---|---|---|---|---|
| A | 7466 | 6157 | 649 | 649 | 8.69% | 10.54% | 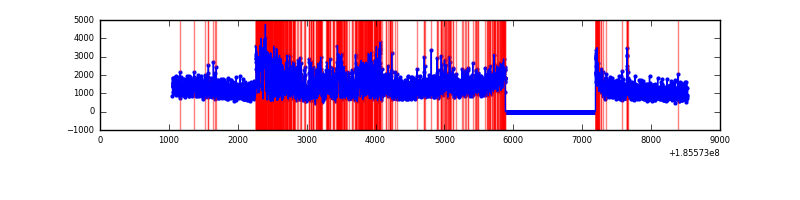 |
| B | 7466 | 6157 | 271 | 271 | 3.63% | 4.40% | 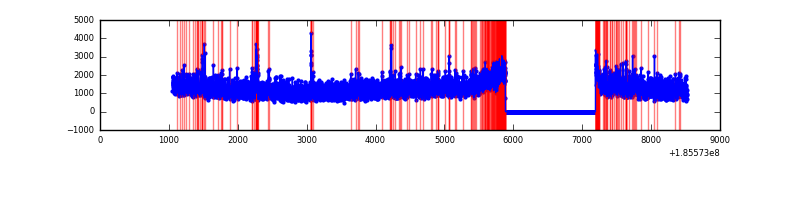 |
| C | 7465 | 6156 | 86 | 86 | 1.15% | 1.40% | 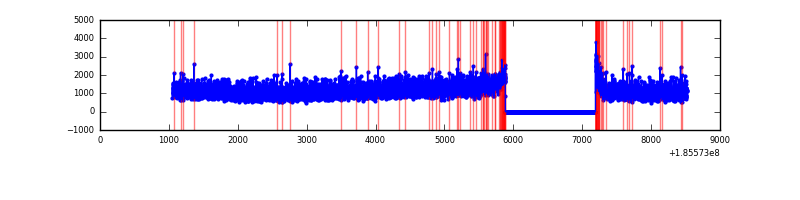 |
| D | 7466 | 6157 | 119 | 119 | 1.59% | 1.93% | 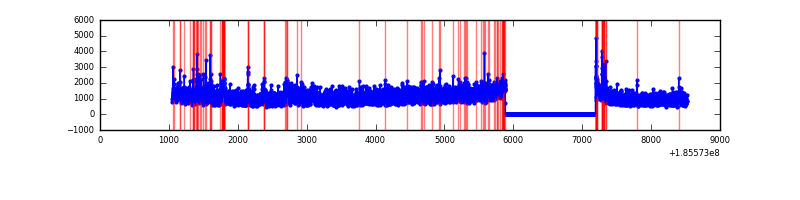 |
Top three noisy pixels from each quadrant. If the there are fewer than three noisy pixels in the level2.evt file, extra rows are filled as -1
| Pixel properties | Quadrant properties | ||||||
|---|---|---|---|---|---|---|---|
| Quadrant | DetID | PixID | Counts | Sigma | Mean | Median | Sigma |
| A | 0 | 117 | 1252265 | 2878.71 | 1805 | 1815 | 434.4 |
| A | 15 | 249 | 87653 | 197.61 | 1805 | 1815 | 434.4 |
| A | 15 | 233 | 37840 | 82.93 | 1805 | 1815 | 434.4 |
| B | 7 | 221 | 165889 | 368.42 | 1923 | 1931 | 445.0 |
| B | 5 | 191 | 71515 | 156.36 | 1923 | 1931 | 445.0 |
| B | 0 | 220 | 70826 | 154.81 | 1923 | 1931 | 445.0 |
| C | 9 | 83 | 106027 | 216.45 | 1738 | 1793 | 481.6 |
| C | 15 | 241 | 33024 | 64.85 | 1738 | 1793 | 481.6 |
| C | 3 | 111 | 24922 | 48.03 | 1738 | 1793 | 481.6 |
| D | 10 | 85 | 375921 | 735.42 | 1652 | 1711 | 508.8 |
| D | 1 | 4 | 63736 | 121.9 | 1652 | 1711 | 508.8 |
| D | 12 | 188 | 49859 | 94.62 | 1652 | 1711 | 508.8 |
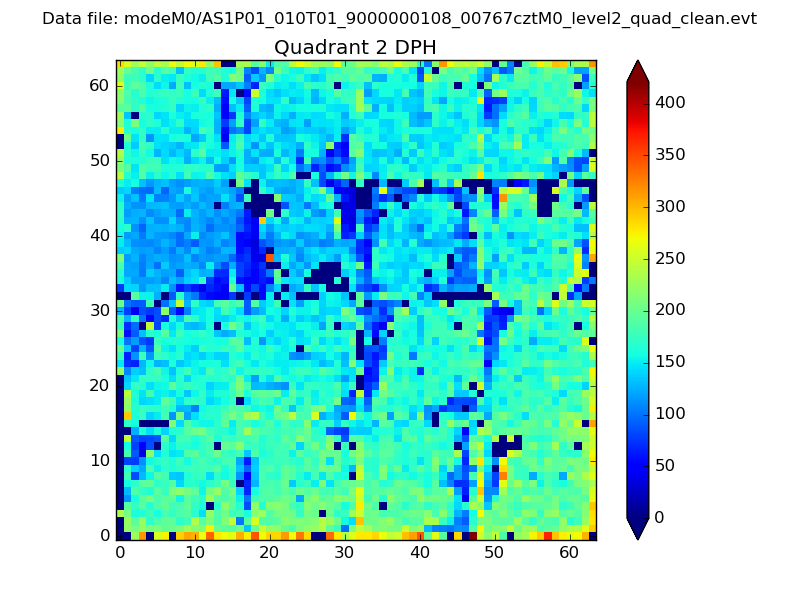
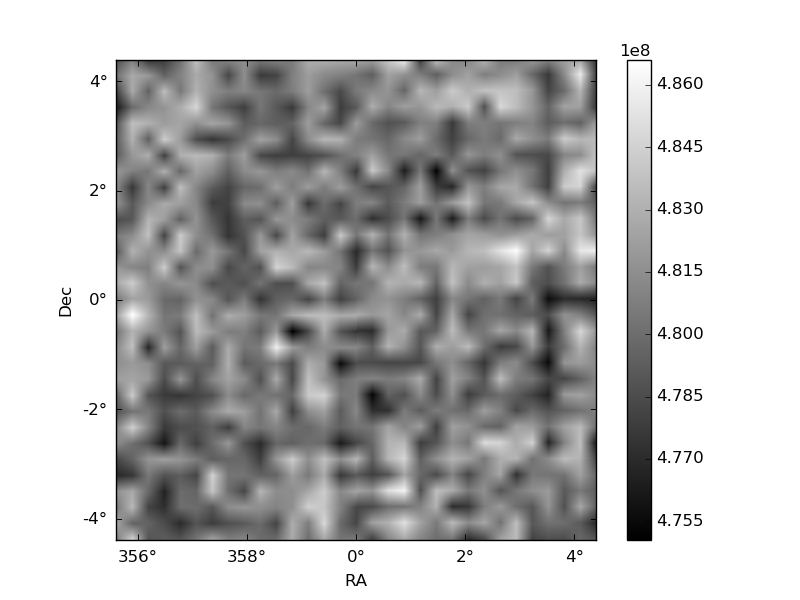
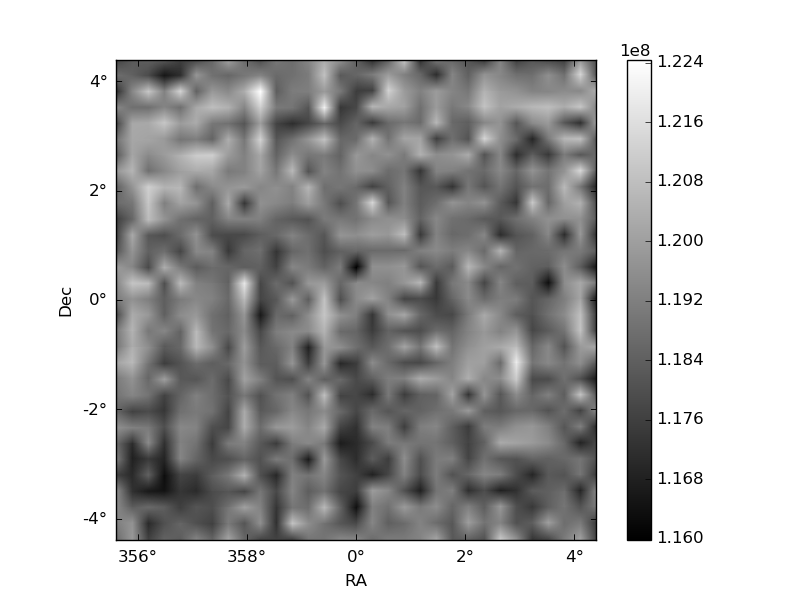
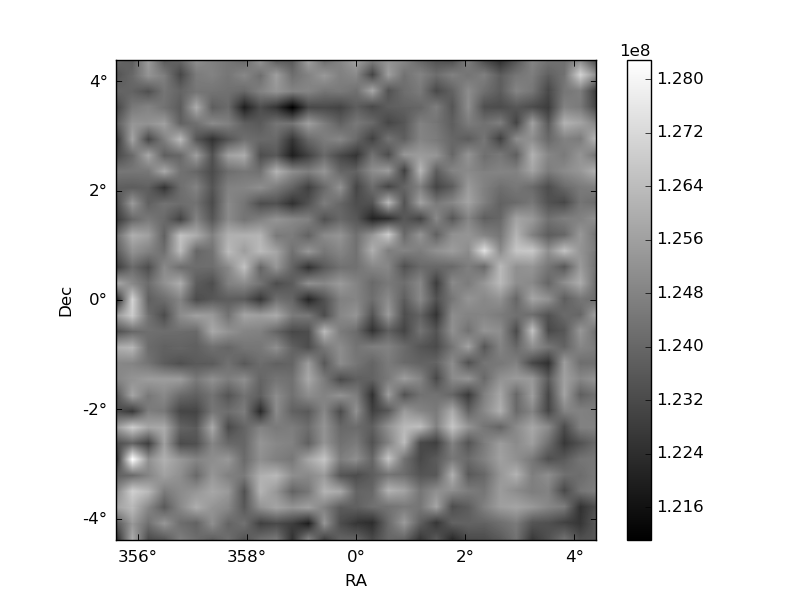
Histogram calculated using DETX and DETY for each event in the final _common_clean file
| Quadrant A | 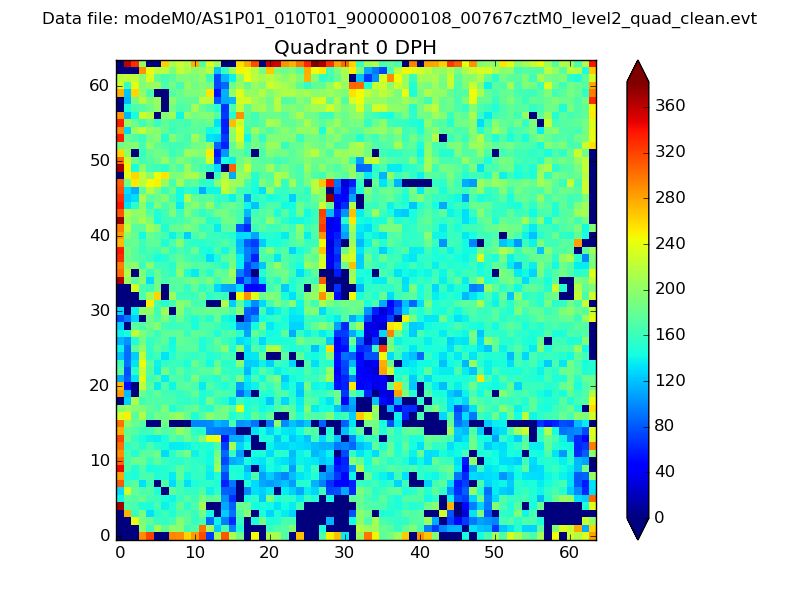 |
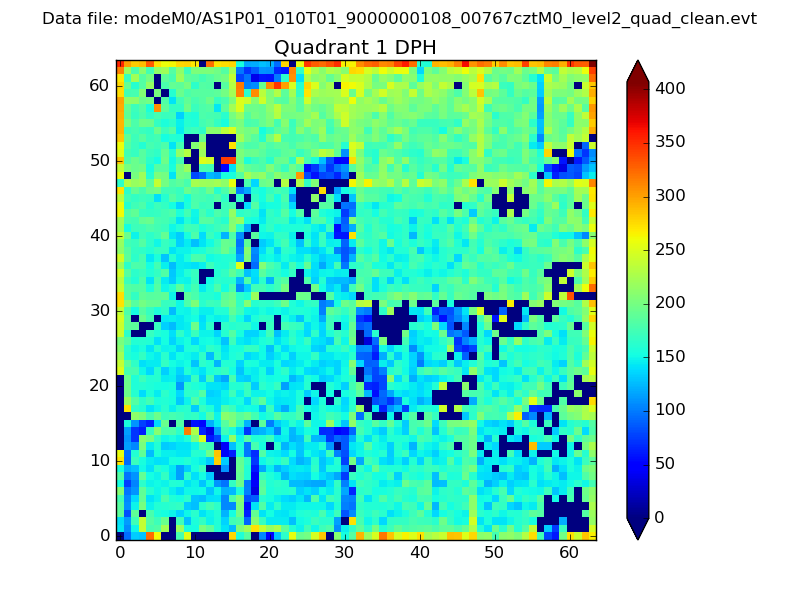 |
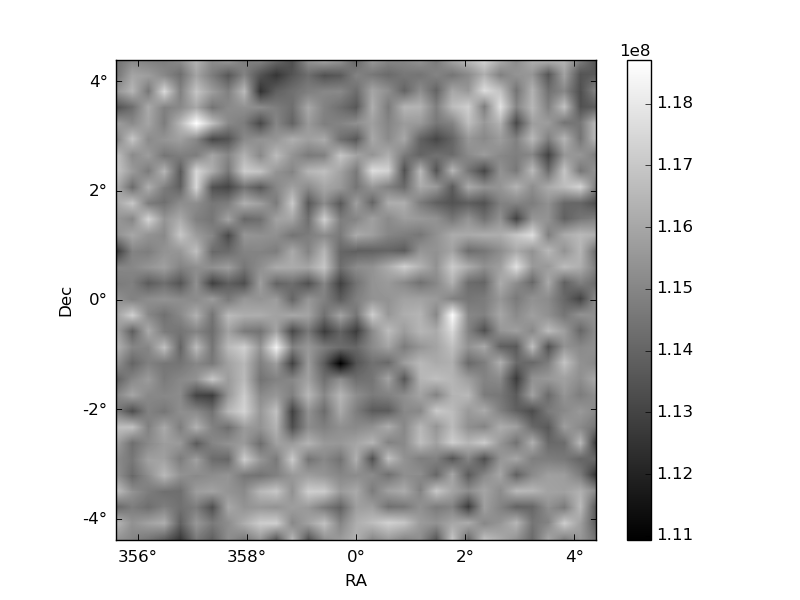
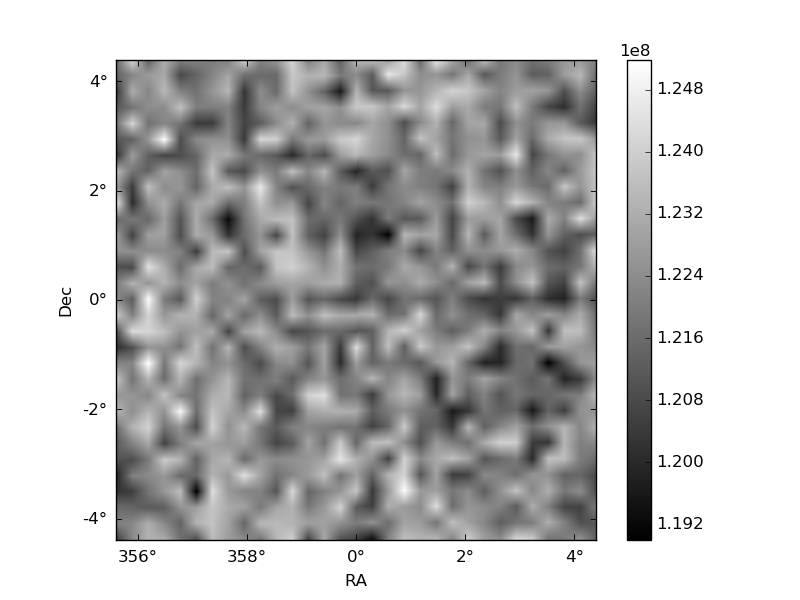
Quadrant B |
|---|---|---|---|
| Quadrant D | 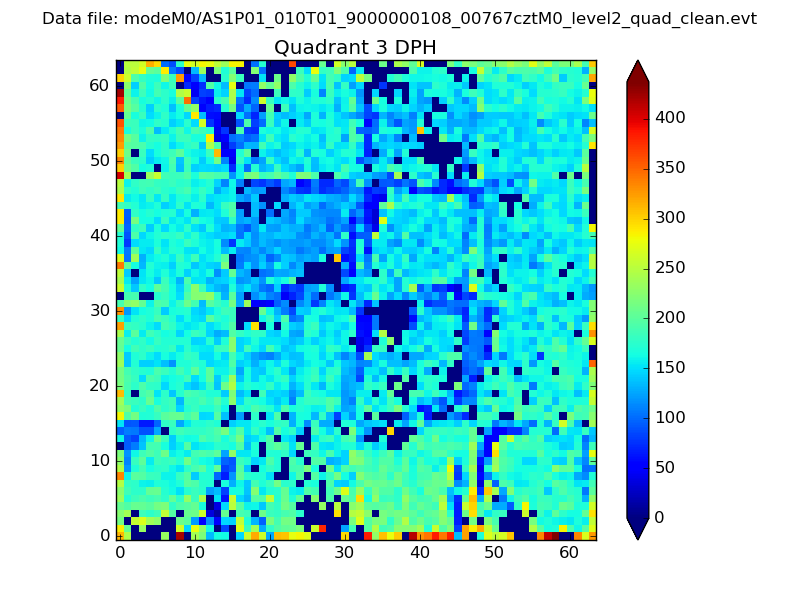 |
 |
Quadrant C |
| Plot type | Count rate plots | Images |
|---|---|---|
| Comparison with Poisson distribution Blue bars denote a histogram of data divided into 1 sec bins. Red curve is a Poisson curve with rate = median count rate of data. |
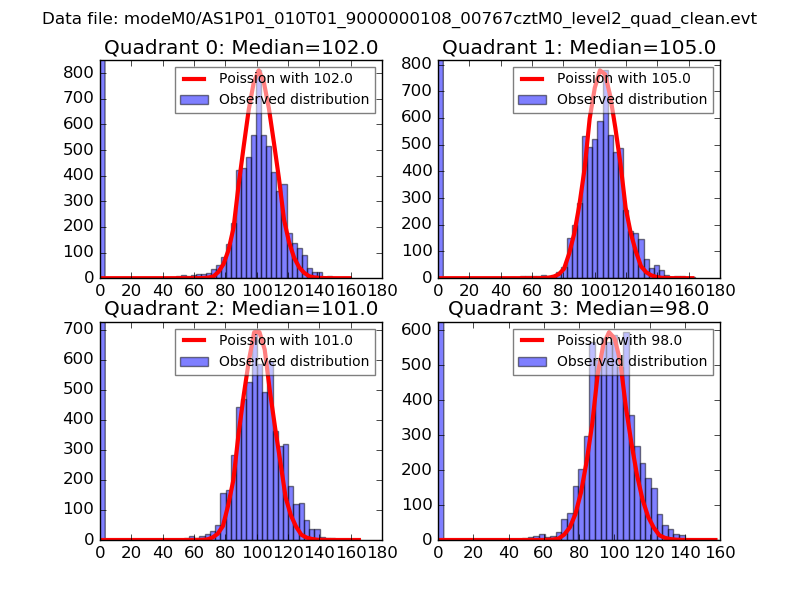 |
 |
| Quadrant-wise count rates Data is divided into 100 sec bins |
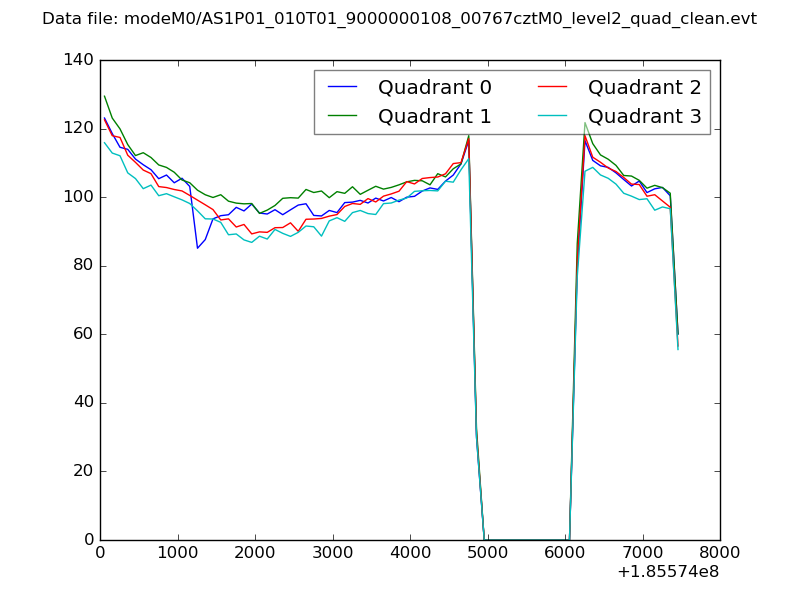 |
|
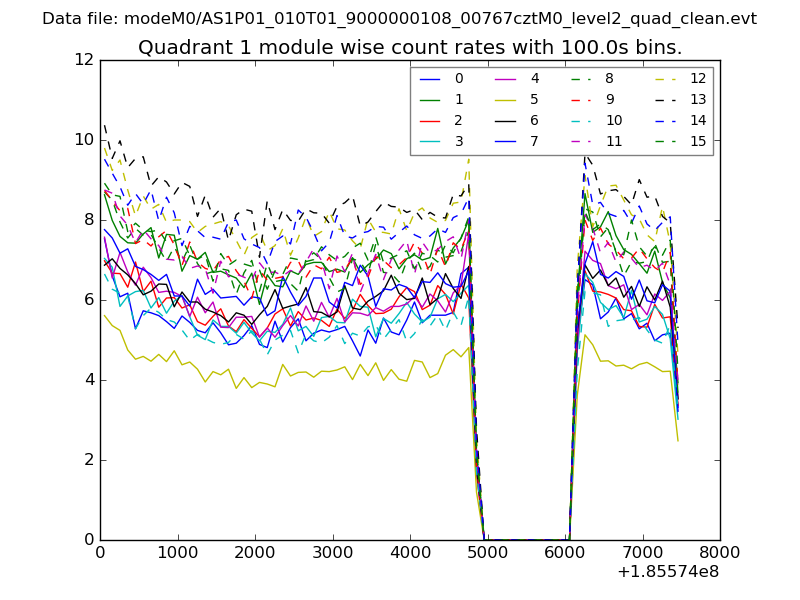
| Module-wise count rates for Quadrant A Data is divided into 100 sec bins |
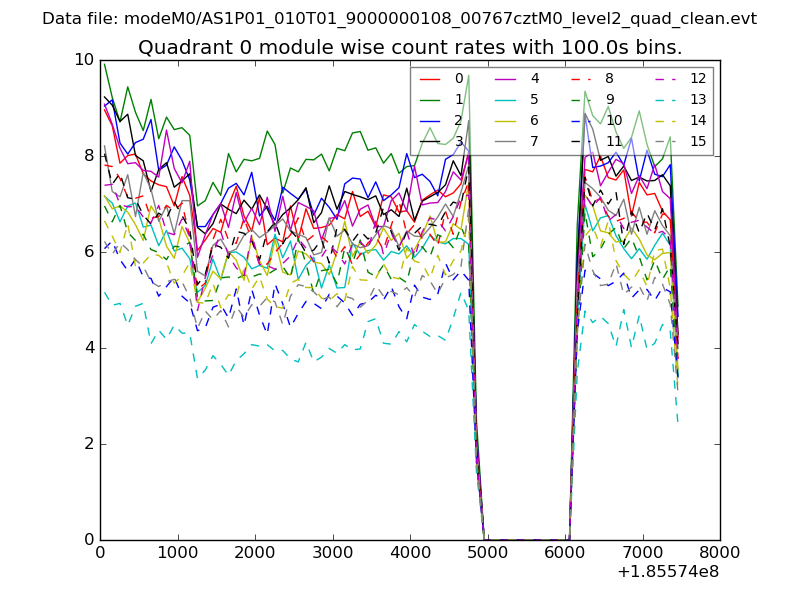 |
 |
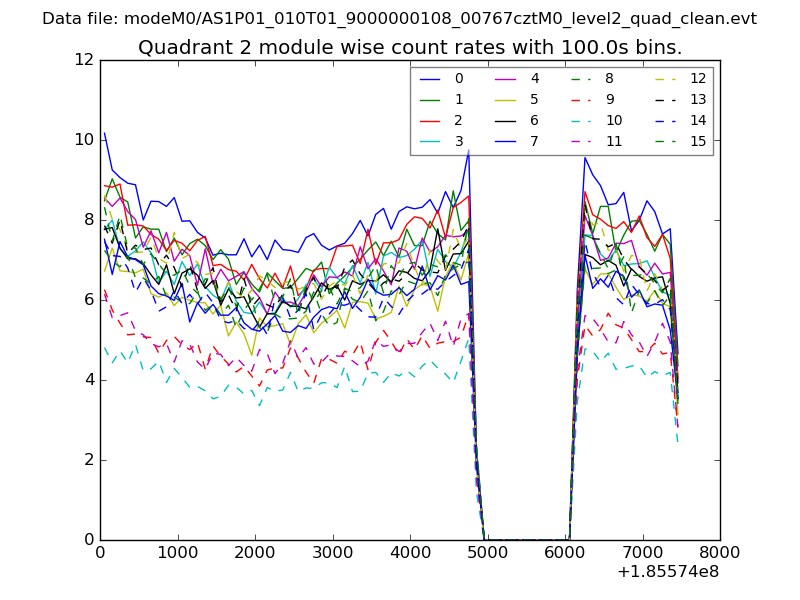
| Module-wise count rates for Quadrant B Data is divided into 100 sec bins |
 |
 |
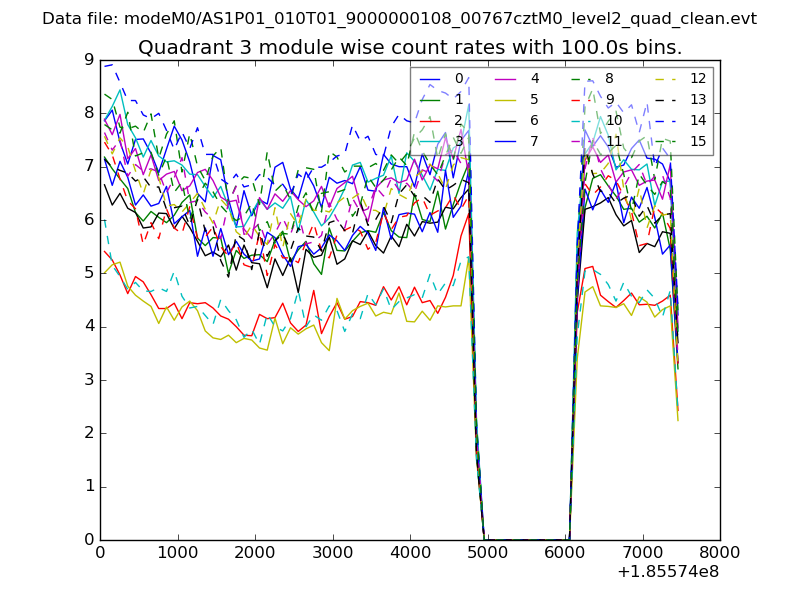
| Module-wise count rates for Quadrant C Data is divided into 100 sec bins |
 |
 |
| Module-wise count rates for Quadrant D Data is divided into 100 sec bins |
 |
 |
| Parameter | Plot |
|---|---|
| CZT HV Monitor | 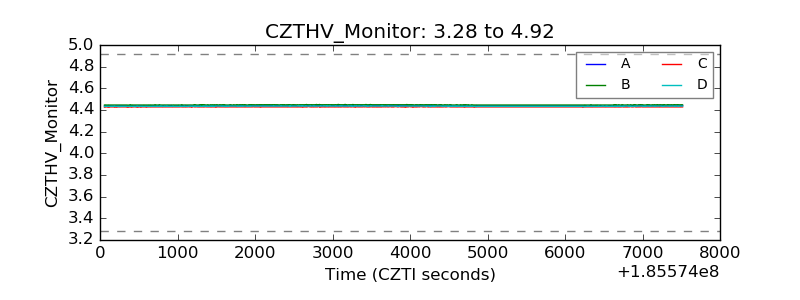 |
| D_VDD | 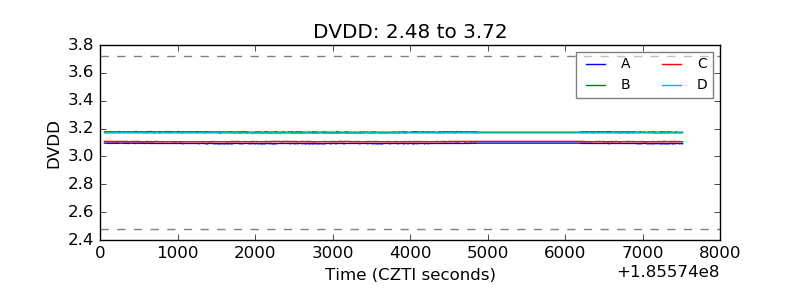 |
| Temperature 1 | 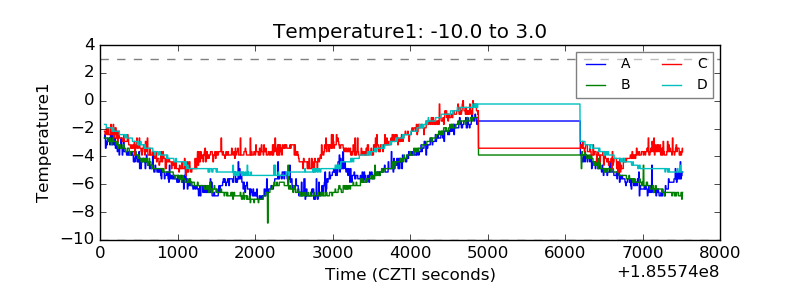 |
| Veto HV Monitor | 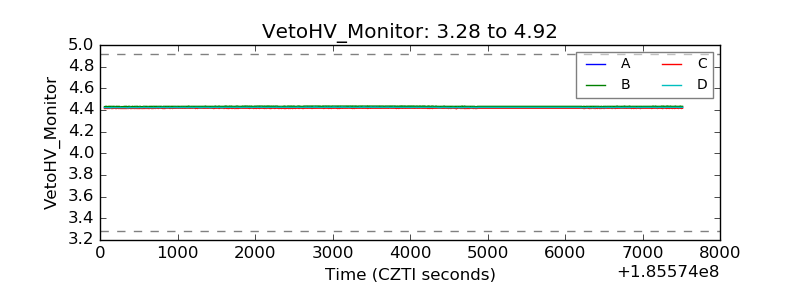 |
| Veto LLD | 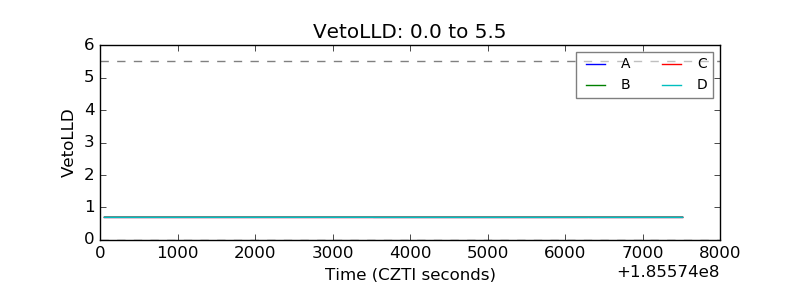 |
| Alpha Counter | 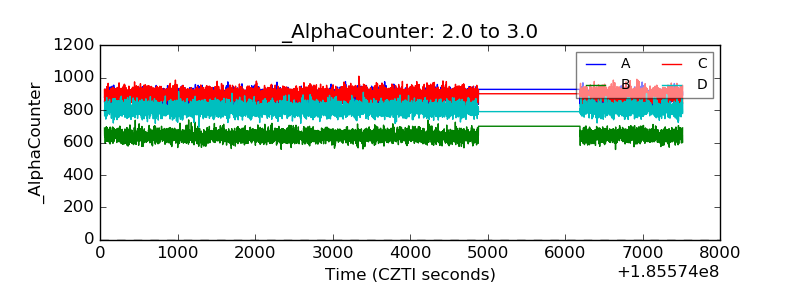 |
| _CPM_Rate | 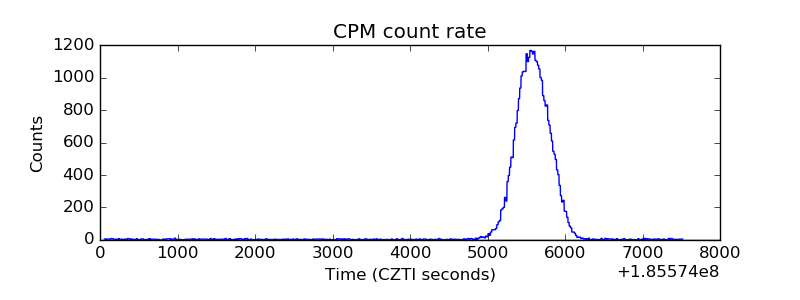 |
| CZT Counter | 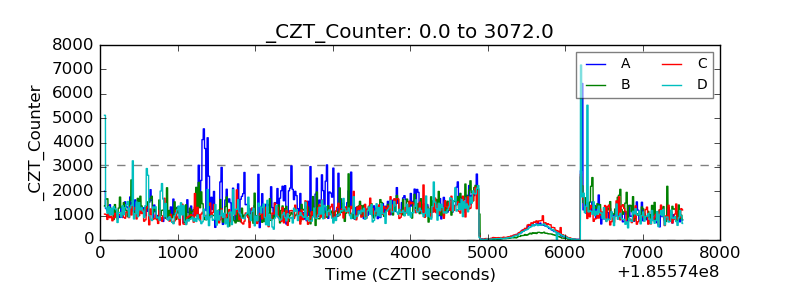 |
| +2.5 Volts monitor |  |
| +5 Volts monitor |  |
| _ROLL_ROT | 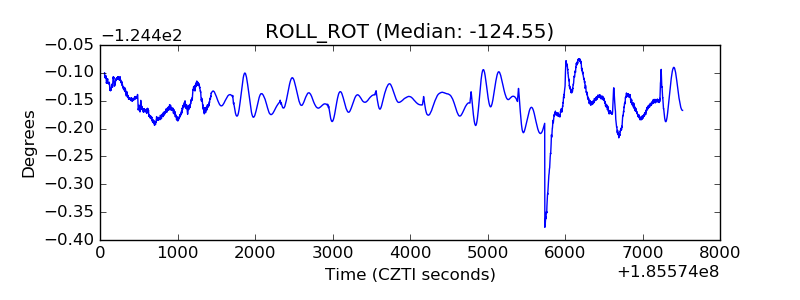 |
| _Roll_DEC | 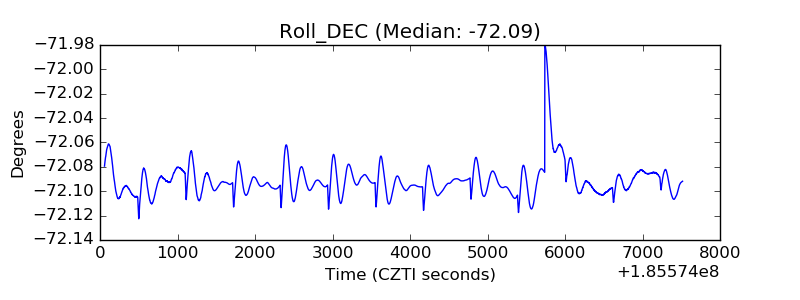 |
| _Roll_RA | 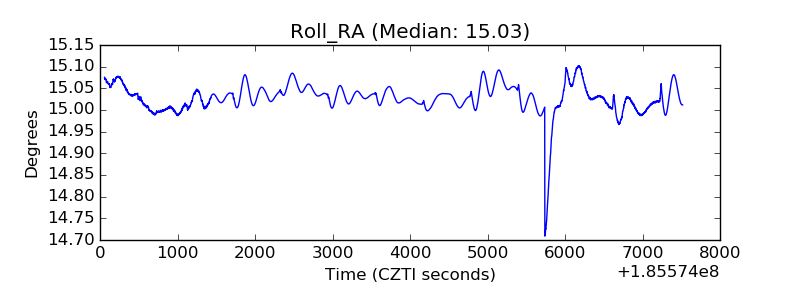 |
| Veto Counter | 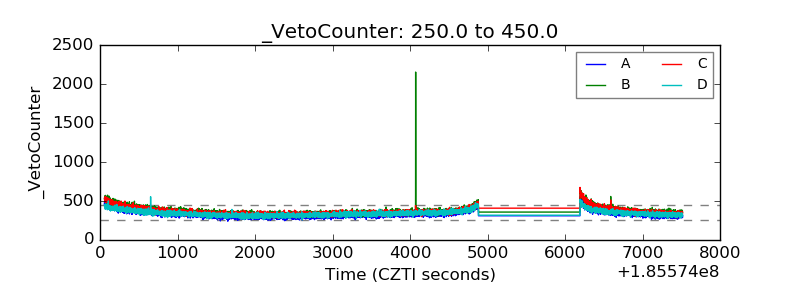 |