| Param | Original file | Final file |
|---|---|---|
| Filename | modeM0/AS1P01_010T01_9000000108_00768cztM0_level2.evt | modeM0/AS1P01_010T01_9000000108_00768cztM0_level2_quad_clean.evt |
| Size (bytes) | 1,049,256,000 | 104,500,800 |
| Size | 1000.6 MB | 99.7 MB |
| Events in quadrant A | 7,853,069 | 680,806 |
| Events in quadrant B | 8,411,410 | 694,415 |
| Events in quadrant C | 7,858,743 | 667,054 |
| Events in quadrant D | 7,206,030 | 652,725 |
| Mode SS | |||
|---|---|---|---|
| Quadrant | BADHDUFLAG | Total packets | Discarded packets |
| A | 0 | 138 | 0 |
| B | 0 | 138 | 0 |
| C | 0 | 138 | 0 |
| D | 0 | 138 | 0 |
| Mode M0 | |||
|---|---|---|---|
| Quadrant | BADHDUFLAG | Total packets | Discarded packets |
| A | 0 | 28111 | 0 |
| B | 0 | 29767 | 0 |
| C | 0 | 28143 | 0 |
| D | 0 | 26183 | 0 |
| Mode M9 | |||
|---|---|---|---|
| Quadrant | BADHDUFLAG | Total packets | Discarded packets |
| A | 0 | 15 | 0 |
| B | 0 | 15 | 0 |
| C | 0 | 15 | 0 |
| D | 0 | 15 | 0 |
| Quadrant | Total seconds | Saturated seconds | Saturation percentage |
|---|---|---|---|
| A | 6738 | 19 | 0.281983% |
| B | 6738 | 19 | 0.281983% |
| C | 6738 | 56 | 0.831107% |
| D | 6738 | 25 | 0.371030% |
Noise dominated data is calculated using 1-second bins in cleaned event files. If a bin has >2000 counts, and if more than 50% of those come from <1% of pixels, then it is considered to be noise-dominated and hence unusable.
| Quadrant | # 1 sec bins | Bins with >0 counts | Bins with >2000 counts | High rate bins dominated by noise | Noise dominated (total time) | Noise dominated (detector-on time) | Marked lightcurve |
|---|---|---|---|---|---|---|---|
| A | 7898 | 6739 | 218 | 218 | 2.76% | 3.23% |  |
| B | 7898 | 6739 | 307 | 307 | 3.89% | 4.56% |  |
| C | 7898 | 6739 | 221 | 221 | 2.80% | 3.28% | 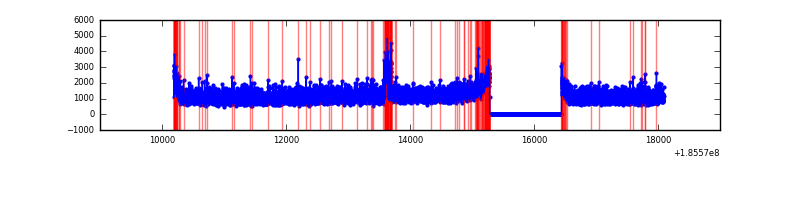 |
| D | 7898 | 6739 | 139 | 139 | 1.76% | 2.06% |  |
Top three noisy pixels from each quadrant. If the there are fewer than three noisy pixels in the level2.evt file, extra rows are filled as -1
| Pixel properties | Quadrant properties | ||||||
|---|---|---|---|---|---|---|---|
| Quadrant | DetID | PixID | Counts | Sigma | Mean | Median | Sigma |
| A | 15 | 233 | 102561 | 209.97 | 2004 | 2017 | 478.8 |
| A | 15 | 249 | 19984 | 37.52 | 2004 | 2017 | 478.8 |
| A | 13 | 17 | 19395 | 36.29 | 2004 | 2017 | 478.8 |
| B | 7 | 221 | 119461 | 235.15 | 2145 | 2148 | 498.9 |
| B | 0 | 220 | 81704 | 159.47 | 2145 | 2148 | 498.9 |
| B | 5 | 191 | 18912 | 33.6 | 2145 | 2148 | 498.9 |
| C | 10 | 17 | 166428 | 306.42 | 1938 | 2009 | 536.6 |
| C | 15 | 241 | 32917 | 57.6 | 1938 | 2009 | 536.6 |
| C | 3 | 111 | 25964 | 44.64 | 1938 | 2009 | 536.6 |
| D | 10 | 85 | 72502 | 124.29 | 1844 | 1906 | 568.0 |
| D | 1 | 4 | 67709 | 115.85 | 1844 | 1906 | 568.0 |
| D | 12 | 188 | 47542 | 80.35 | 1844 | 1906 | 568.0 |
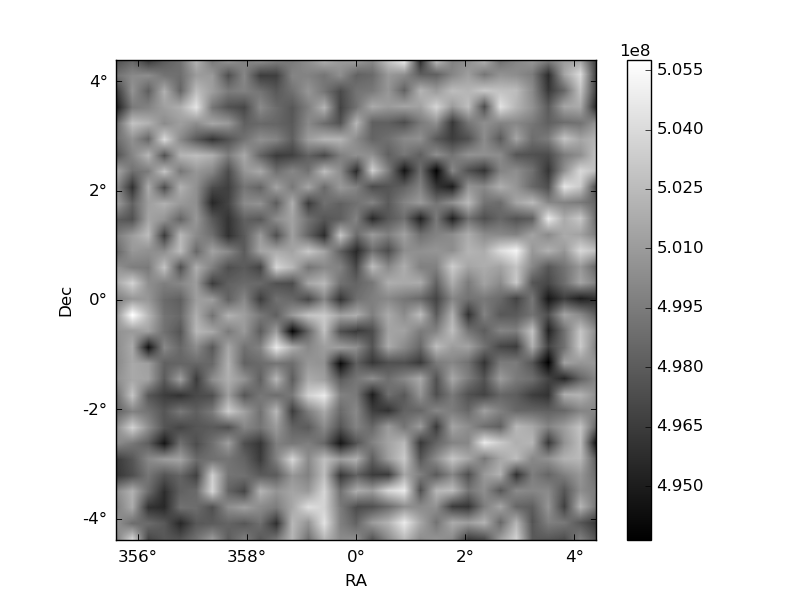
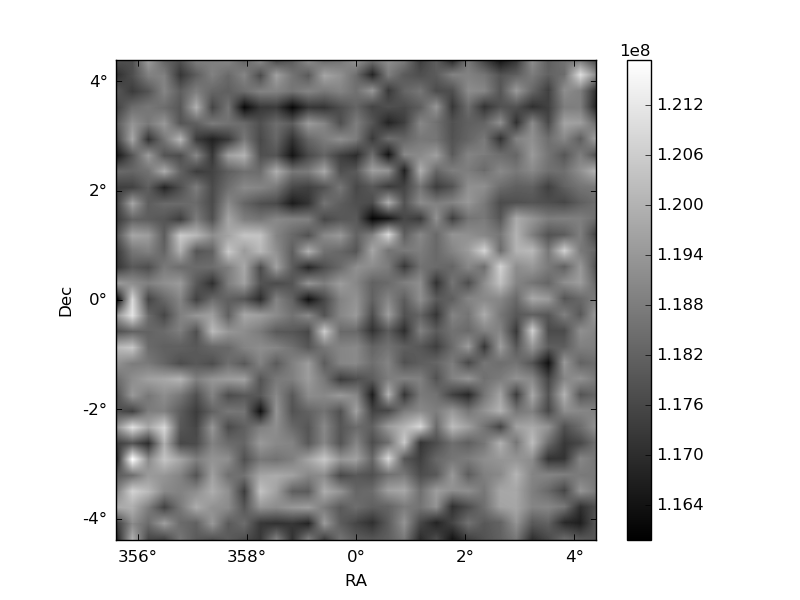
Histogram calculated using DETX and DETY for each event in the final _common_clean file
| Quadrant A | 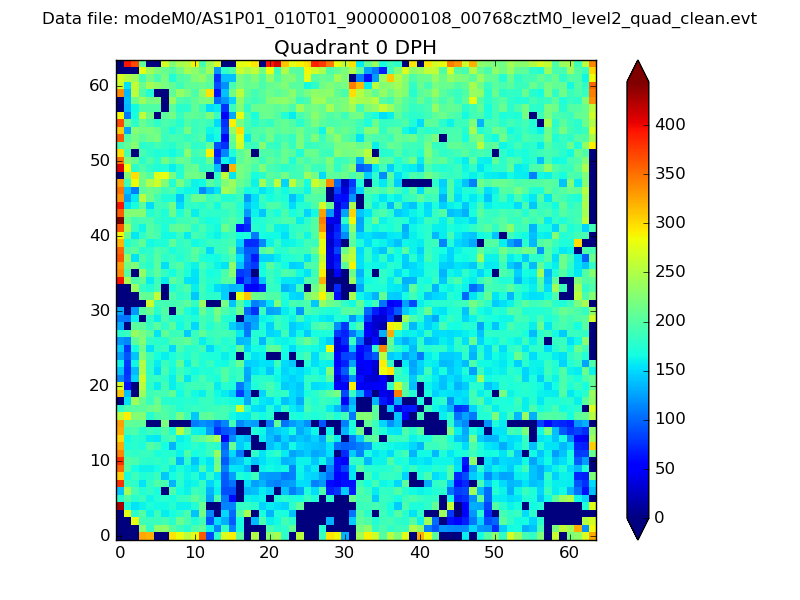 |
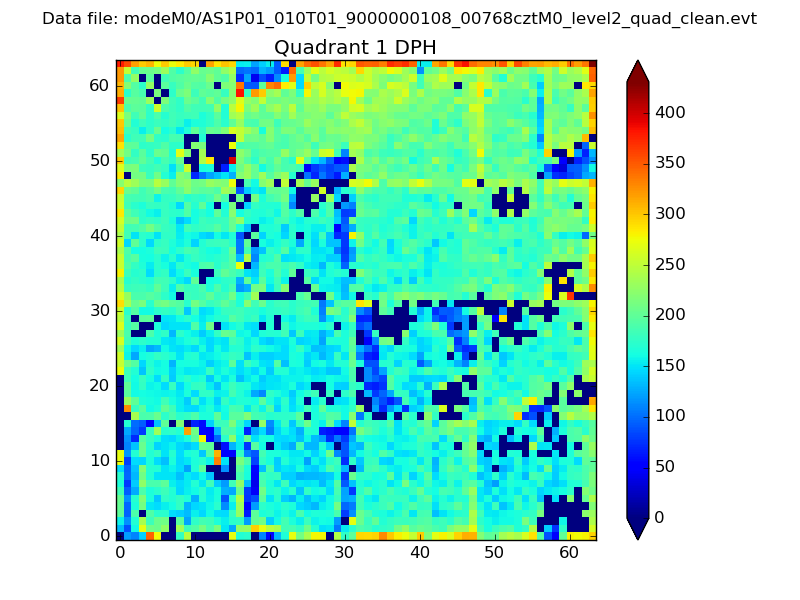 |
Quadrant B |
|---|---|---|---|
| Quadrant D | 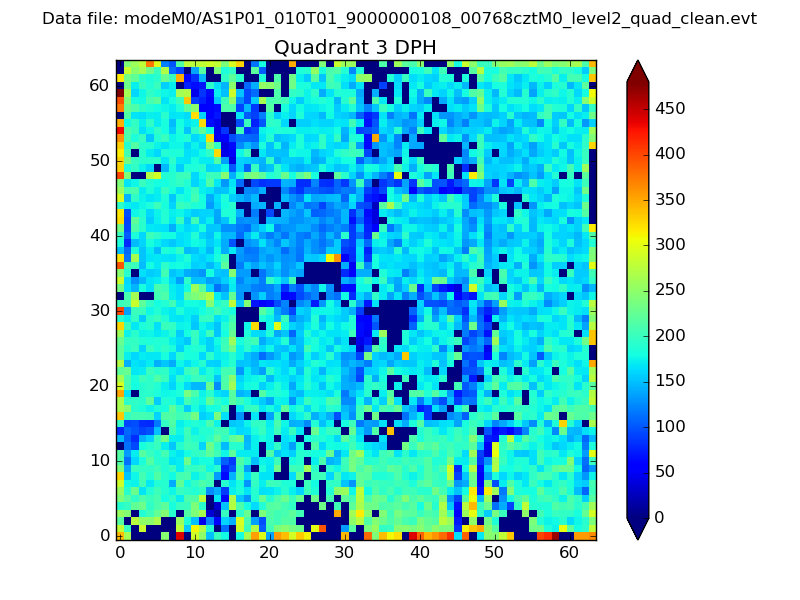 |
 |
Quadrant C |
| Plot type | Count rate plots | Images |
|---|---|---|
| Comparison with Poisson distribution Blue bars denote a histogram of data divided into 1 sec bins. Red curve is a Poisson curve with rate = median count rate of data. |
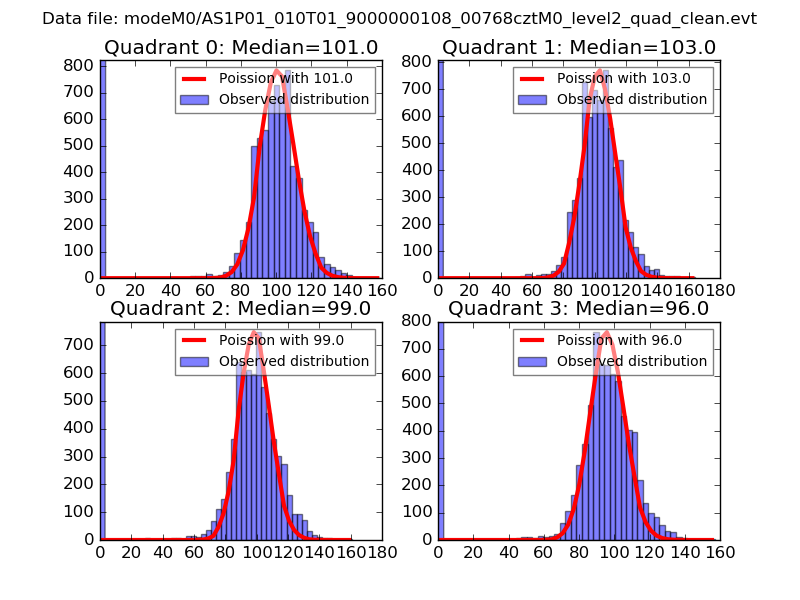 |
 |
| Quadrant-wise count rates Data is divided into 100 sec bins |
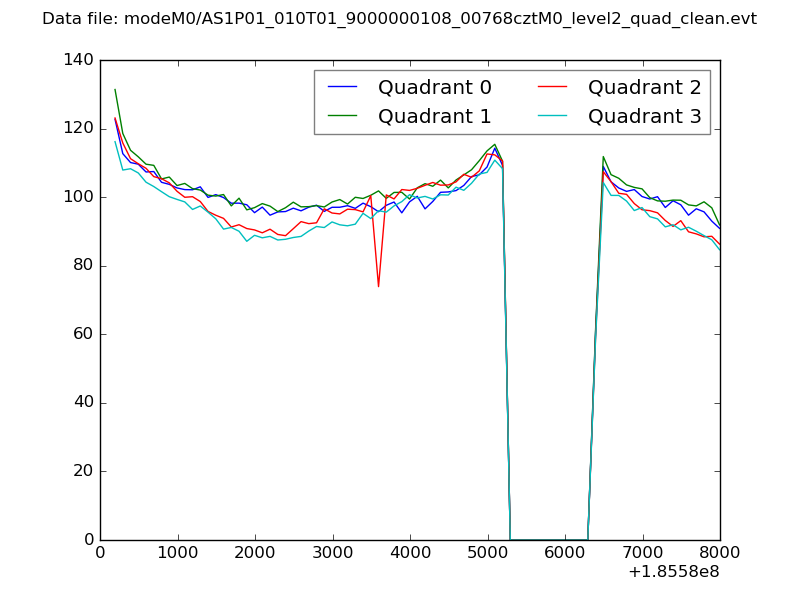 |
|
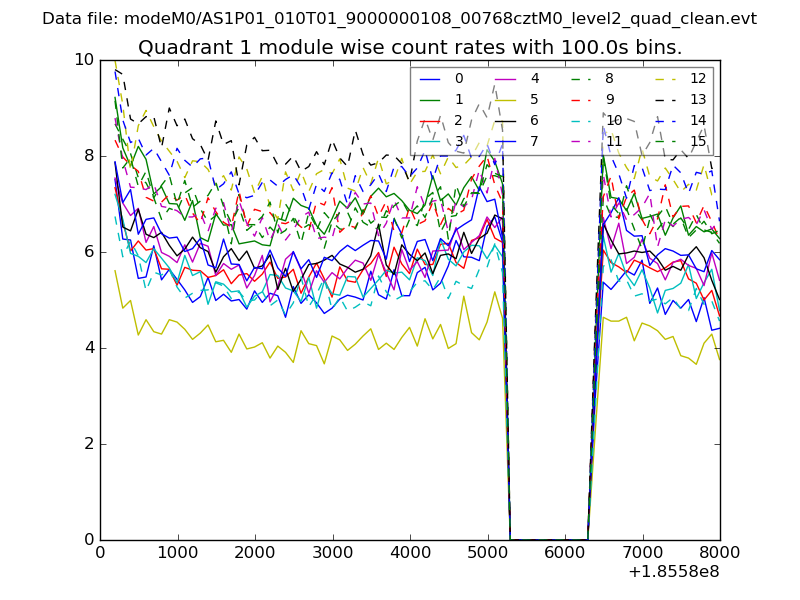
| Module-wise count rates for Quadrant A Data is divided into 100 sec bins |
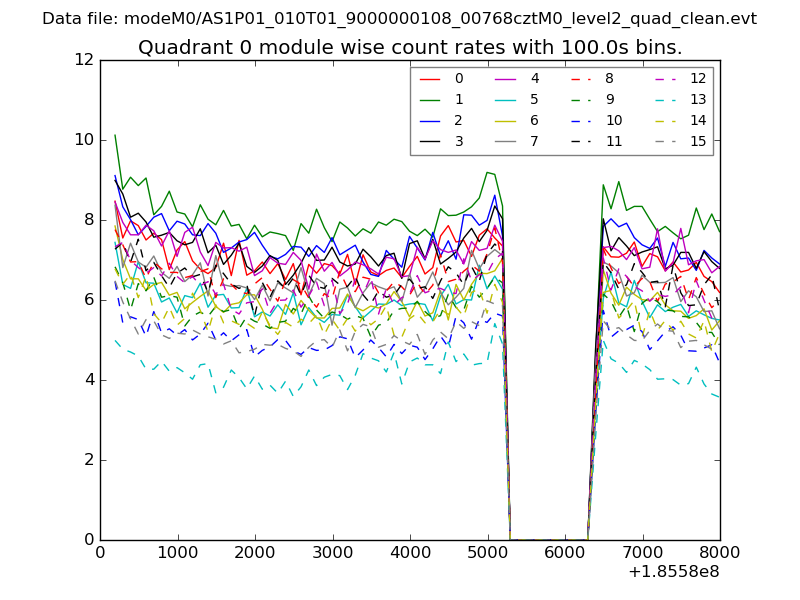 |
 |
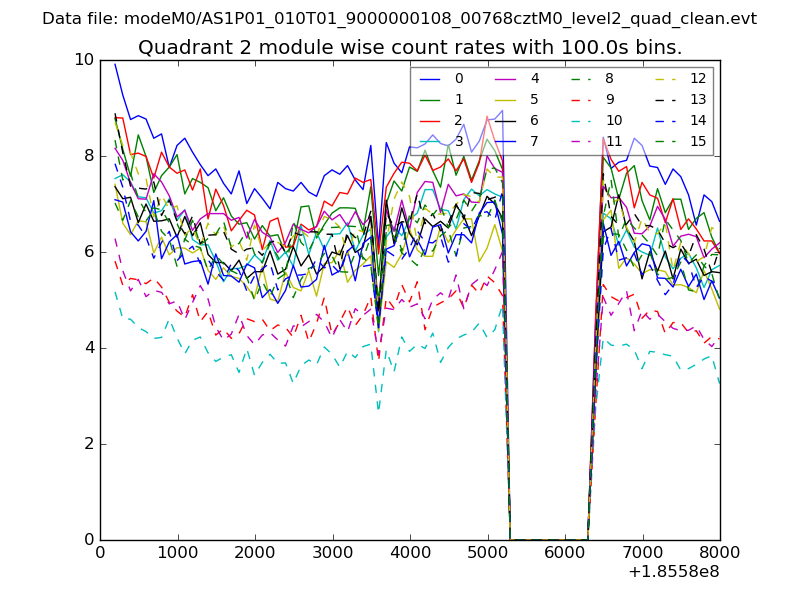
| Module-wise count rates for Quadrant B Data is divided into 100 sec bins |
 |
 |
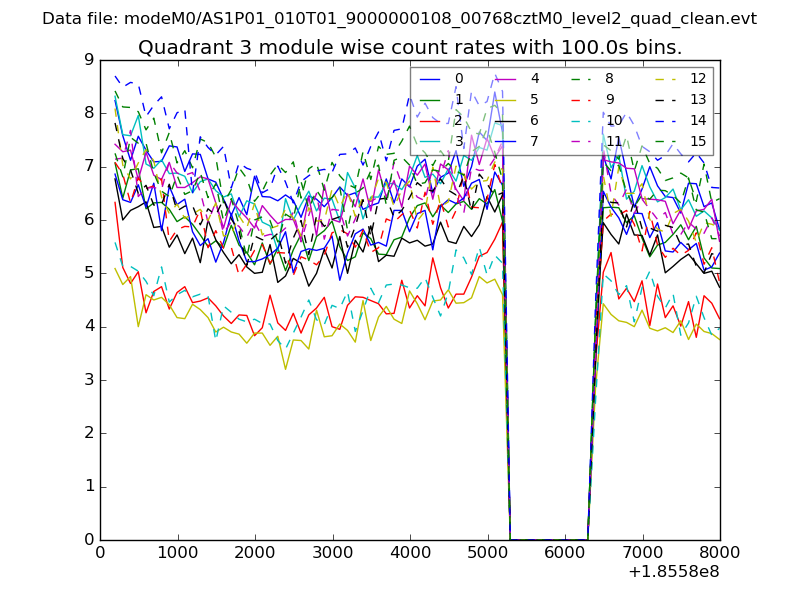
| Module-wise count rates for Quadrant C Data is divided into 100 sec bins |
 |
 |
| Module-wise count rates for Quadrant D Data is divided into 100 sec bins |
 |
 |
| Parameter | Plot |
|---|---|
| CZT HV Monitor | 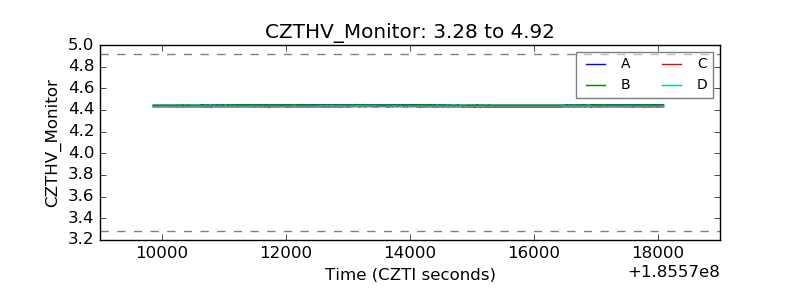 |
| D_VDD | 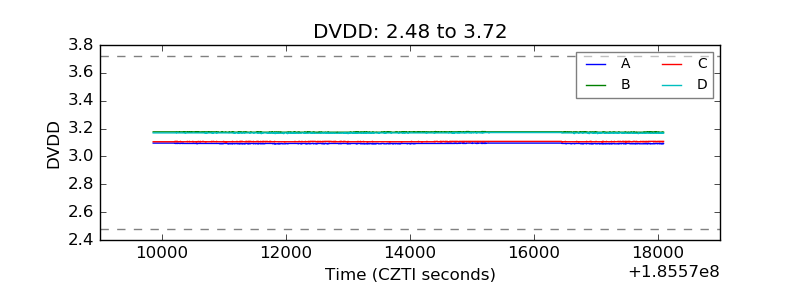 |
| Temperature 1 | 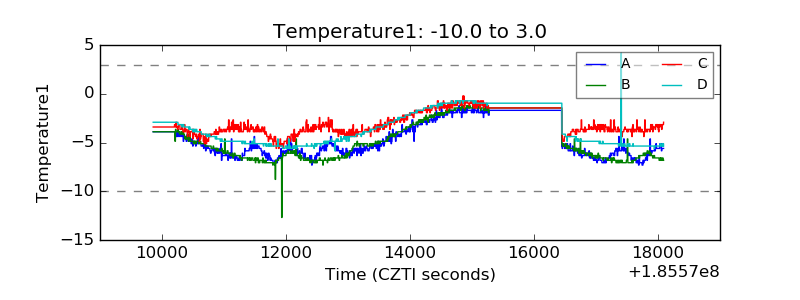 |
| Veto HV Monitor | 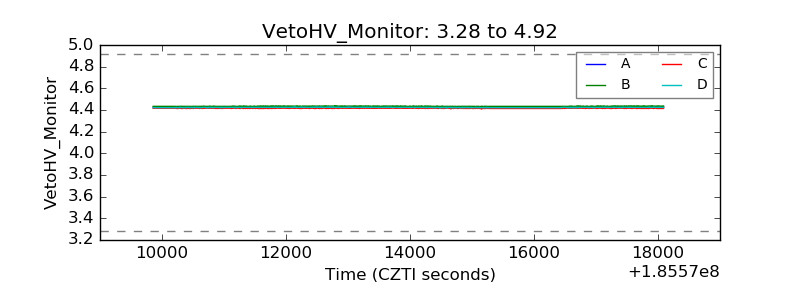 |
| Veto LLD | 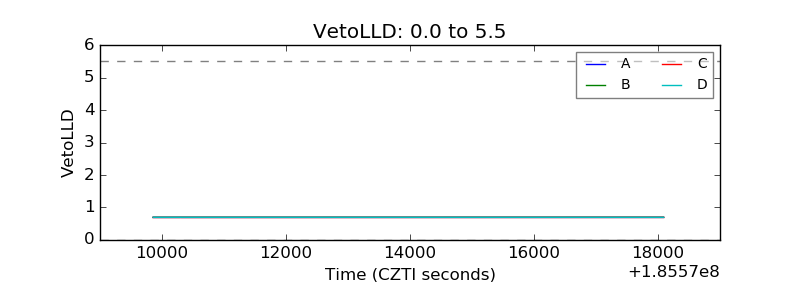 |
| Alpha Counter | 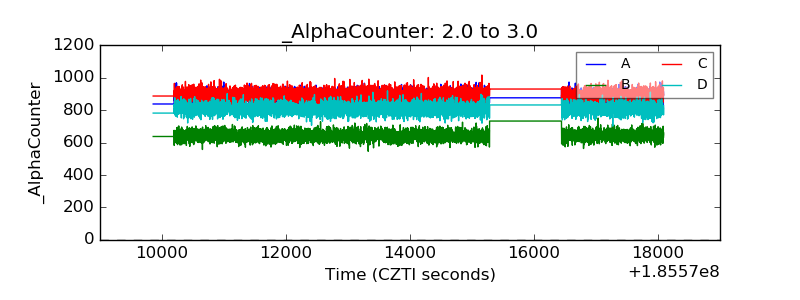 |
| _CPM_Rate | 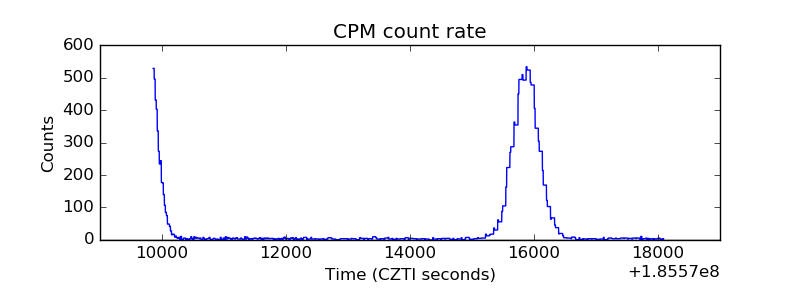 |
| CZT Counter | 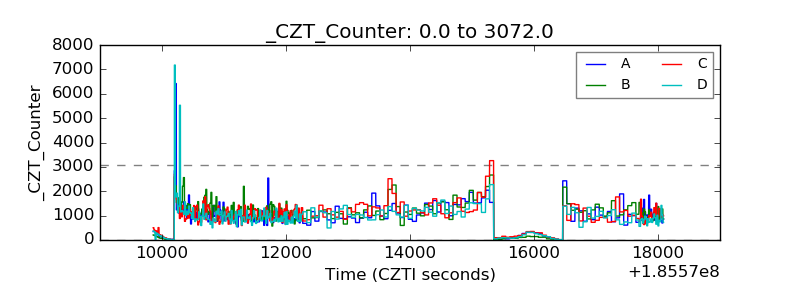 |
| +2.5 Volts monitor |  |
| +5 Volts monitor |  |
| _ROLL_ROT | 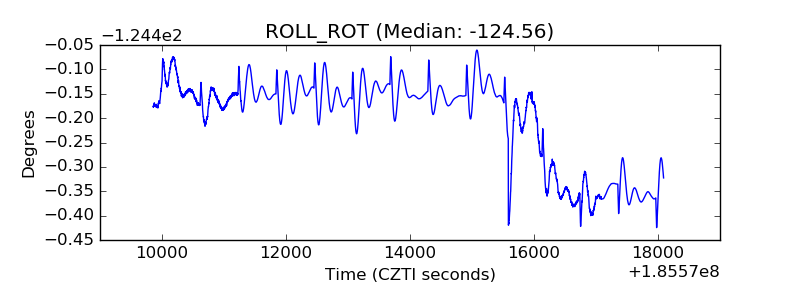 |
| _Roll_DEC | 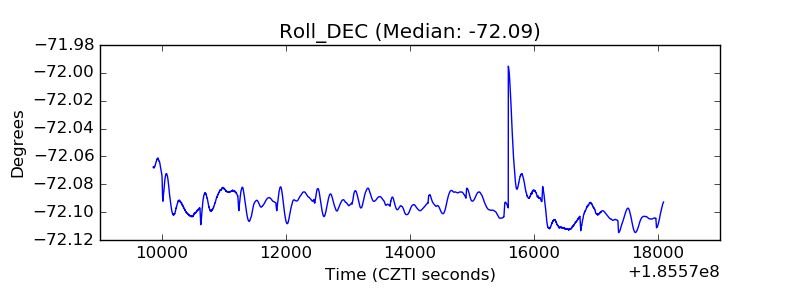 |
| _Roll_RA | 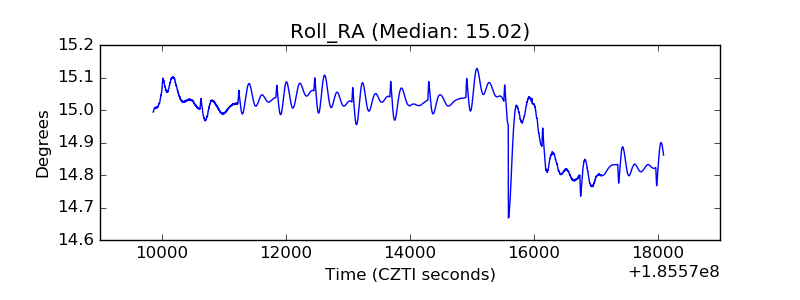 |
| Veto Counter | 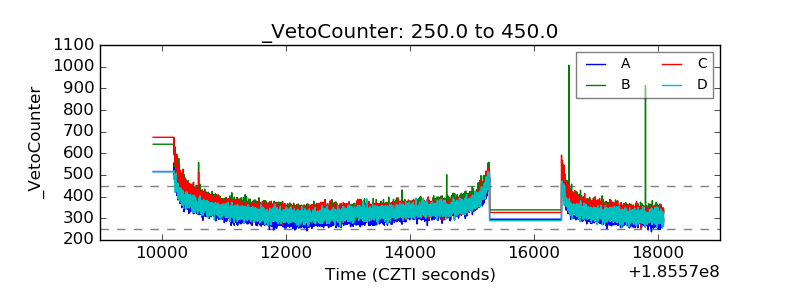 |