| Param | Original file | Final file |
|---|---|---|
| Filename | modeM0/AS1P01_010T01_9000000108_00769cztM0_level2.evt | modeM0/AS1P01_010T01_9000000108_00769cztM0_level2_quad_clean.evt |
| Size (bytes) | 1,019,928,960 | 94,668,480 |
| Size | 972.7 MB | 90.3 MB |
| Events in quadrant A | 7,737,231 | 601,178 |
| Events in quadrant B | 7,985,173 | 638,648 |
| Events in quadrant C | 7,603,215 | 605,326 |
| Events in quadrant D | 7,139,857 | 576,782 |
| Mode SS | |||
|---|---|---|---|
| Quadrant | BADHDUFLAG | Total packets | Discarded packets |
| A | 0 | 130 | 0 |
| B | 0 | 130 | 0 |
| C | 0 | 130 | 0 |
| D | 0 | 130 | 0 |
| Mode M0 | |||
|---|---|---|---|
| Quadrant | BADHDUFLAG | Total packets | Discarded packets |
| A | 0 | 27510 | 0 |
| B | 0 | 28253 | 0 |
| C | 0 | 27143 | 0 |
| D | 0 | 25807 | 0 |
| Mode M9 | |||
|---|---|---|---|
| Quadrant | BADHDUFLAG | Total packets | Discarded packets |
| A | 0 | 8 | 0 |
| B | 0 | 8 | 0 |
| C | 0 | 8 | 0 |
| D | 0 | 8 | 0 |
| Quadrant | Total seconds | Saturated seconds | Saturation percentage |
|---|---|---|---|
| A | 6375 | 127 | 1.992157% |
| B | 6375 | 38 | 0.596078% |
| C | 6374 | 58 | 0.909947% |
| D | 6374 | 159 | 2.494509% |
Noise dominated data is calculated using 1-second bins in cleaned event files. If a bin has >2000 counts, and if more than 50% of those come from <1% of pixels, then it is considered to be noise-dominated and hence unusable.
| Quadrant | # 1 sec bins | Bins with >0 counts | Bins with >2000 counts | High rate bins dominated by noise | Noise dominated (total time) | Noise dominated (detector-on time) | Marked lightcurve |
|---|---|---|---|---|---|---|---|
| A | 7235 | 6376 | 395 | 395 | 5.46% | 6.20% | 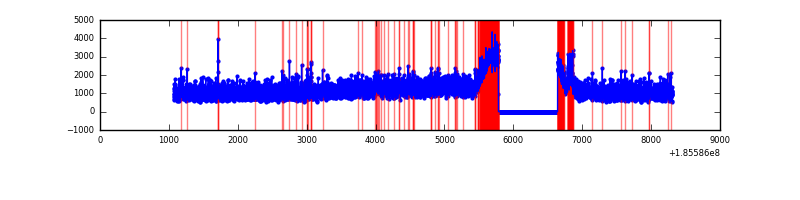 |
| B | 7235 | 6376 | 330 | 330 | 4.56% | 5.18% | 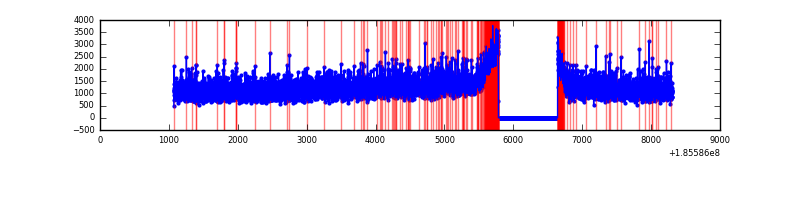 |
| C | 7234 | 6375 | 281 | 281 | 3.88% | 4.41% | 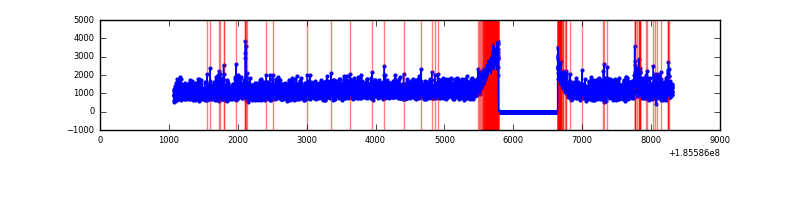 |
| D | 7234 | 6375 | 335 | 335 | 4.63% | 5.25% | 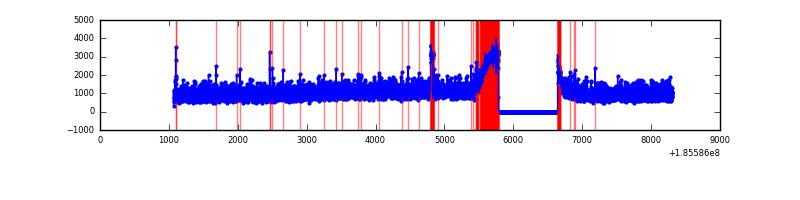 |
Top three noisy pixels from each quadrant. If the there are fewer than three noisy pixels in the level2.evt file, extra rows are filled as -1
| Pixel properties | Quadrant properties | ||||||
|---|---|---|---|---|---|---|---|
| Quadrant | DetID | PixID | Counts | Sigma | Mean | Median | Sigma |
| A | 0 | 117 | 131300 | 281.04 | 1968 | 1986 | 460.1 |
| A | 15 | 249 | 25408 | 50.9 | 1968 | 1986 | 460.1 |
| A | 13 | 17 | 17560 | 33.85 | 1968 | 1986 | 460.1 |
| B | 0 | 220 | 136839 | 281.5 | 2047 | 2051 | 478.8 |
| B | 7 | 221 | 57196 | 115.17 | 2047 | 2051 | 478.8 |
| B | 5 | 191 | 10630 | 17.92 | 2047 | 2051 | 478.8 |
| C | 10 | 17 | 68755 | 127.89 | 1895 | 1967 | 522.2 |
| C | 15 | 241 | 37970 | 68.94 | 1895 | 1967 | 522.2 |
| C | 3 | 111 | 30425 | 54.49 | 1895 | 1967 | 522.2 |
| D | 13 | 25 | 109359 | 192.93 | 1838 | 1905 | 557.0 |
| D | 12 | 188 | 85266 | 149.67 | 1838 | 1905 | 557.0 |
| D | 1 | 4 | 60802 | 105.75 | 1838 | 1905 | 557.0 |
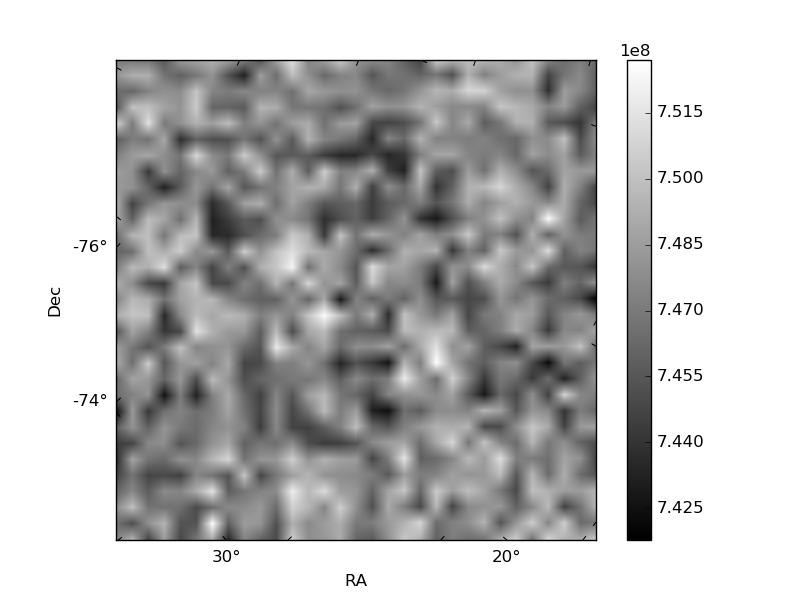
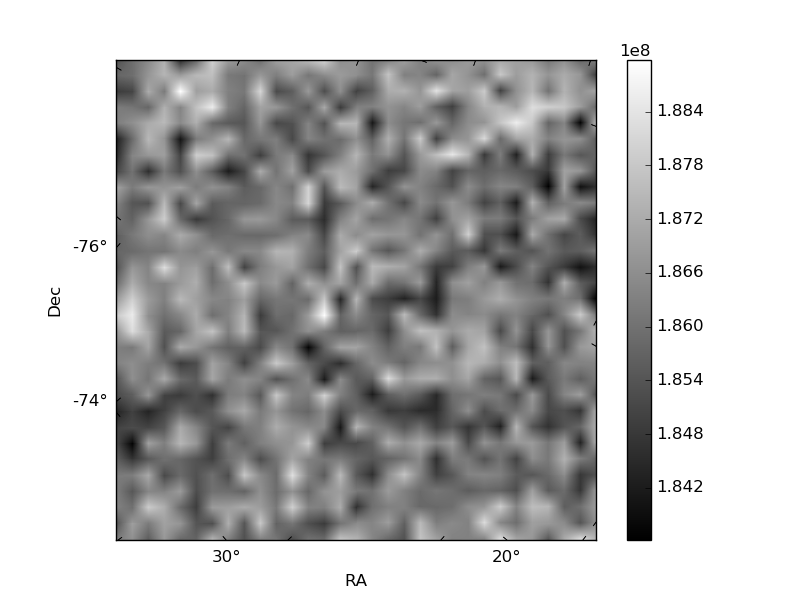
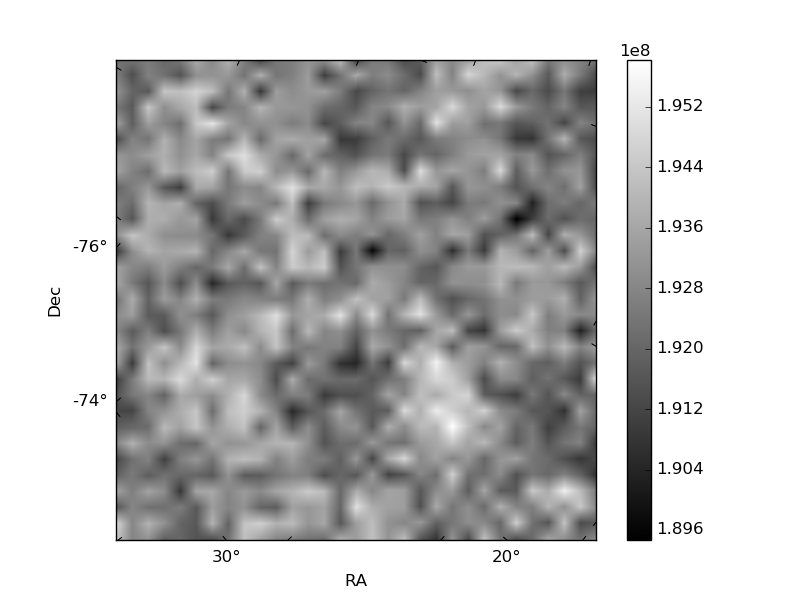
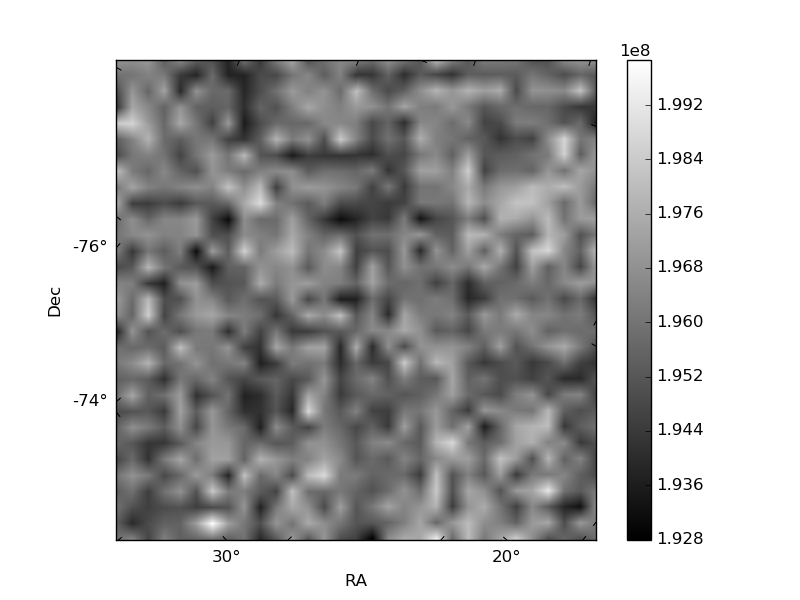
Histogram calculated using DETX and DETY for each event in the final _common_clean file
| Quadrant A | 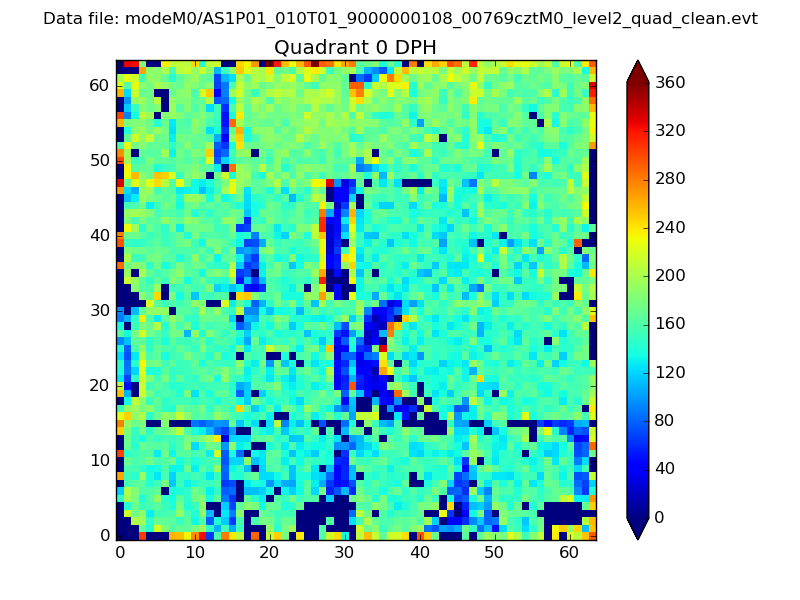 |
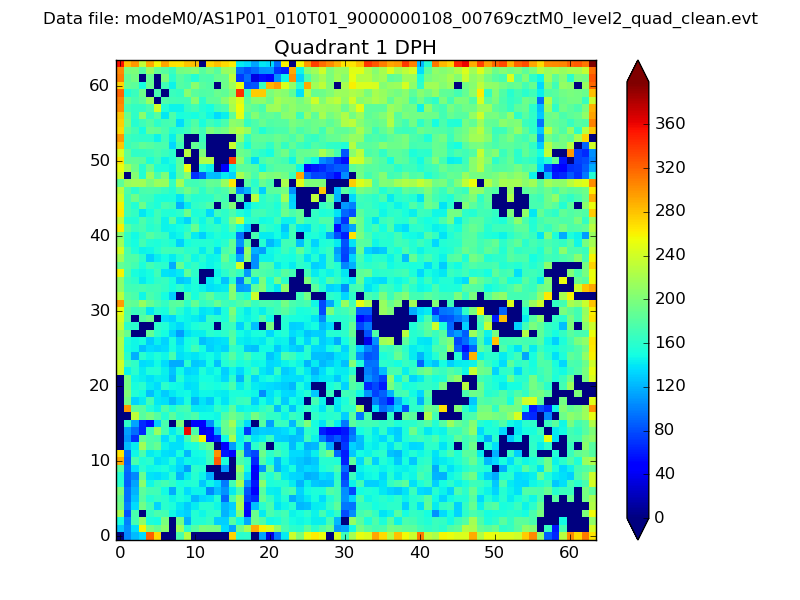 |
Quadrant B |
|---|---|---|---|
| Quadrant D | 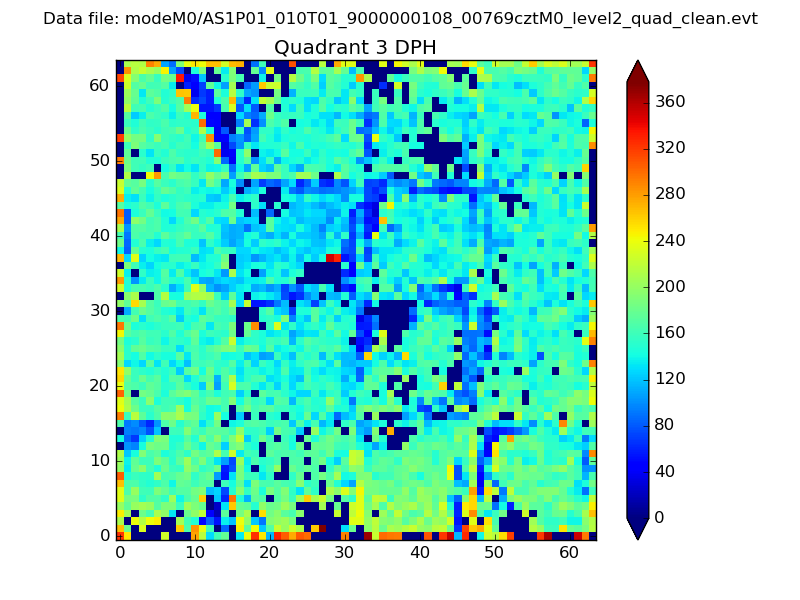 |
 |
Quadrant C |
| Plot type | Count rate plots | Images |
|---|---|---|
| Comparison with Poisson distribution Blue bars denote a histogram of data divided into 1 sec bins. Red curve is a Poisson curve with rate = median count rate of data. |
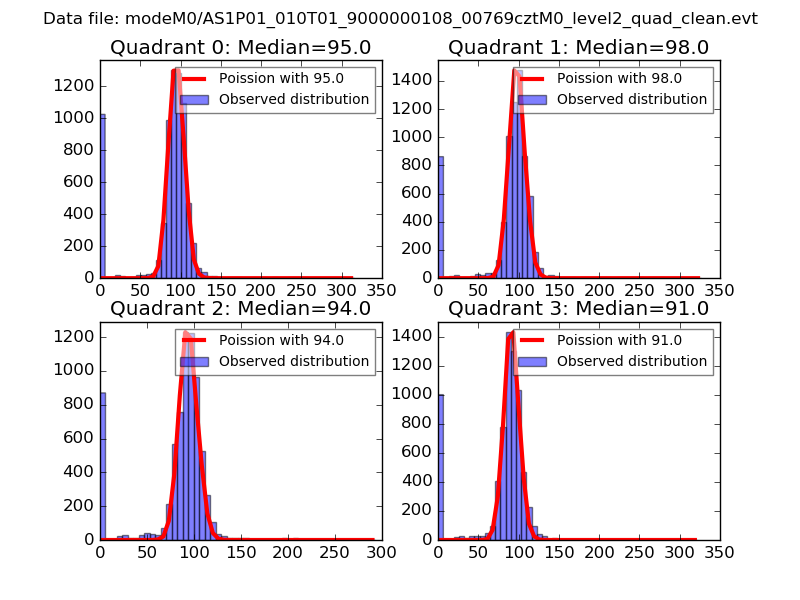 |
 |
| Quadrant-wise count rates Data is divided into 100 sec bins |
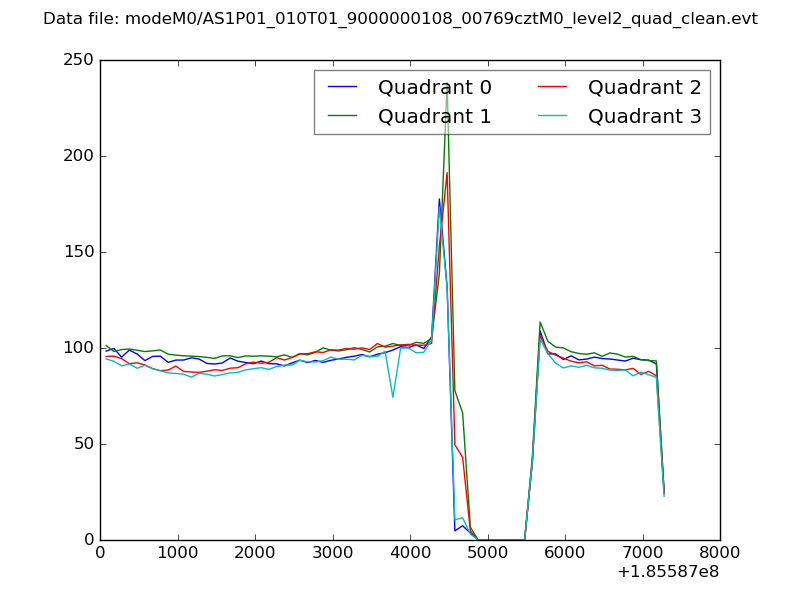 |
|
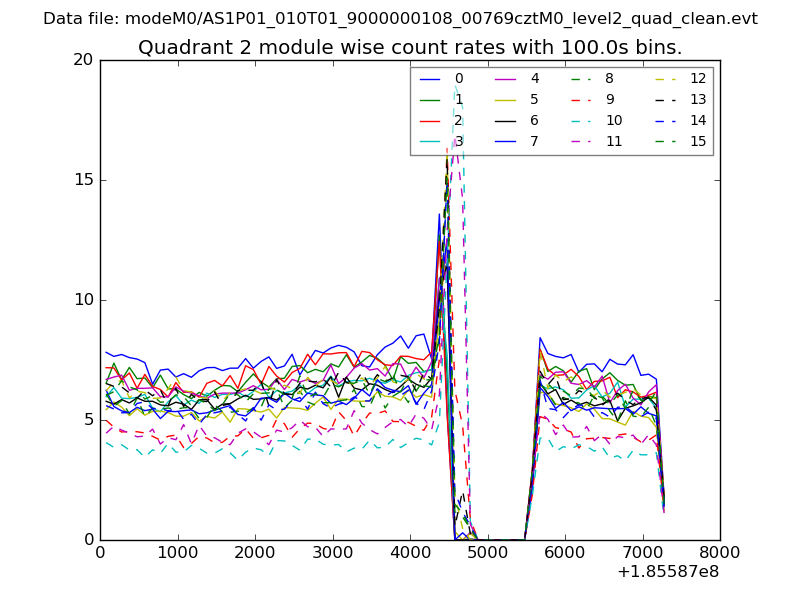
| Module-wise count rates for Quadrant A Data is divided into 100 sec bins |
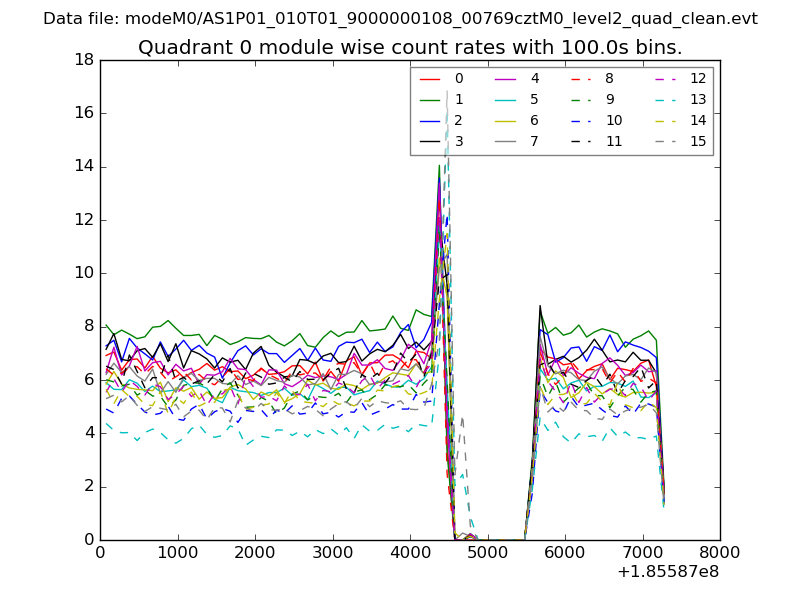 |
 |
| Module-wise count rates for Quadrant B Data is divided into 100 sec bins |
 |
 |
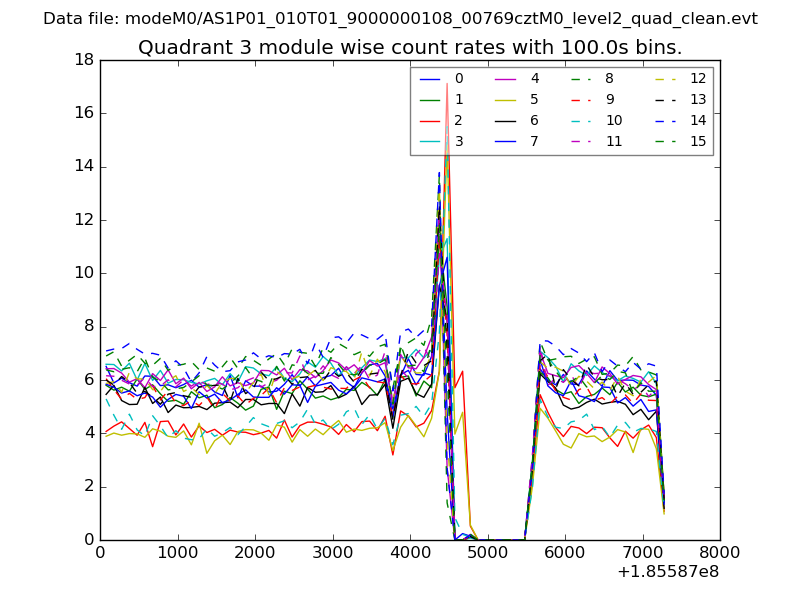
| Module-wise count rates for Quadrant C Data is divided into 100 sec bins |
 |
 |
| Module-wise count rates for Quadrant D Data is divided into 100 sec bins |
 |
 |
| Parameter | Plot |
|---|---|
| CZT HV Monitor | 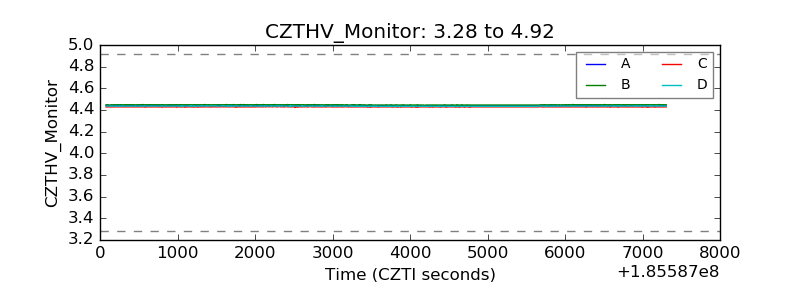 |
| D_VDD |  |
| Temperature 1 | 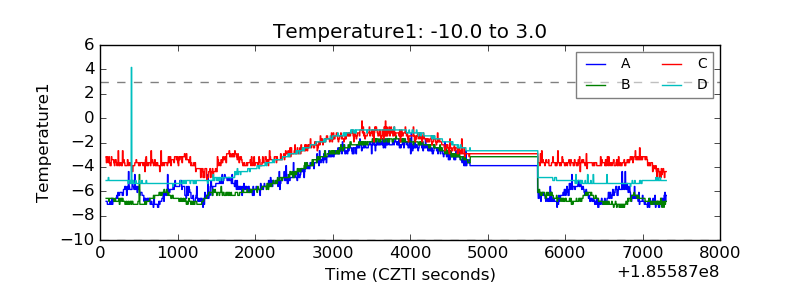 |
| Veto HV Monitor | 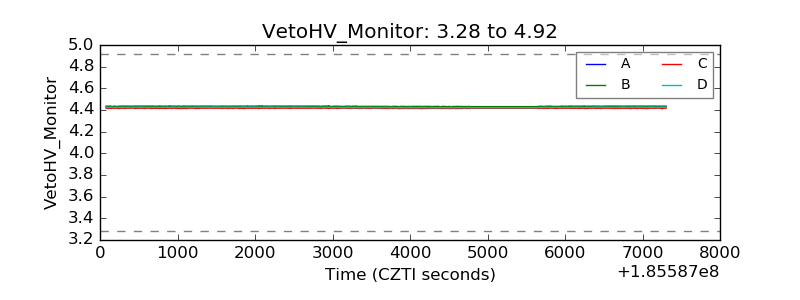 |
| Veto LLD | 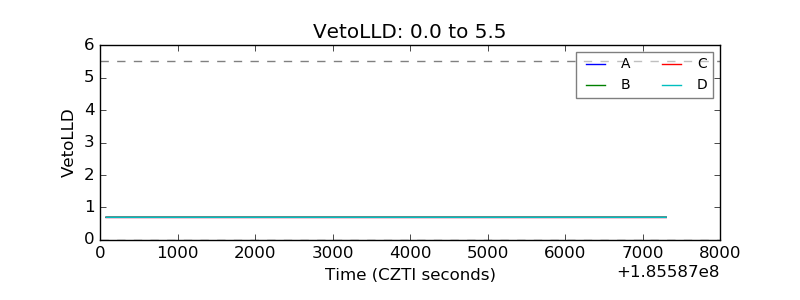 |
| Alpha Counter | 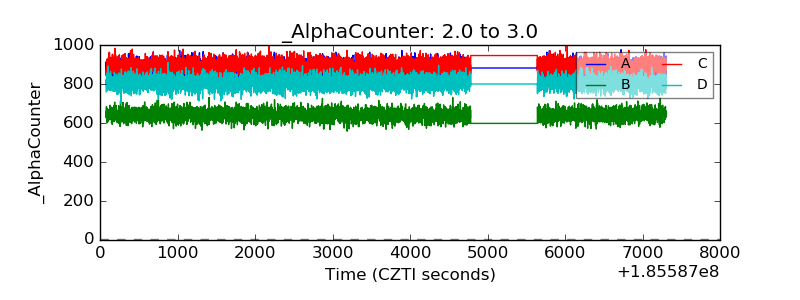 |
| _CPM_Rate | 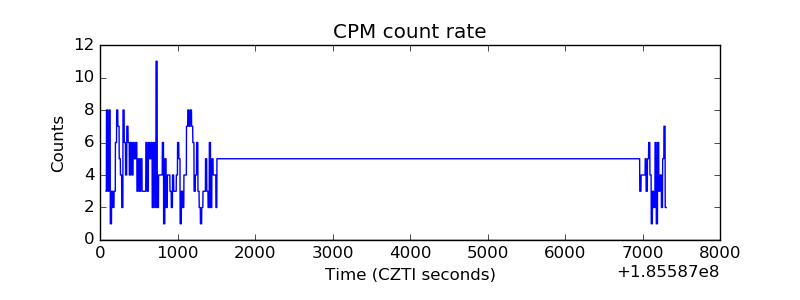 |
| CZT Counter |  |
| +2.5 Volts monitor |  |
| +5 Volts monitor |  |
| _ROLL_ROT | 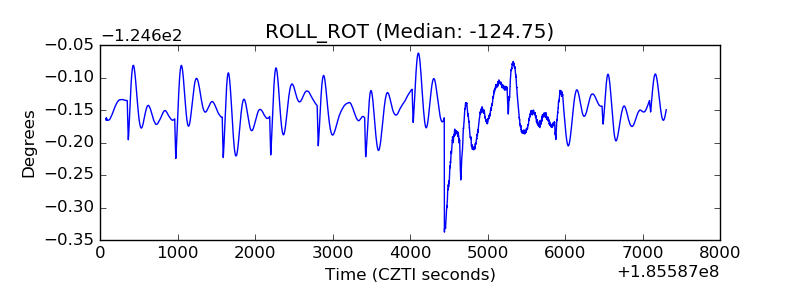 |
| _Roll_DEC | 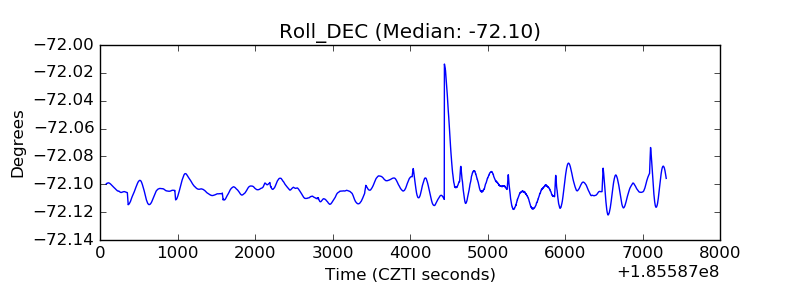 |
| _Roll_RA |  |
| Veto Counter | 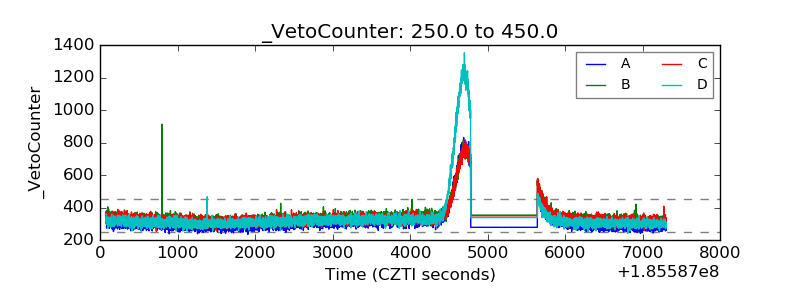 |