| Param | Original file | Final file |
|---|---|---|
| Filename | modeM0/AS1P01_010T01_9000000108_00770cztM0_level2.evt | modeM0/AS1P01_010T01_9000000108_00770cztM0_level2_quad_clean.evt |
| Size (bytes) | 1,164,191,040 | 110,206,080 |
| Size | 1.1 GB | 105.1 MB |
| Events in quadrant A | 8,706,322 | 720,681 |
| Events in quadrant B | 9,253,806 | 719,649 |
| Events in quadrant C | 8,647,272 | 699,570 |
| Events in quadrant D | 8,163,724 | 687,040 |
| Mode SS | |||
|---|---|---|---|
| Quadrant | BADHDUFLAG | Total packets | Discarded packets |
| A | 0 | 150 | 0 |
| B | 0 | 150 | 0 |
| C | 0 | 150 | 0 |
| D | 0 | 150 | 0 |
| Mode M0 | |||
|---|---|---|---|
| Quadrant | BADHDUFLAG | Total packets | Discarded packets |
| A | 0 | 31047 | 0 |
| B | 0 | 32728 | 0 |
| C | 0 | 30893 | 0 |
| D | 0 | 29500 | 0 |
| Mode M9 | |||
|---|---|---|---|
| Quadrant | BADHDUFLAG | Total packets | Discarded packets |
| A | 0 | 4 | 0 |
| B | 0 | 4 | 0 |
| C | 0 | 4 | 0 |
| D | 0 | 4 | 0 |
| Quadrant | Total seconds | Saturated seconds | Saturation percentage |
|---|---|---|---|
| A | 7333 | 22 | 0.300014% |
| B | 7333 | 33 | 0.450020% |
| C | 7334 | 27 | 0.368148% |
| D | 7334 | 144 | 1.963458% |
Noise dominated data is calculated using 1-second bins in cleaned event files. If a bin has >2000 counts, and if more than 50% of those come from <1% of pixels, then it is considered to be noise-dominated and hence unusable.
| Quadrant | # 1 sec bins | Bins with >0 counts | Bins with >2000 counts | High rate bins dominated by noise | Noise dominated (total time) | Noise dominated (detector-on time) | Marked lightcurve |
|---|---|---|---|---|---|---|---|
| A | 7778 | 7335 | 281 | 281 | 3.61% | 3.83% | 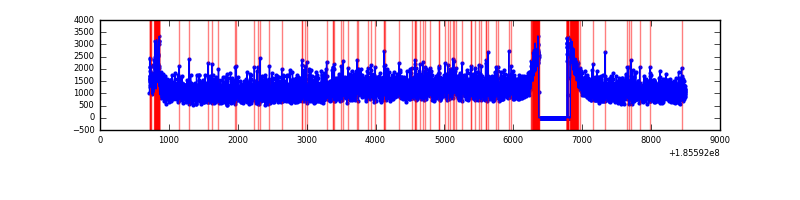 |
| B | 7778 | 7335 | 354 | 354 | 4.55% | 4.83% | 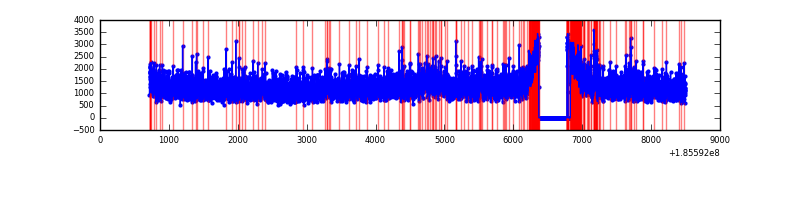 |
| C | 7779 | 7336 | 246 | 246 | 3.16% | 3.35% | 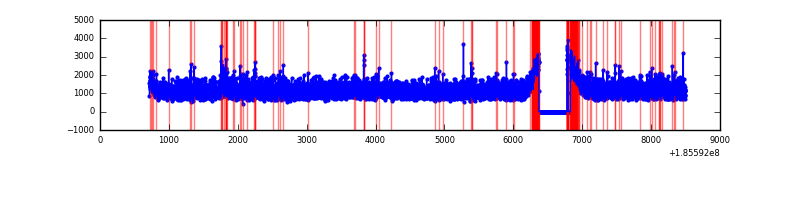 |
| D | 7779 | 7336 | 283 | 283 | 3.64% | 3.86% | 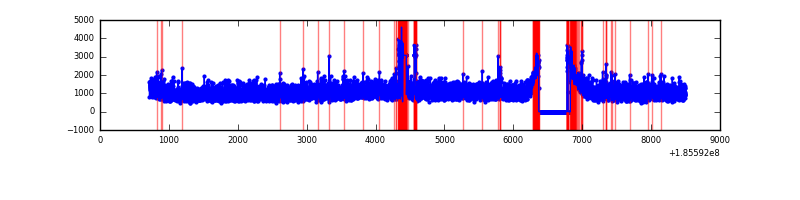 |
Top three noisy pixels from each quadrant. If the there are fewer than three noisy pixels in the level2.evt file, extra rows are filled as -1
| Pixel properties | Quadrant properties | ||||||
|---|---|---|---|---|---|---|---|
| Quadrant | DetID | PixID | Counts | Sigma | Mean | Median | Sigma |
| A | 0 | 117 | 144683 | 264.84 | 2223 | 2238 | 537.8 |
| A | 0 | 5 | 14158 | 22.16 | 2223 | 2238 | 537.8 |
| A | 12 | 189 | 13067 | 20.13 | 2223 | 2238 | 537.8 |
| B | 7 | 221 | 155343 | 278.42 | 2346 | 2357 | 549.5 |
| B | 0 | 220 | 76879 | 135.62 | 2346 | 2357 | 549.5 |
| B | 5 | 191 | 49486 | 85.77 | 2346 | 2357 | 549.5 |
| C | 10 | 17 | 63133 | 101.71 | 2151 | 2224 | 598.9 |
| C | 15 | 241 | 48570 | 77.39 | 2151 | 2224 | 598.9 |
| C | 10 | 207 | 46507 | 73.94 | 2151 | 2224 | 598.9 |
| D | 13 | 25 | 317450 | 497.05 | 2044 | 2110 | 634.4 |
| D | 12 | 188 | 79651 | 122.22 | 2044 | 2110 | 634.4 |
| D | 1 | 4 | 70817 | 108.3 | 2044 | 2110 | 634.4 |
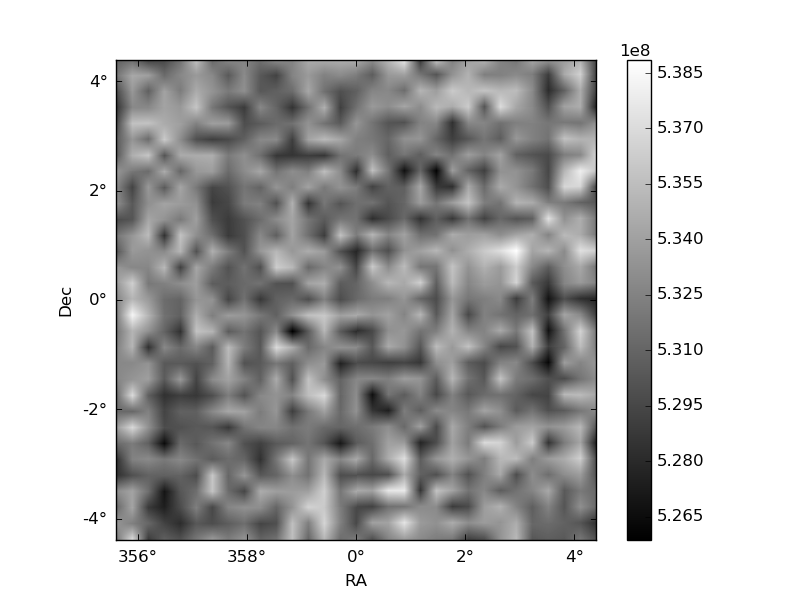
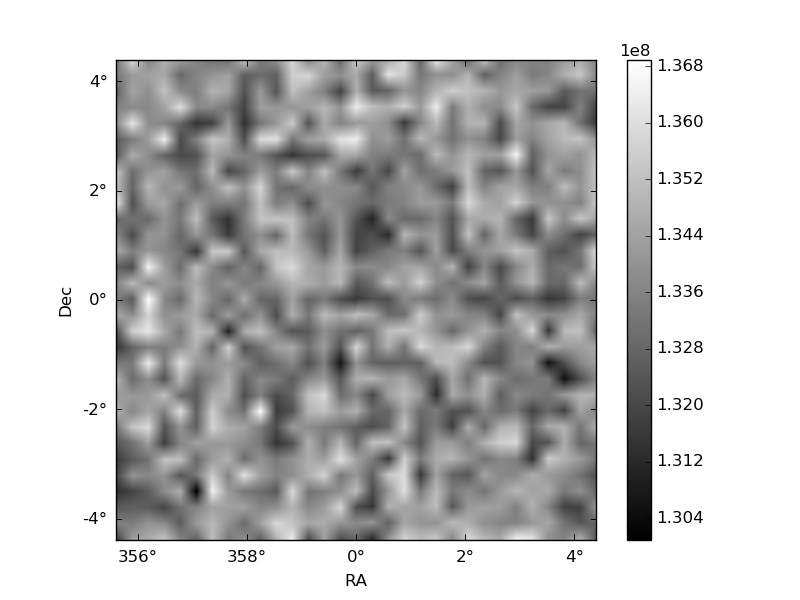
Histogram calculated using DETX and DETY for each event in the final _common_clean file
| Quadrant A | 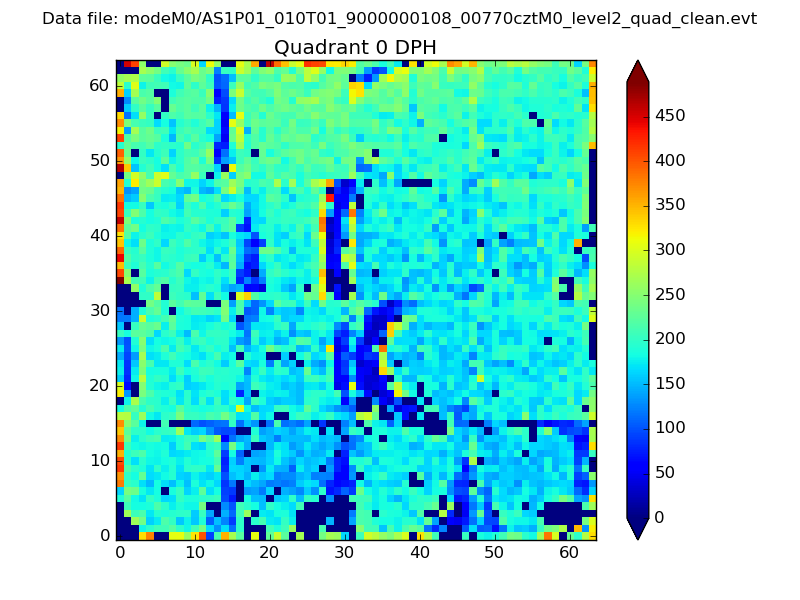 |
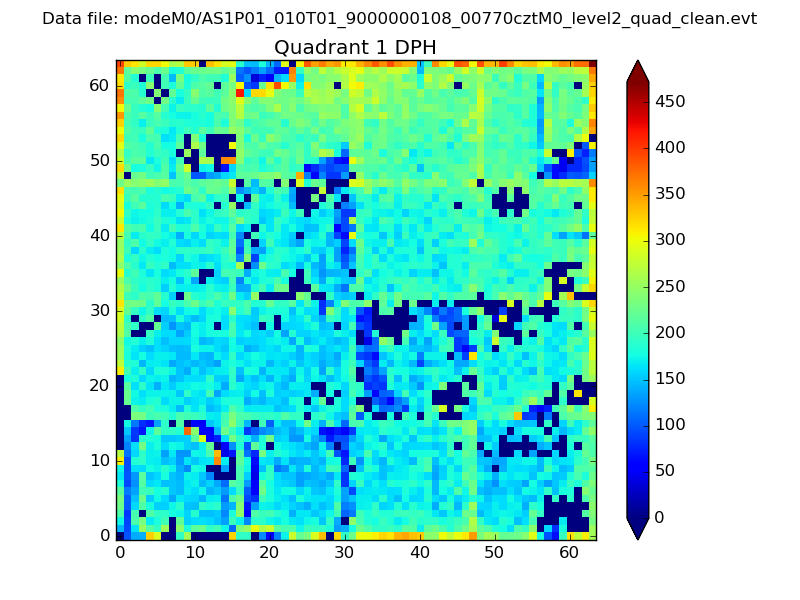 |
Quadrant B |
|---|---|---|---|
| Quadrant D | 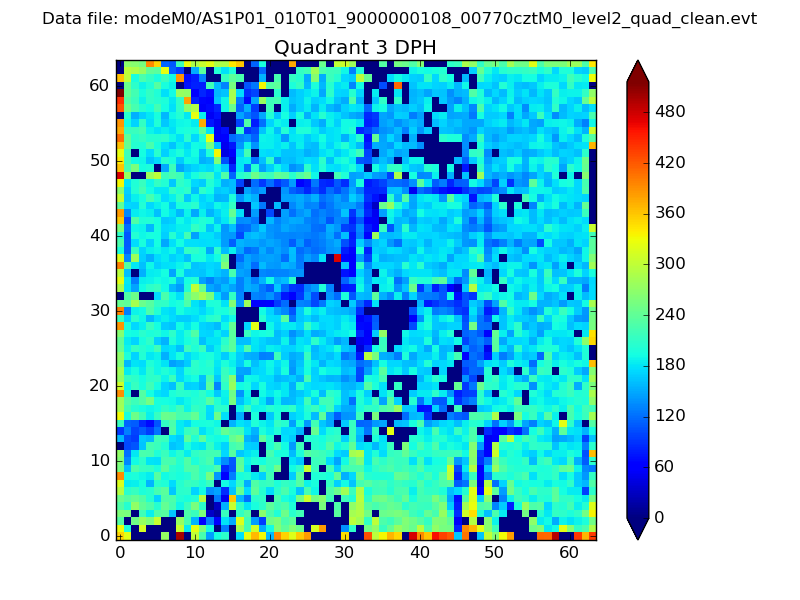 |
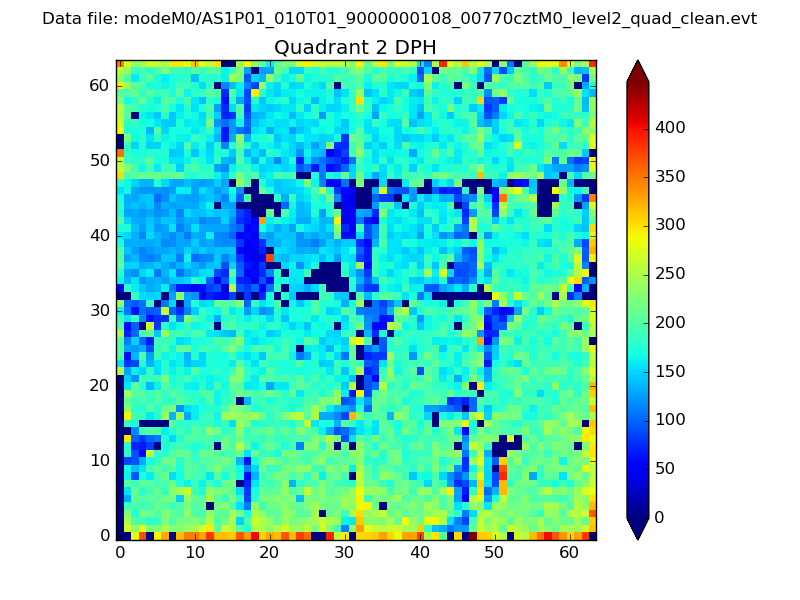 |
Quadrant C |
| Plot type | Count rate plots | Images |
|---|---|---|
| Comparison with Poisson distribution Blue bars denote a histogram of data divided into 1 sec bins. Red curve is a Poisson curve with rate = median count rate of data. |
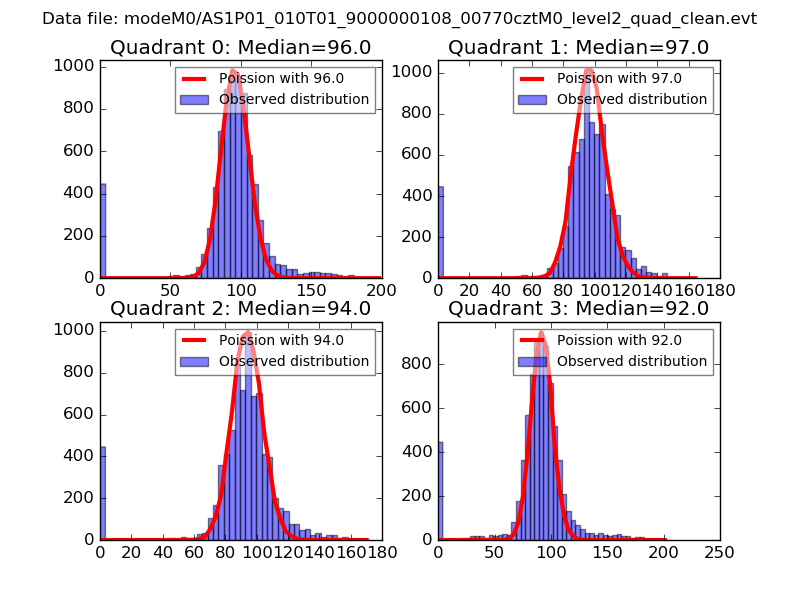 |
 |
| Quadrant-wise count rates Data is divided into 100 sec bins |
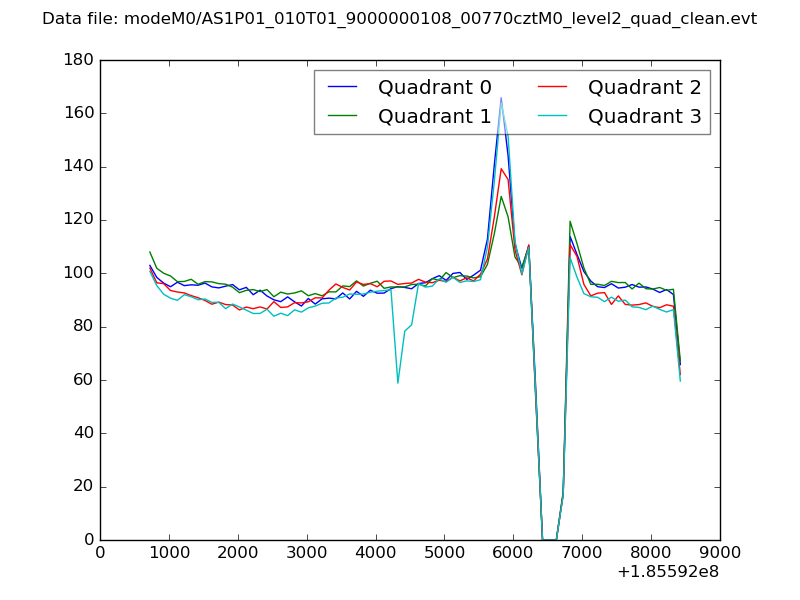 |
|
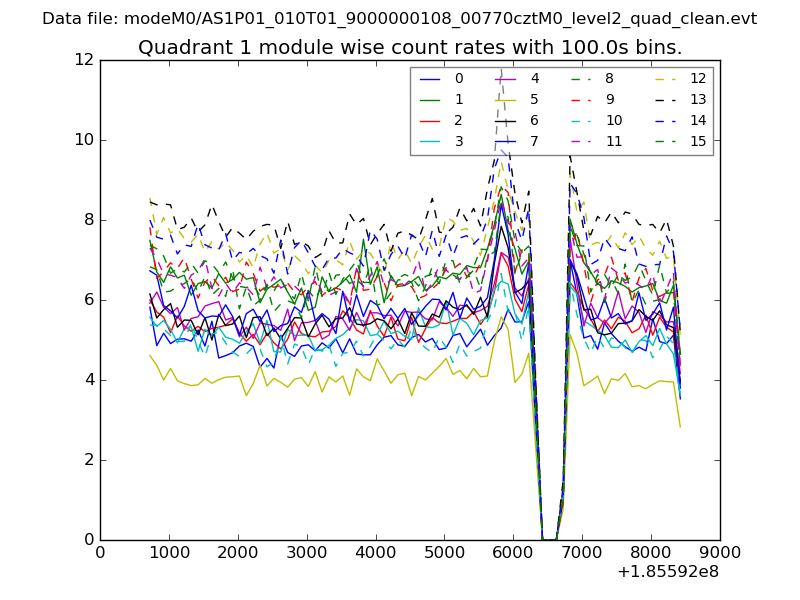
| Module-wise count rates for Quadrant A Data is divided into 100 sec bins |
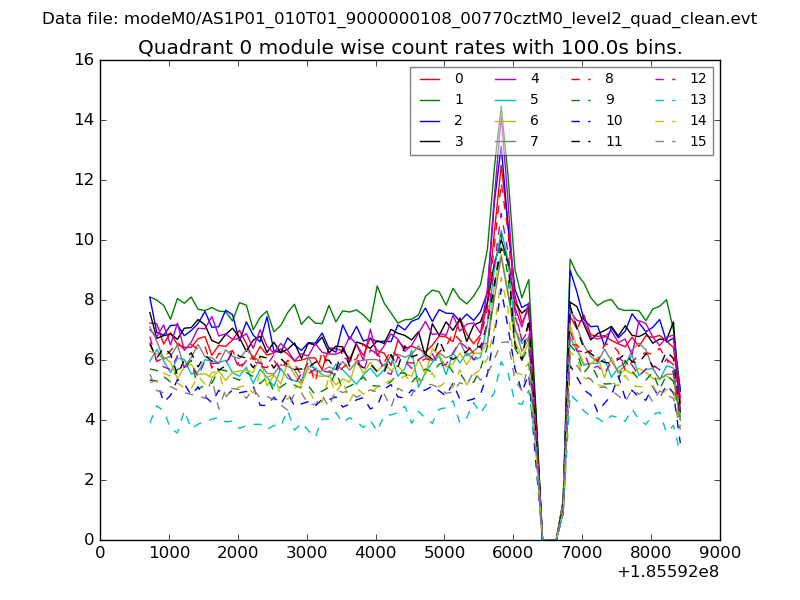 |
 |
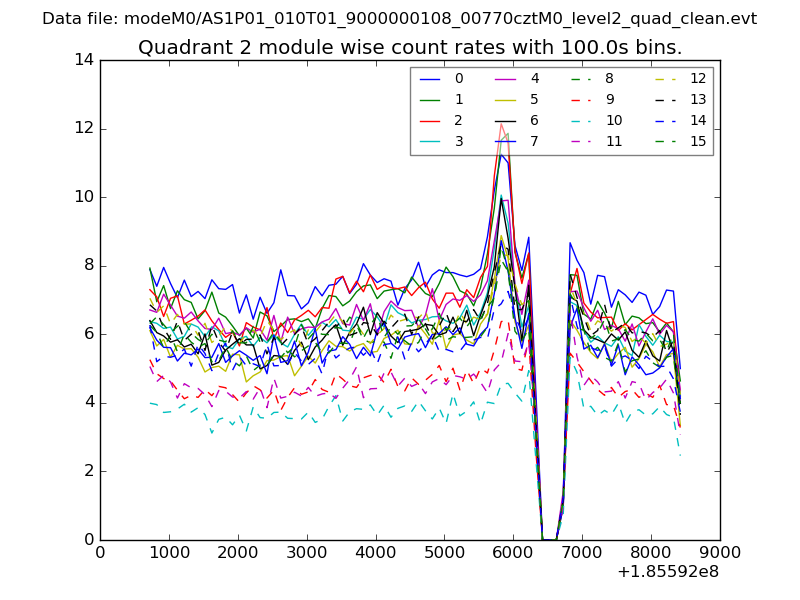
| Module-wise count rates for Quadrant B Data is divided into 100 sec bins |
 |
 |
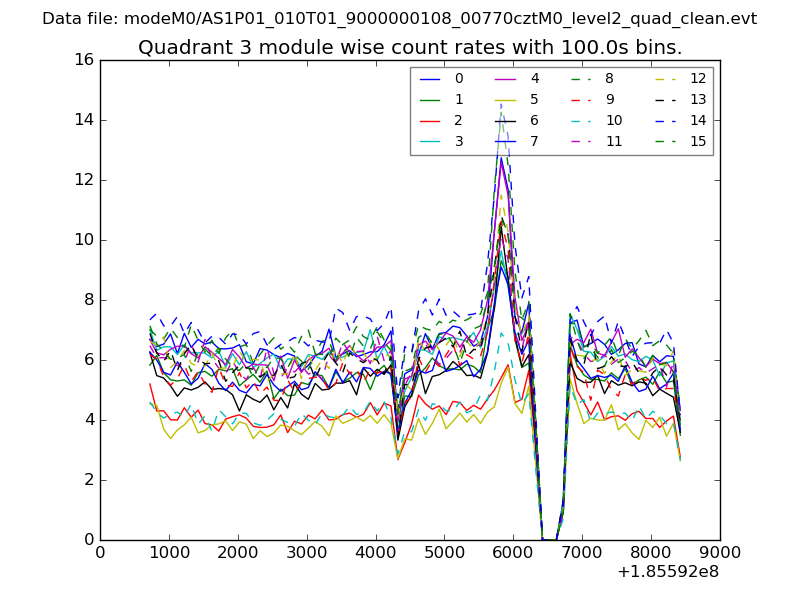
| Module-wise count rates for Quadrant C Data is divided into 100 sec bins |
 |
 |
| Module-wise count rates for Quadrant D Data is divided into 100 sec bins |
 |
 |
| Parameter | Plot |
|---|---|
| CZT HV Monitor | 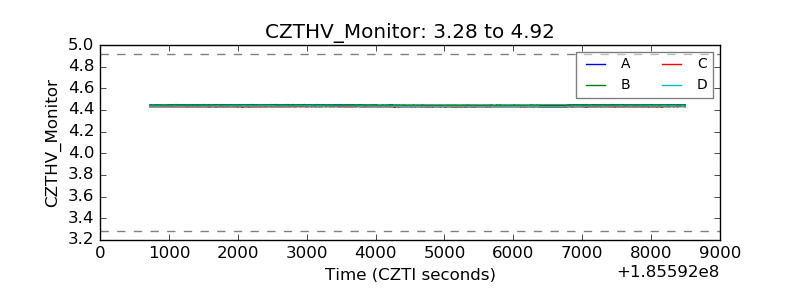 |
| D_VDD | 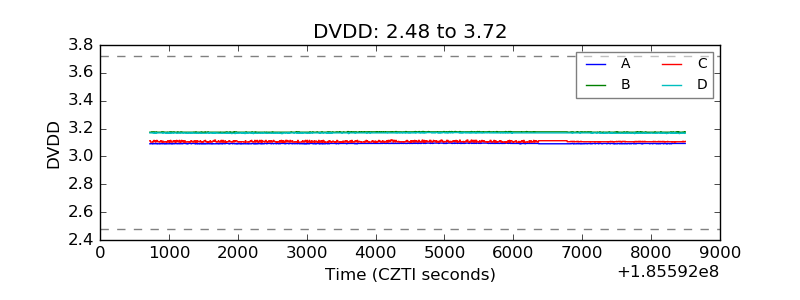 |
| Temperature 1 | 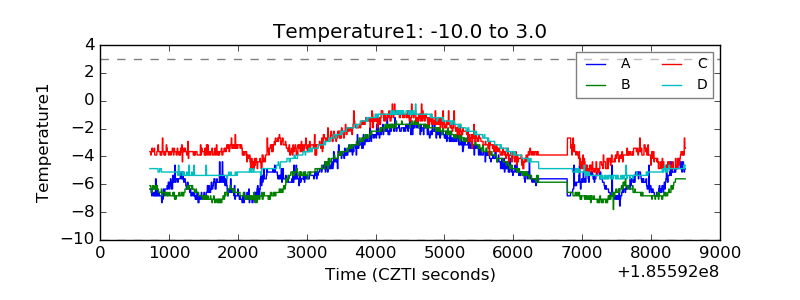 |
| Veto HV Monitor | 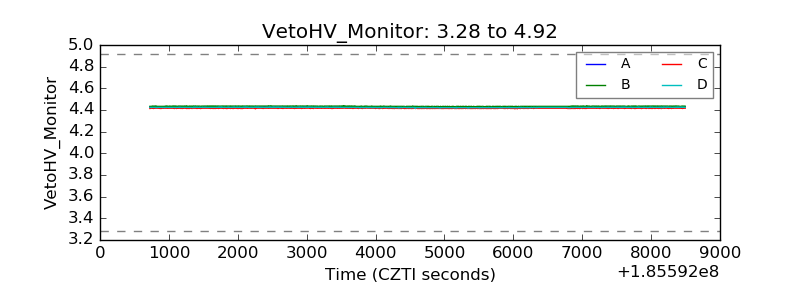 |
| Veto LLD | 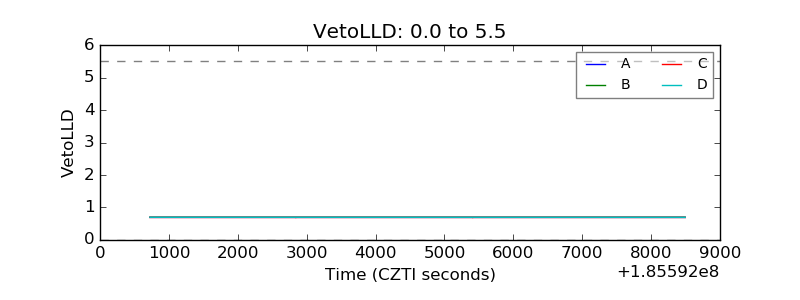 |
| Alpha Counter | 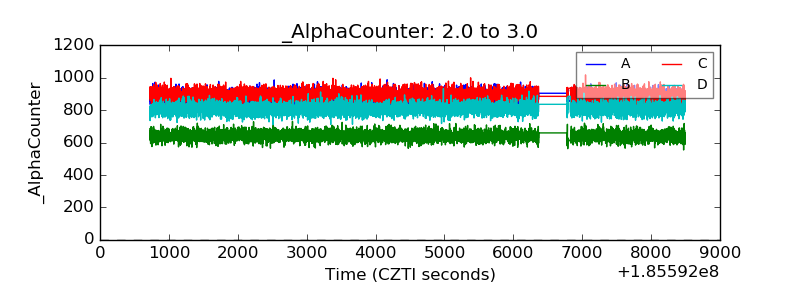 |
| _CPM_Rate | 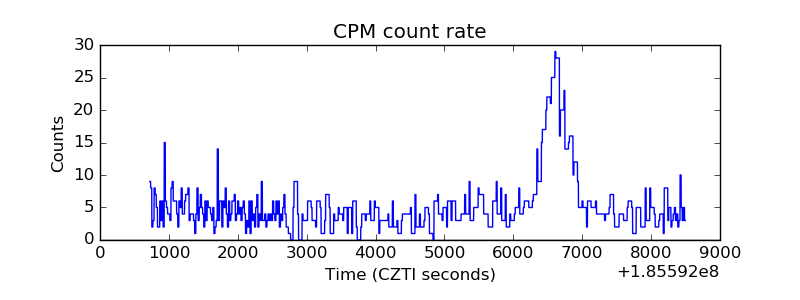 |
| CZT Counter | 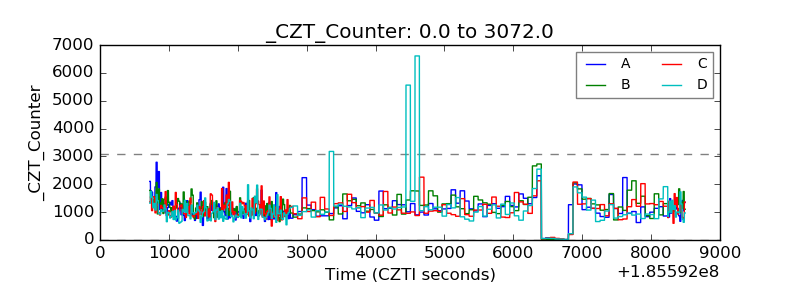 |
| +2.5 Volts monitor |  |
| +5 Volts monitor |  |
| _ROLL_ROT | 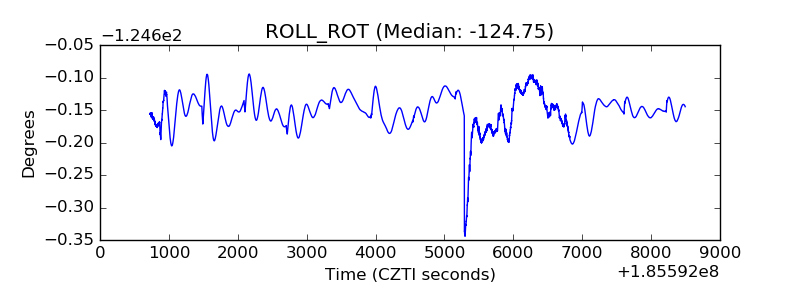 |
| _Roll_DEC | 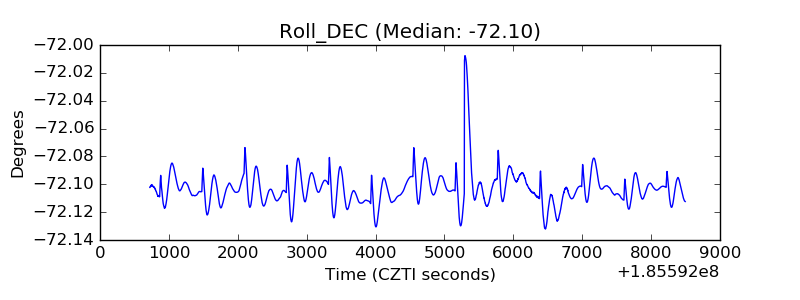 |
| _Roll_RA | 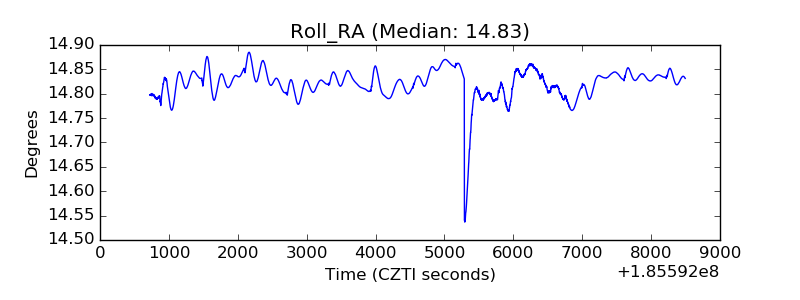 |
| Veto Counter | 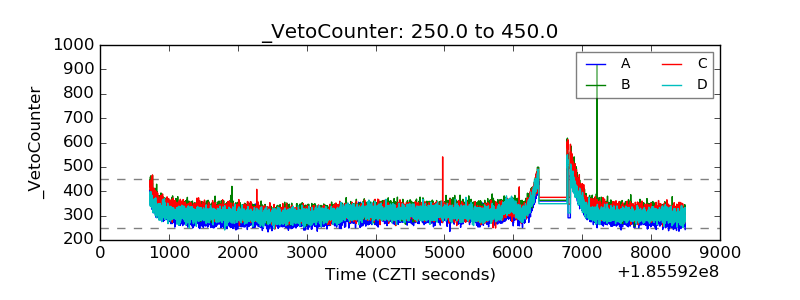 |