| Param | Original file | Final file |
|---|---|---|
| Filename | modeM0/AS1P01_010T01_9000000108_00771cztM0_level2.evt | modeM0/AS1P01_010T01_9000000108_00771cztM0_level2_quad_clean.evt |
| Size (bytes) | 1,184,575,680 | 108,391,680 |
| Size | 1.1 GB | 103.4 MB |
| Events in quadrant A | 8,718,843 | 705,481 |
| Events in quadrant B | 9,491,915 | 705,502 |
| Events in quadrant C | 8,778,500 | 688,397 |
| Events in quadrant D | 8,405,566 | 678,490 |
| Mode SS | |||
|---|---|---|---|
| Quadrant | BADHDUFLAG | Total packets | Discarded packets |
| A | 0 | 144 | 0 |
| B | 0 | 144 | 0 |
| C | 0 | 144 | 0 |
| D | 0 | 144 | 0 |
| Mode M0 | |||
|---|---|---|---|
| Quadrant | BADHDUFLAG | Total packets | Discarded packets |
| A | 0 | 31017 | 0 |
| B | 0 | 33357 | 0 |
| C | 0 | 31201 | 0 |
| D | 0 | 30157 | 0 |
| Quadrant | Total seconds | Saturated seconds | Saturation percentage |
|---|---|---|---|
| A | 7257 | 19 | 0.261816% |
| B | 7257 | 25 | 0.344495% |
| C | 7256 | 26 | 0.358324% |
| D | 7256 | 57 | 0.785557% |
Noise dominated data is calculated using 1-second bins in cleaned event files. If a bin has >2000 counts, and if more than 50% of those come from <1% of pixels, then it is considered to be noise-dominated and hence unusable.
| Quadrant | # 1 sec bins | Bins with >0 counts | Bins with >2000 counts | High rate bins dominated by noise | Noise dominated (total time) | Noise dominated (detector-on time) | Marked lightcurve |
|---|---|---|---|---|---|---|---|
| A | 7257 | 7257 | 374 | 374 | 5.15% | 5.15% | 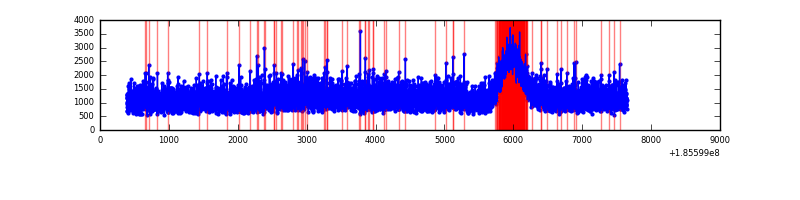 |
| B | 7257 | 7257 | 502 | 502 | 6.92% | 6.92% |  |
| C | 7256 | 7256 | 411 | 411 | 5.66% | 5.66% |  |
| D | 7256 | 7256 | 372 | 372 | 5.13% | 5.13% | 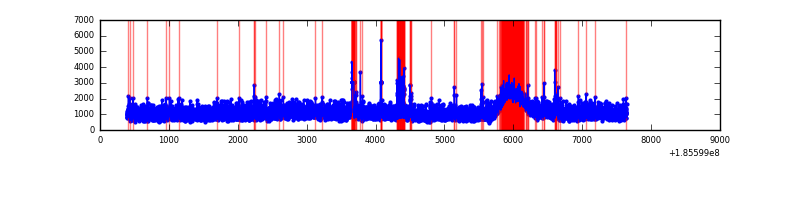 |
Top three noisy pixels from each quadrant. If the there are fewer than three noisy pixels in the level2.evt file, extra rows are filled as -1
| Pixel properties | Quadrant properties | ||||||
|---|---|---|---|---|---|---|---|
| Quadrant | DetID | PixID | Counts | Sigma | Mean | Median | Sigma |
| A | 12 | 189 | 13413 | 20.35 | 2265 | 2279 | 547.0 |
| A | 0 | 117 | 8389 | 11.17 | 2265 | 2279 | 547.0 |
| A | 11 | 79 | 8130 | 10.7 | 2265 | 2279 | 547.0 |
| B | 7 | 221 | 263831 | 467.21 | 2380 | 2384 | 559.6 |
| B | 0 | 220 | 162184 | 285.57 | 2380 | 2384 | 559.6 |
| B | 4 | 170 | 9674 | 13.03 | 2380 | 2384 | 559.6 |
| C | 10 | 17 | 55501 | 86.93 | 2190 | 2267 | 612.4 |
| C | 15 | 241 | 54229 | 84.86 | 2190 | 2267 | 612.4 |
| C | 3 | 111 | 37187 | 57.03 | 2190 | 2267 | 612.4 |
| D | 1 | 4 | 139344 | 210.07 | 2101 | 2177 | 653.0 |
| D | 13 | 25 | 112822 | 169.45 | 2101 | 2177 | 653.0 |
| D | 13 | 169 | 100149 | 150.04 | 2101 | 2177 | 653.0 |
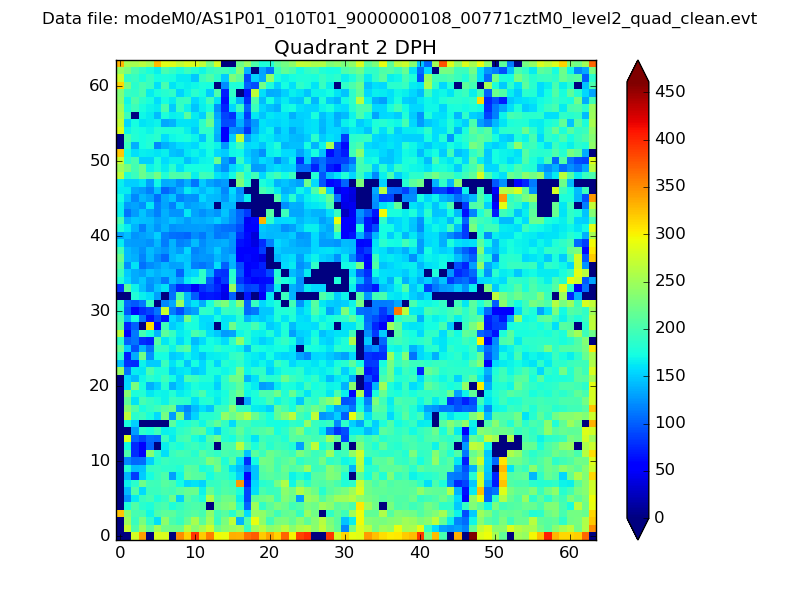
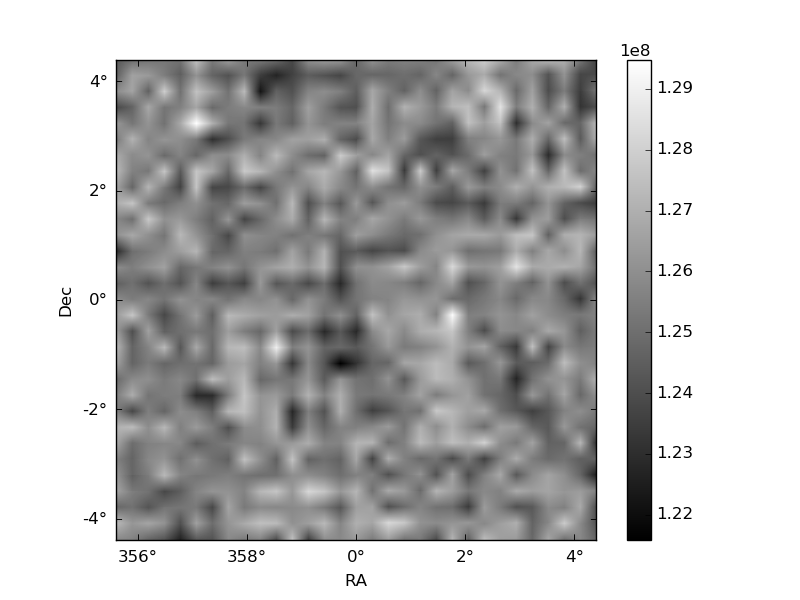
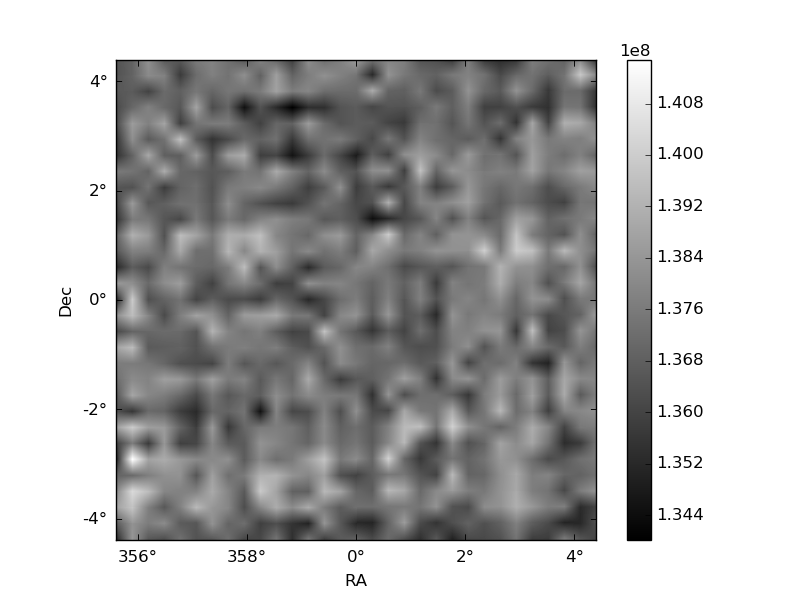
Histogram calculated using DETX and DETY for each event in the final _common_clean file
| Quadrant A | 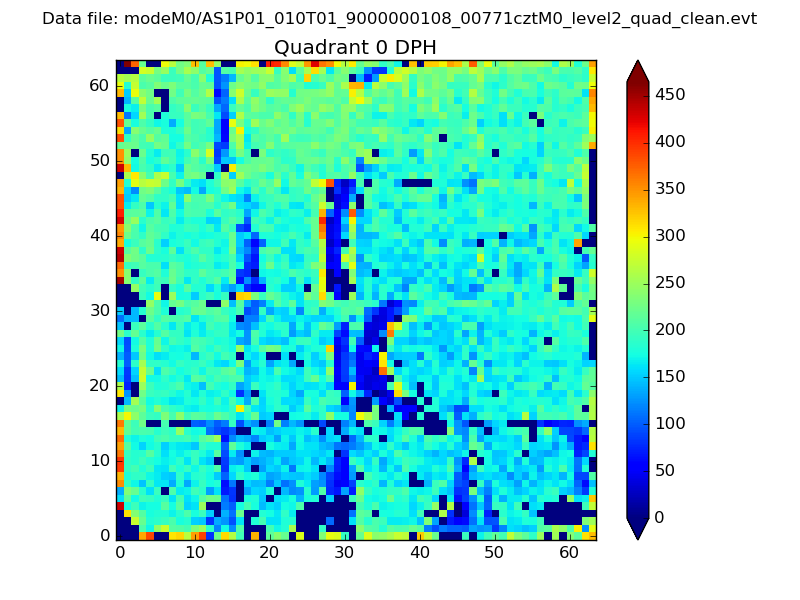 |
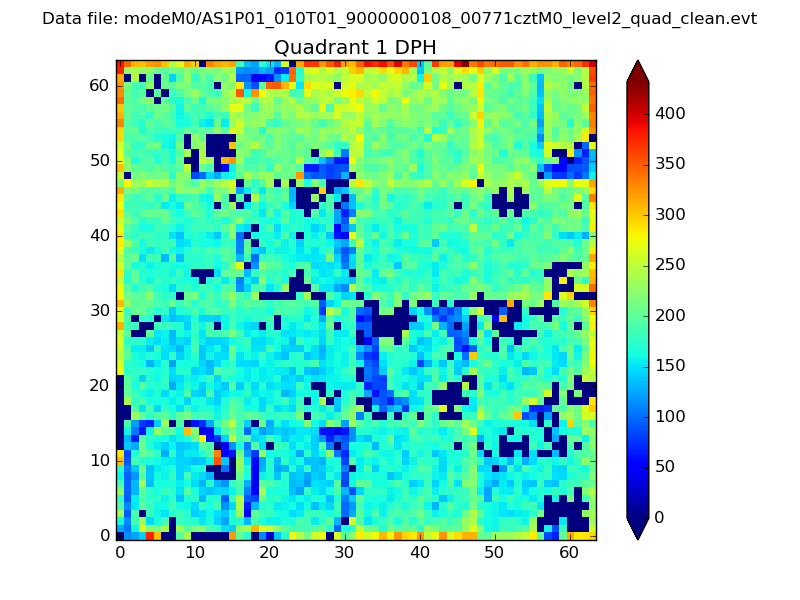 |
Quadrant B |
|---|---|---|---|
| Quadrant D | 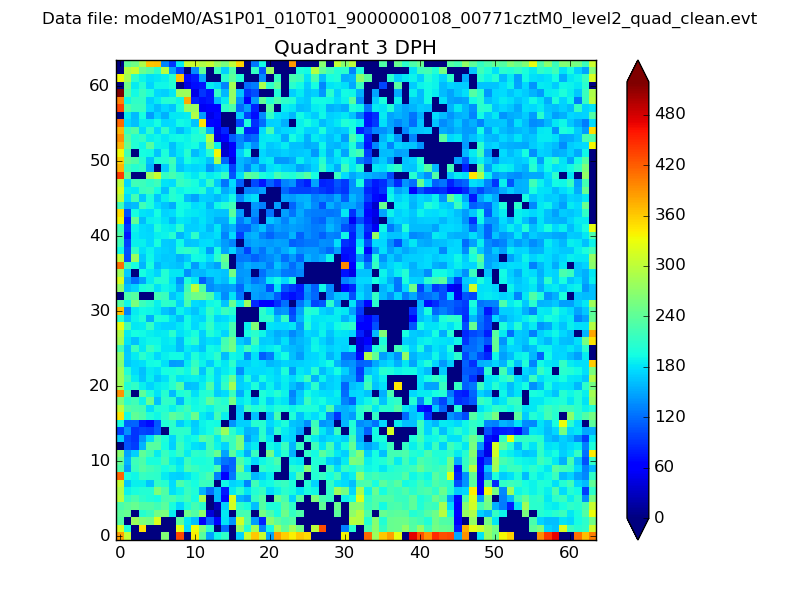 |
 |
Quadrant C |
| Plot type | Count rate plots | Images |
|---|---|---|
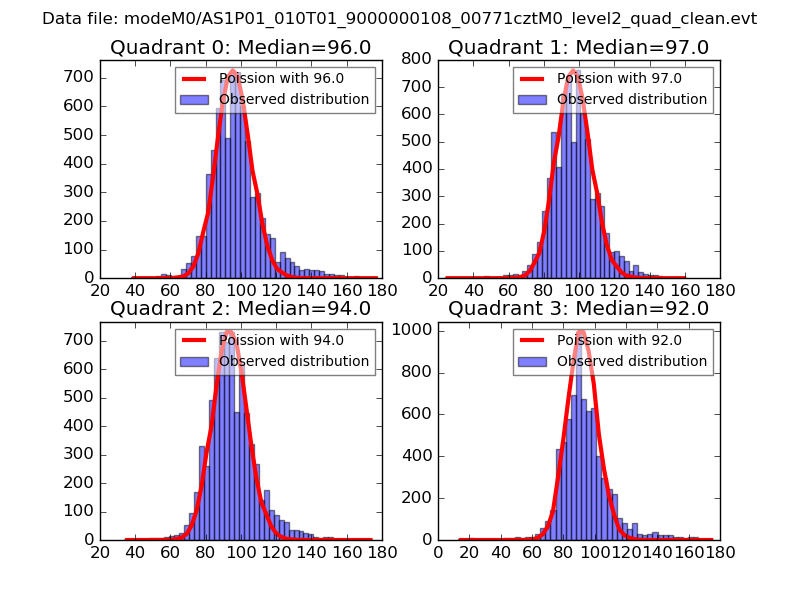
| Comparison with Poisson distribution Blue bars denote a histogram of data divided into 1 sec bins. Red curve is a Poisson curve with rate = median count rate of data. |
 |
 |
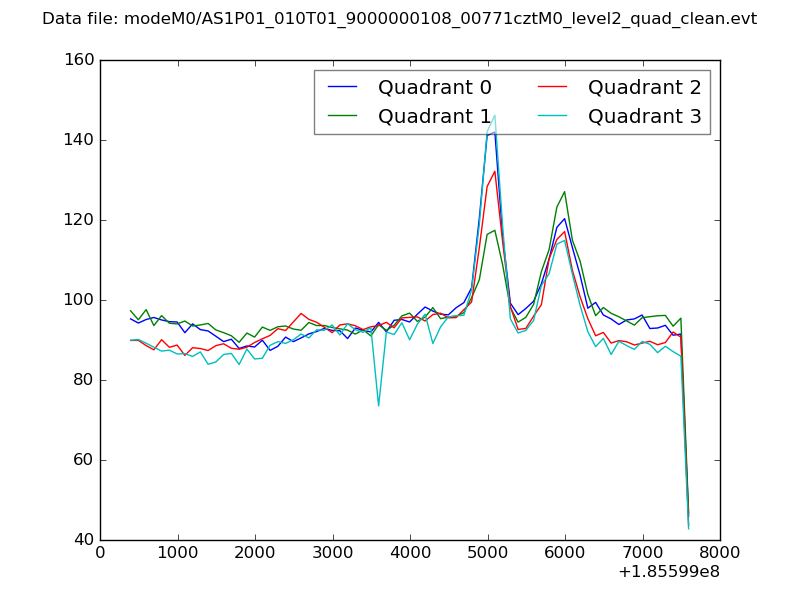
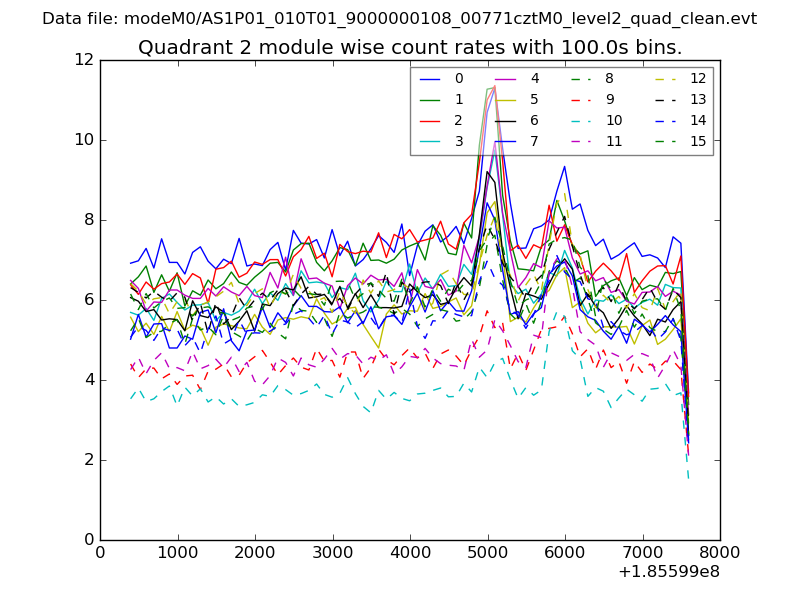
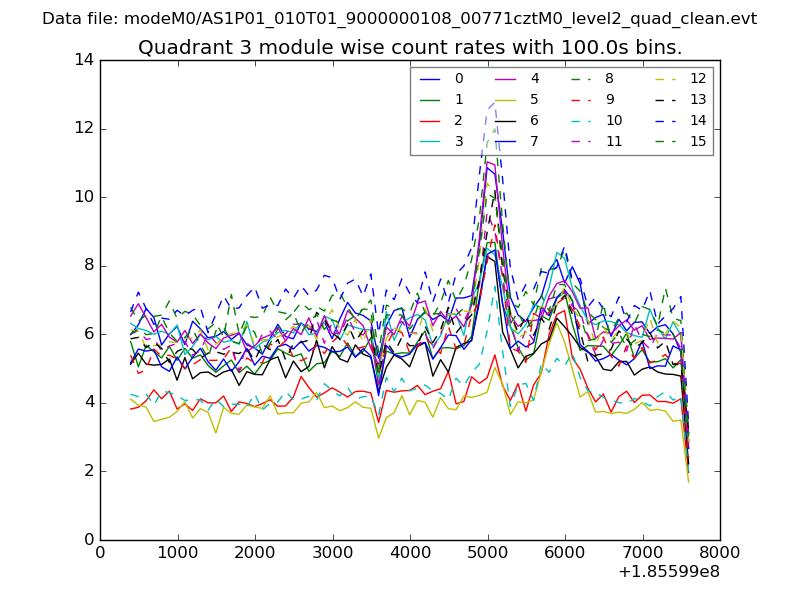
| Quadrant-wise count rates Data is divided into 100 sec bins |
 |
|
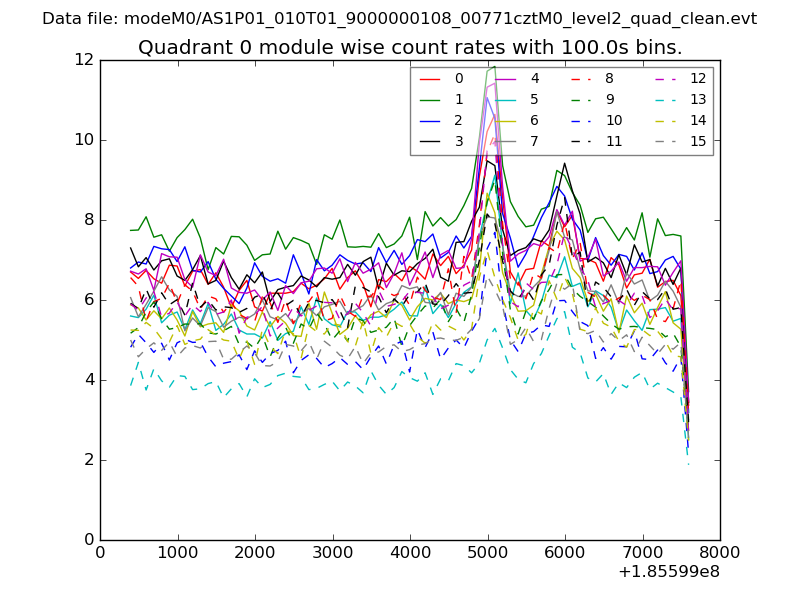
| Module-wise count rates for Quadrant A Data is divided into 100 sec bins |
 |
 |
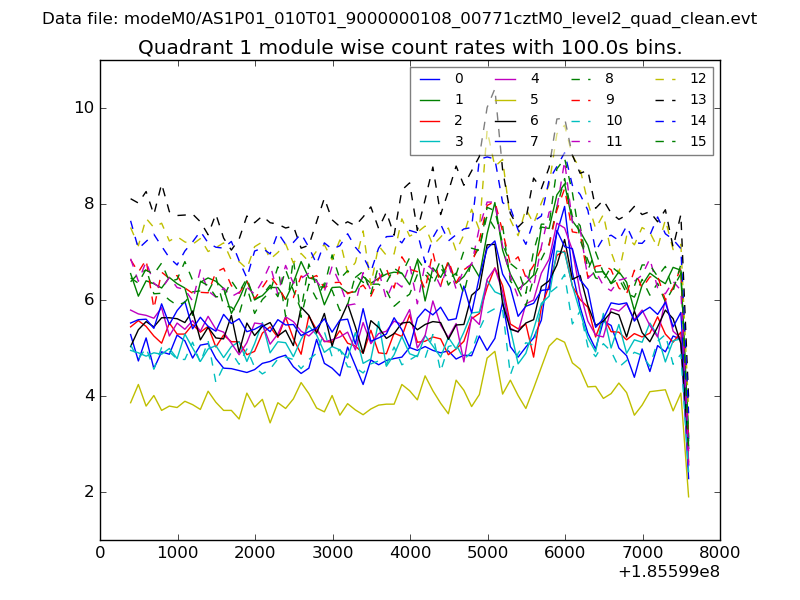
| Module-wise count rates for Quadrant B Data is divided into 100 sec bins |
 |
 |
| Module-wise count rates for Quadrant C Data is divided into 100 sec bins |
 |
 |
| Module-wise count rates for Quadrant D Data is divided into 100 sec bins |
 |
 |
| Parameter | Plot |
|---|---|
| CZT HV Monitor | 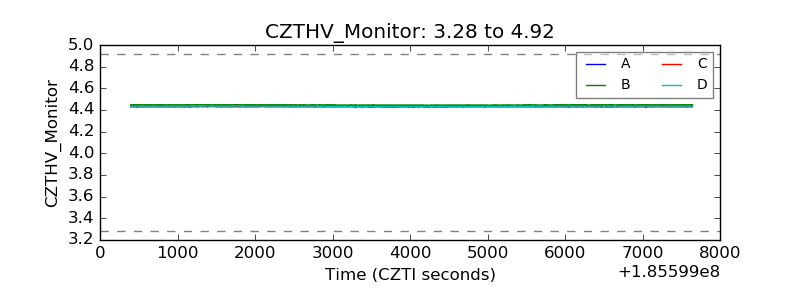 |
| D_VDD | 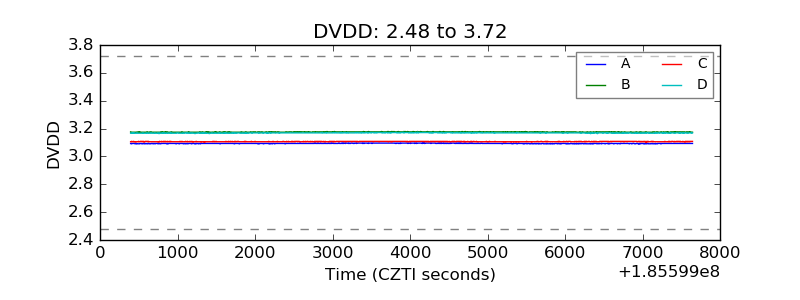 |
| Temperature 1 | 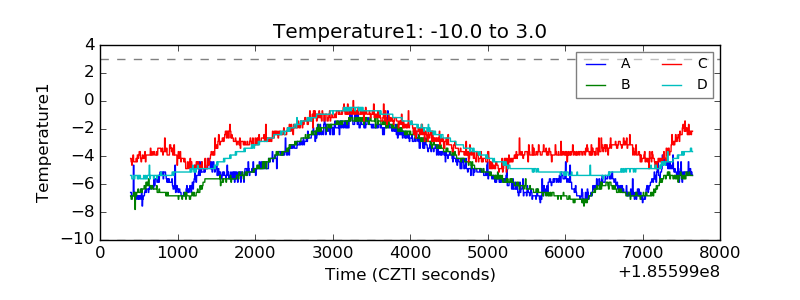 |
| Veto HV Monitor | 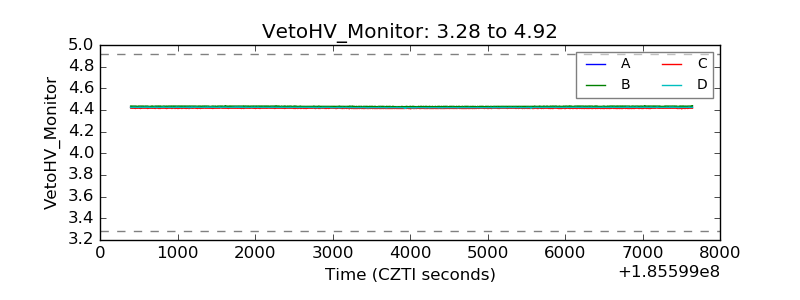 |
| Veto LLD | 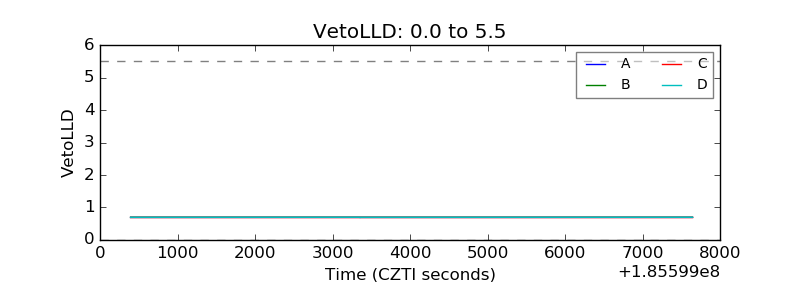 |
| Alpha Counter | 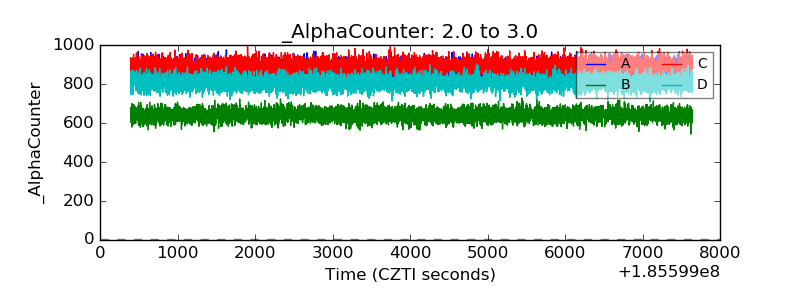 |
| _CPM_Rate | 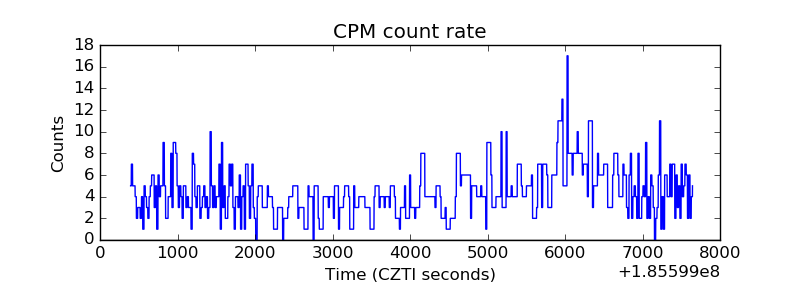 |
| CZT Counter | 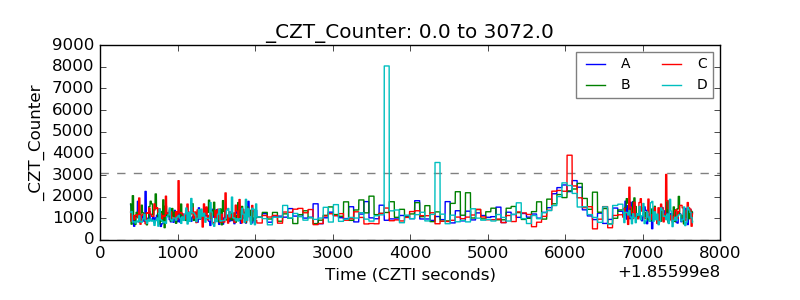 |
| +2.5 Volts monitor |  |
| +5 Volts monitor |  |
| _ROLL_ROT | 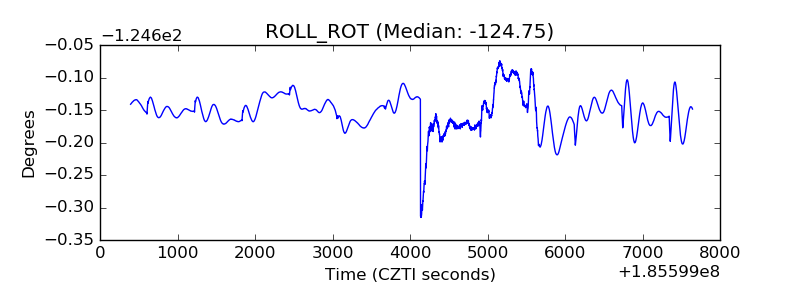 |
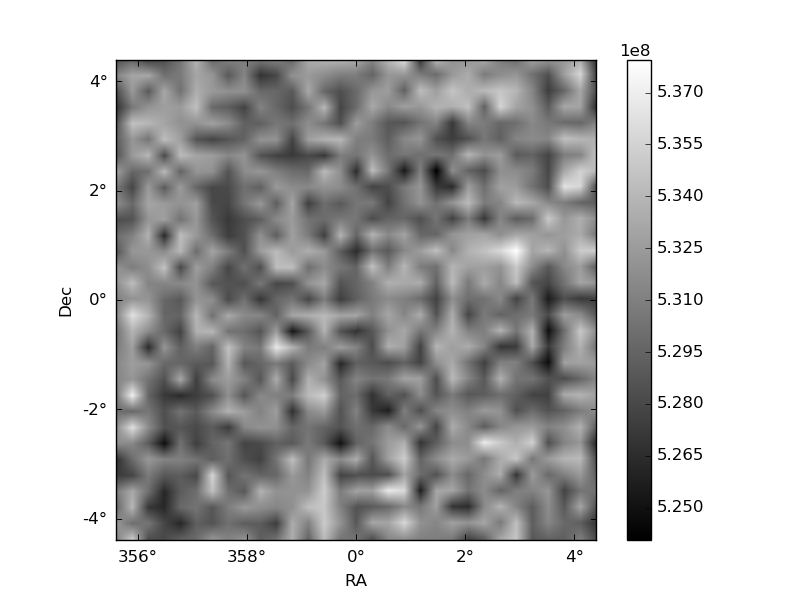
| _Roll_DEC | 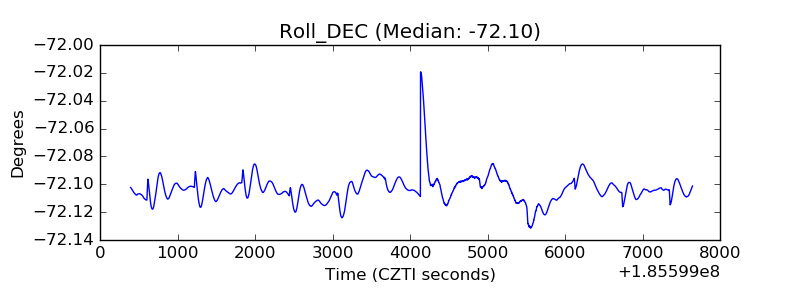 |
| _Roll_RA | 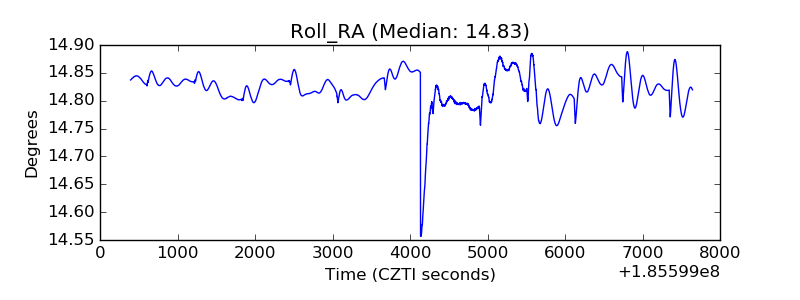 |
| Veto Counter | 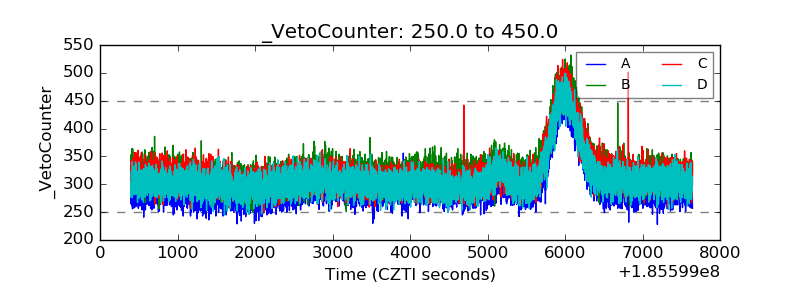 |