| Param | Original file | Final file |
|---|---|---|
| Filename | modeM0/AS1P01_010T01_9000000108_00772cztM0_level2.evt | modeM0/AS1P01_010T01_9000000108_00772cztM0_level2_quad_clean.evt |
| Size (bytes) | 1,250,481,600 | 107,170,560 |
| Size | 1.2 GB | 102.2 MB |
| Events in quadrant A | 9,135,297 | 691,898 |
| Events in quadrant B | 9,929,279 | 696,738 |
| Events in quadrant C | 9,183,189 | 683,449 |
| Events in quadrant D | 9,142,696 | 667,429 |
| Mode SS | |||
|---|---|---|---|
| Quadrant | BADHDUFLAG | Total packets | Discarded packets |
| A | 0 | 144 | 0 |
| B | 0 | 144 | 0 |
| C | 0 | 144 | 0 |
| D | 0 | 144 | 0 |
| Mode M0 | |||
|---|---|---|---|
| Quadrant | BADHDUFLAG | Total packets | Discarded packets |
| A | 0 | 32311 | 0 |
| B | 0 | 34648 | 0 |
| C | 0 | 32438 | 0 |
| D | 0 | 32313 | 0 |
| Quadrant | Total seconds | Saturated seconds | Saturation percentage |
|---|---|---|---|
| A | 7272 | 85 | 1.168867% |
| B | 7270 | 168 | 2.310867% |
| C | 7274 | 118 | 1.622216% |
| D | 7275 | 140 | 1.924399% |
Noise dominated data is calculated using 1-second bins in cleaned event files. If a bin has >2000 counts, and if more than 50% of those come from <1% of pixels, then it is considered to be noise-dominated and hence unusable.
| Quadrant | # 1 sec bins | Bins with >0 counts | Bins with >2000 counts | High rate bins dominated by noise | Noise dominated (total time) | Noise dominated (detector-on time) | Marked lightcurve |
|---|---|---|---|---|---|---|---|
| A | 7272 | 7272 | 449 | 449 | 6.17% | 6.17% | 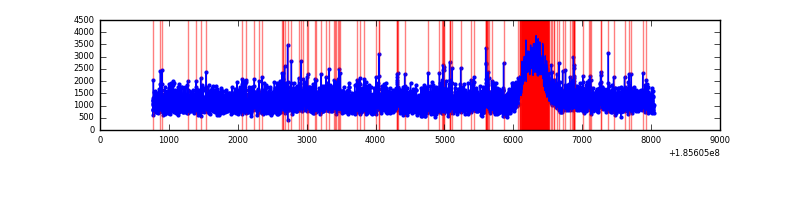 |
| B | 7273 | 7272 | 677 | 677 | 9.31% | 9.31% | 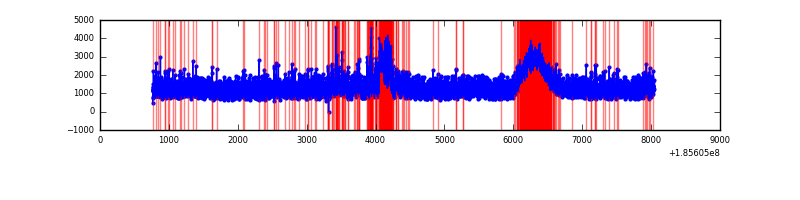 |
| C | 7418 | 7277 | 576 | 576 | 7.76% | 7.92% | 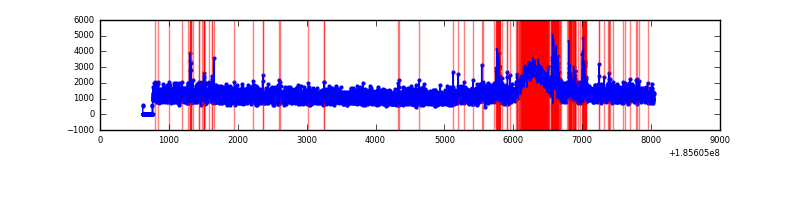 |
| D | 7275 | 7275 | 596 | 596 | 8.19% | 8.19% | 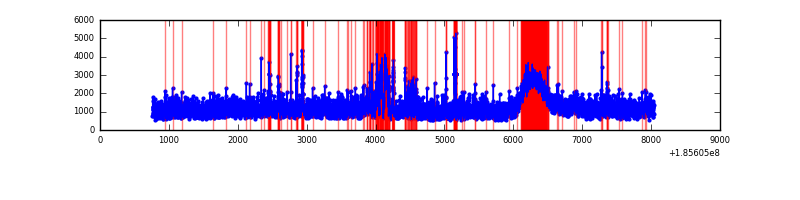 |
Top three noisy pixels from each quadrant. If the there are fewer than three noisy pixels in the level2.evt file, extra rows are filled as -1
| Pixel properties | Quadrant properties | ||||||
|---|---|---|---|---|---|---|---|
| Quadrant | DetID | PixID | Counts | Sigma | Mean | Median | Sigma |
| A | 8 | 192 | 119913 | 207.6 | 2316 | 2330 | 566.4 |
| A | 12 | 236 | 104701 | 180.75 | 2316 | 2330 | 566.4 |
| A | 0 | 117 | 13387 | 19.52 | 2316 | 2330 | 566.4 |
| B | 5 | 249 | 352356 | 613.68 | 2414 | 2415 | 570.2 |
| B | 7 | 221 | 187858 | 325.2 | 2414 | 2415 | 570.2 |
| B | 0 | 220 | 164106 | 283.55 | 2414 | 2415 | 570.2 |
| C | 10 | 17 | 343395 | 544.72 | 2217 | 2296 | 626.2 |
| C | 15 | 241 | 55219 | 84.52 | 2217 | 2296 | 626.2 |
| C | 3 | 111 | 42290 | 63.87 | 2217 | 2296 | 626.2 |
| D | 6 | 226 | 465911 | 694.66 | 2137 | 2208 | 667.5 |
| D | 12 | 33 | 264616 | 393.11 | 2137 | 2208 | 667.5 |
| D | 13 | 25 | 119705 | 176.02 | 2137 | 2208 | 667.5 |
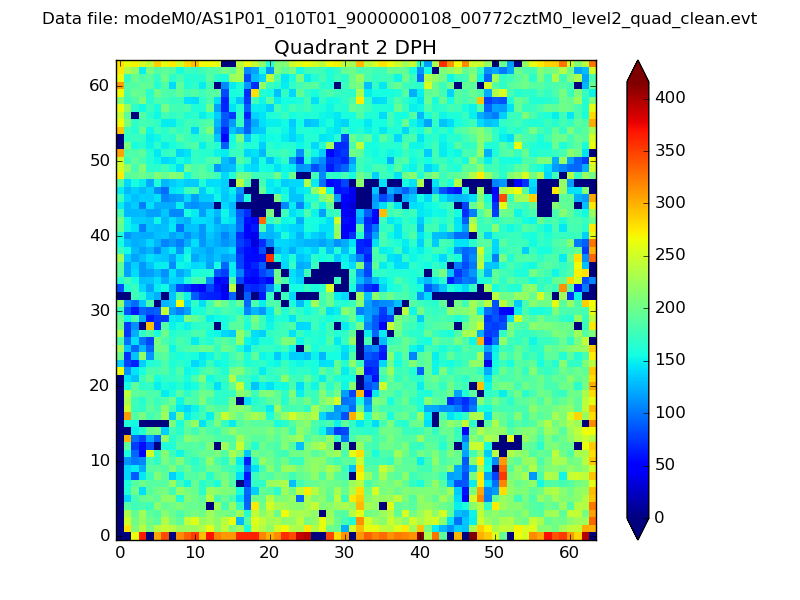
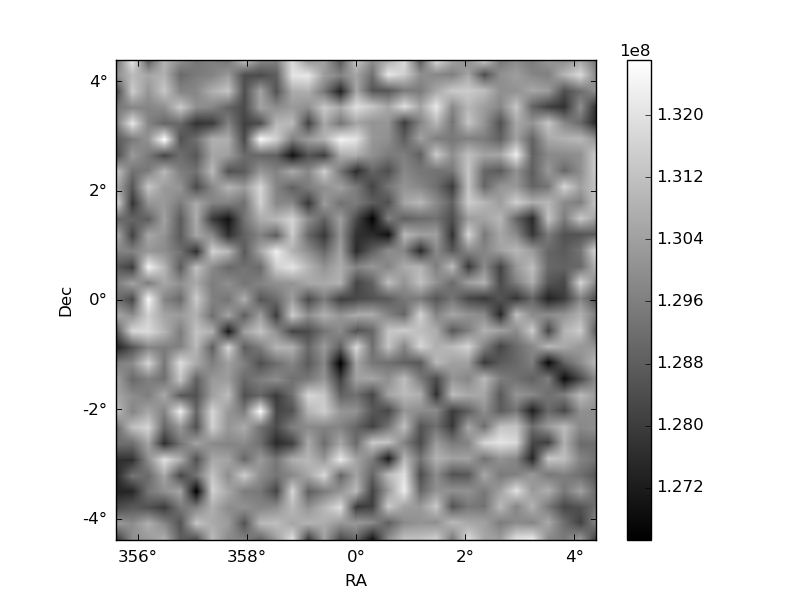
Histogram calculated using DETX and DETY for each event in the final _common_clean file
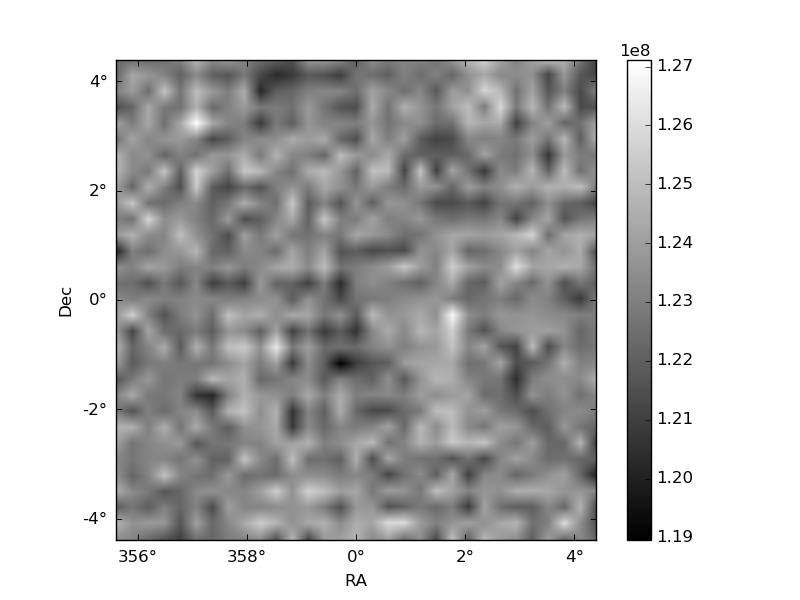
| Quadrant A | 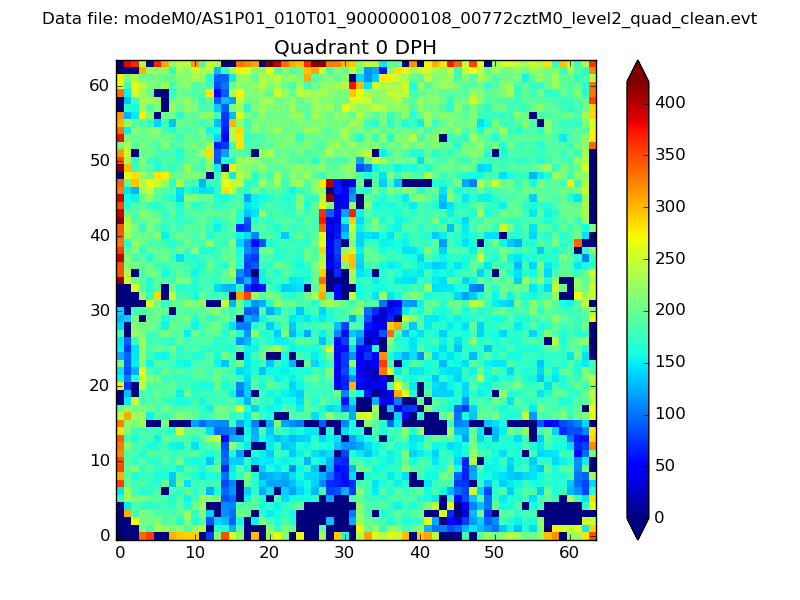 |
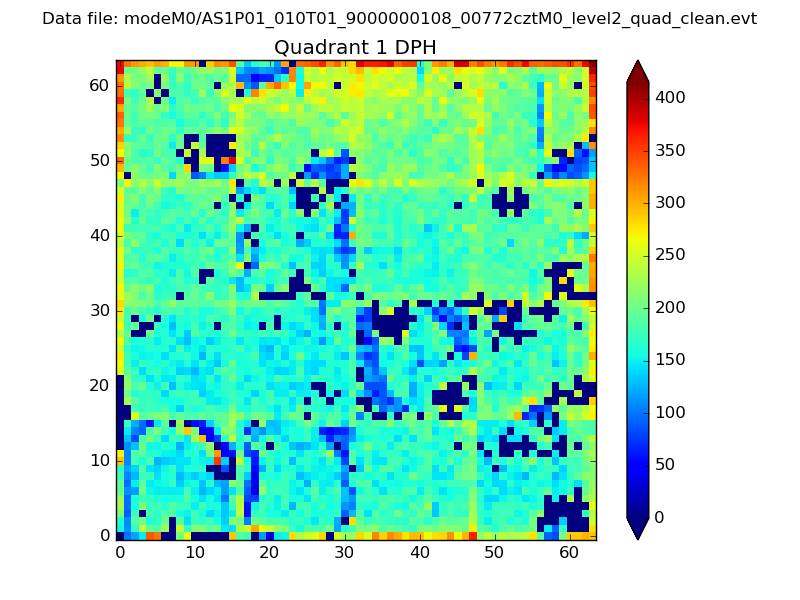 |
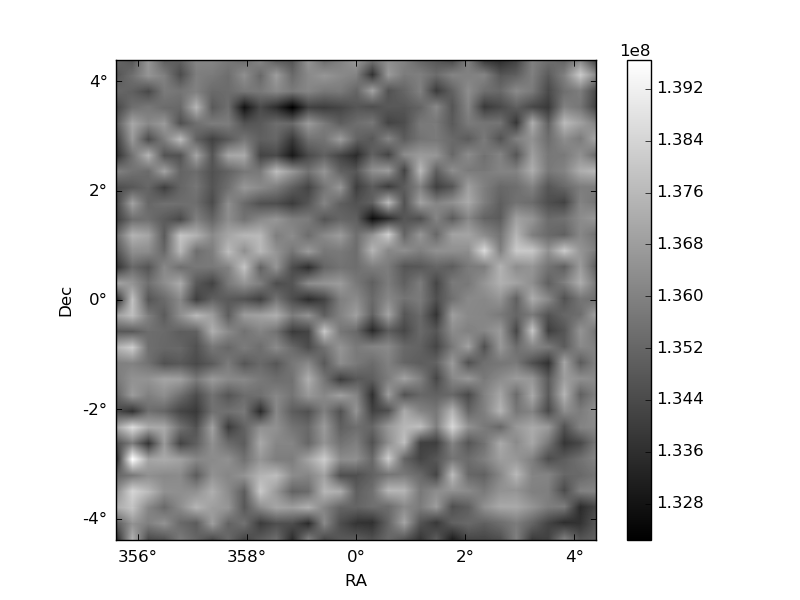
Quadrant B |
|---|---|---|---|
| Quadrant D | 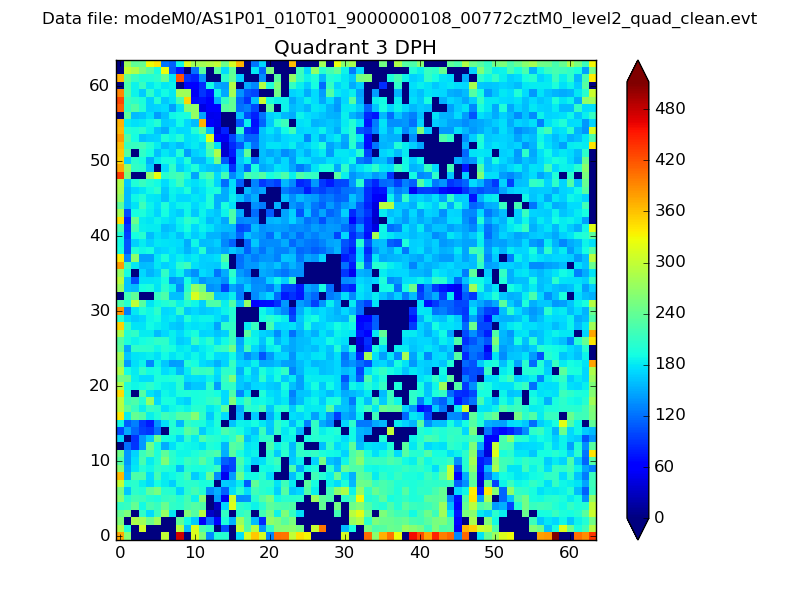 |
 |
Quadrant C |
| Plot type | Count rate plots | Images |
|---|---|---|
| Comparison with Poisson distribution Blue bars denote a histogram of data divided into 1 sec bins. Red curve is a Poisson curve with rate = median count rate of data. |
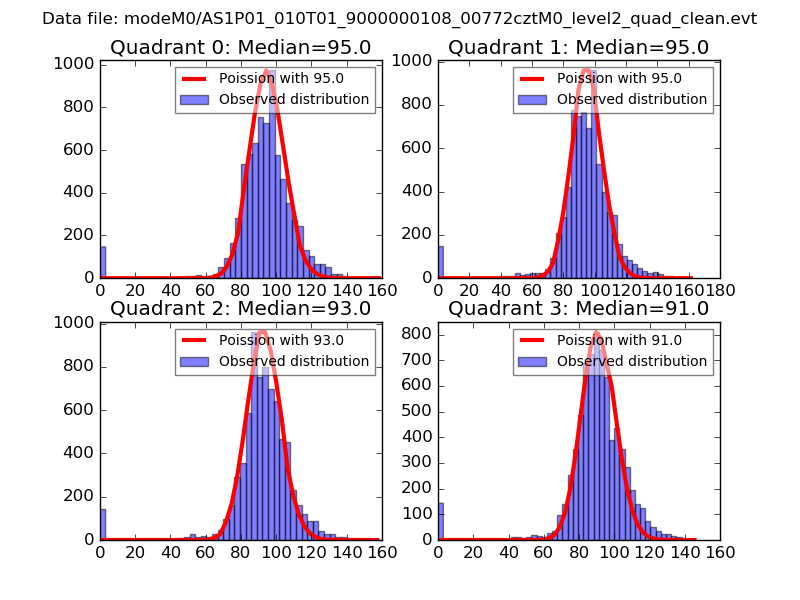 |
 |
| Quadrant-wise count rates Data is divided into 100 sec bins |
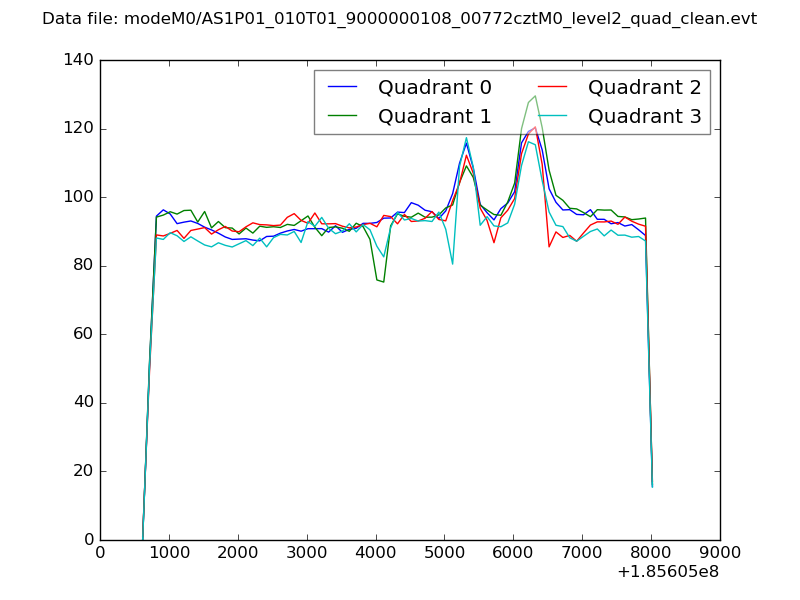 |
|
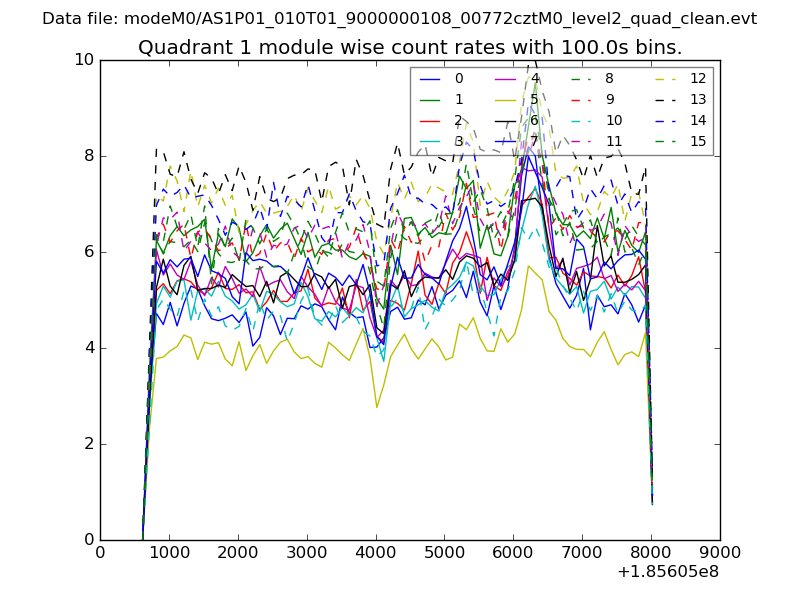
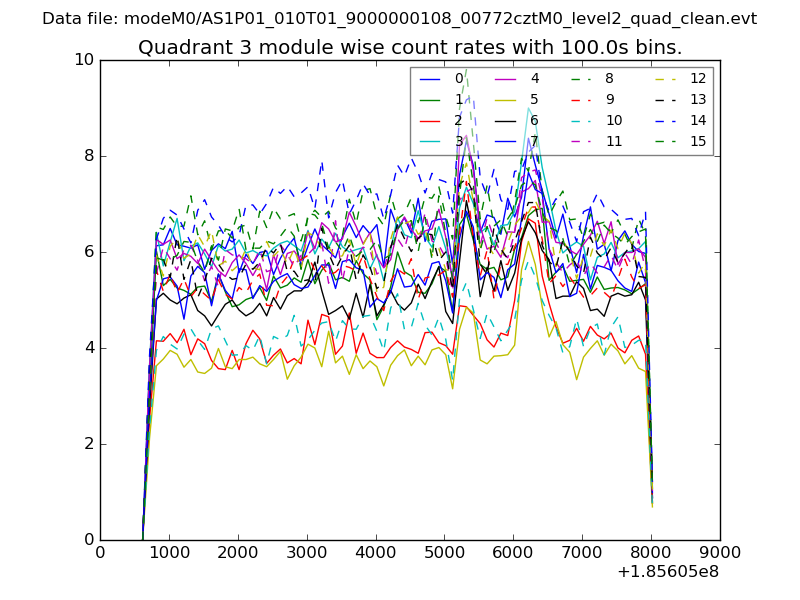
| Module-wise count rates for Quadrant A Data is divided into 100 sec bins |
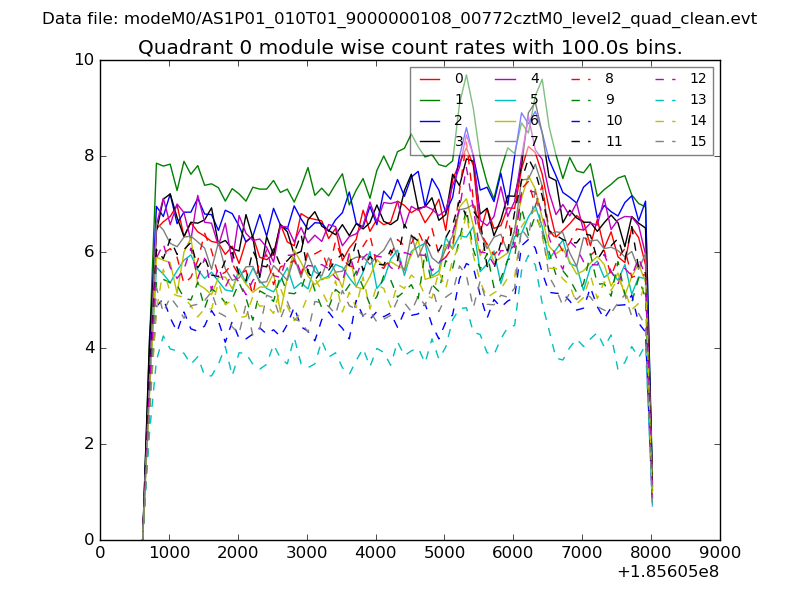 |
 |
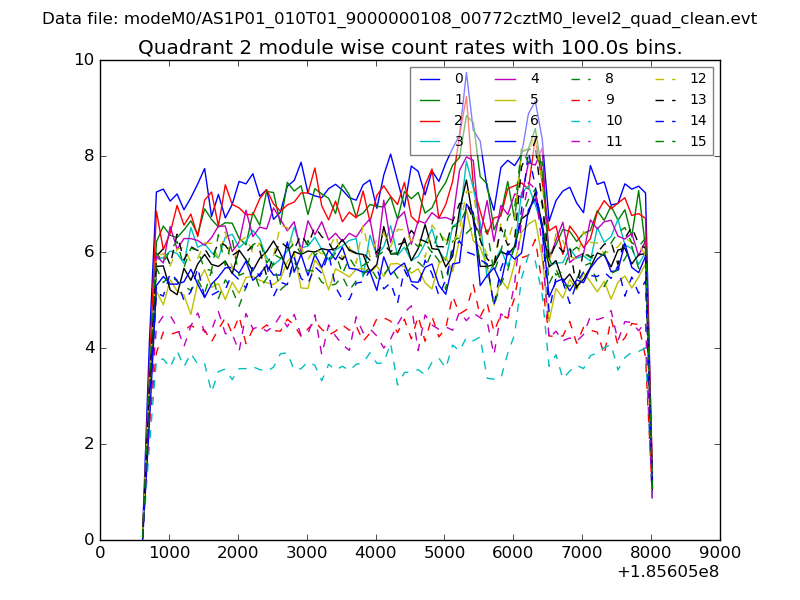
| Module-wise count rates for Quadrant B Data is divided into 100 sec bins |
 |
 |
| Module-wise count rates for Quadrant C Data is divided into 100 sec bins |
 |
 |
| Module-wise count rates for Quadrant D Data is divided into 100 sec bins |
 |
 |
| Parameter | Plot |
|---|---|
| CZT HV Monitor | 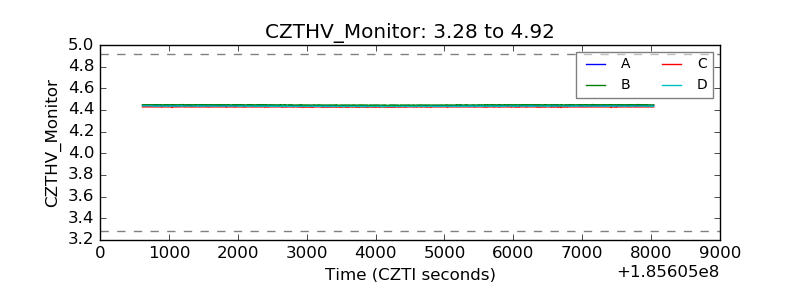 |
| D_VDD | 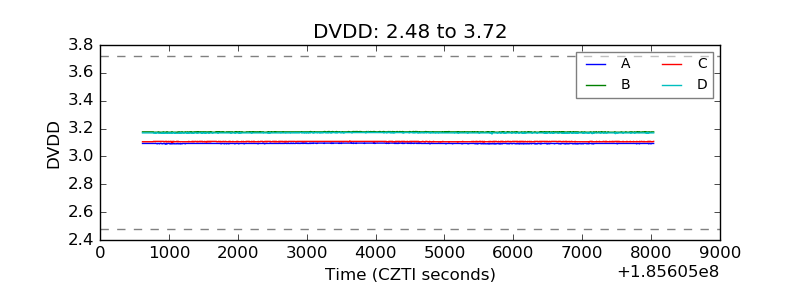 |
| Temperature 1 | 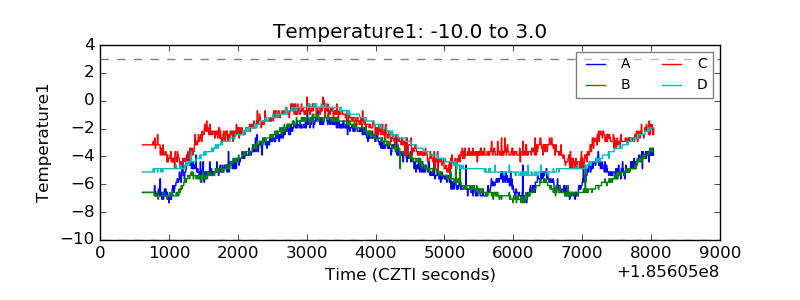 |
| Veto HV Monitor | 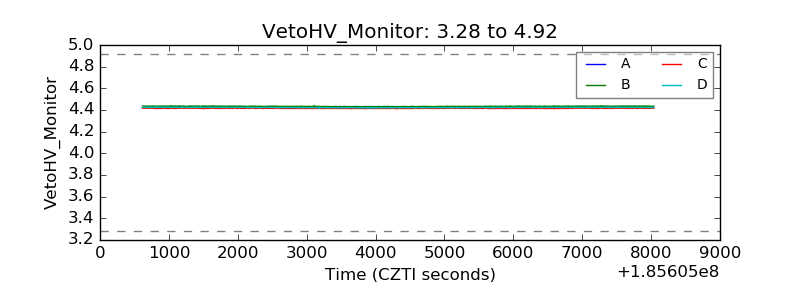 |
| Veto LLD | 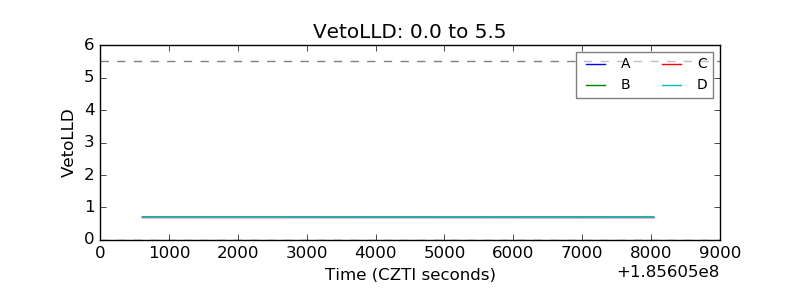 |
| Alpha Counter | 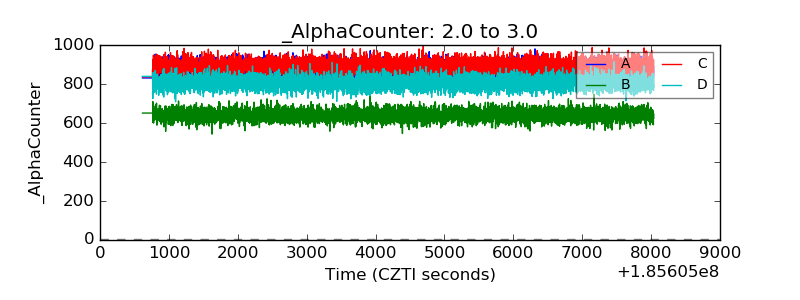 |
| _CPM_Rate | 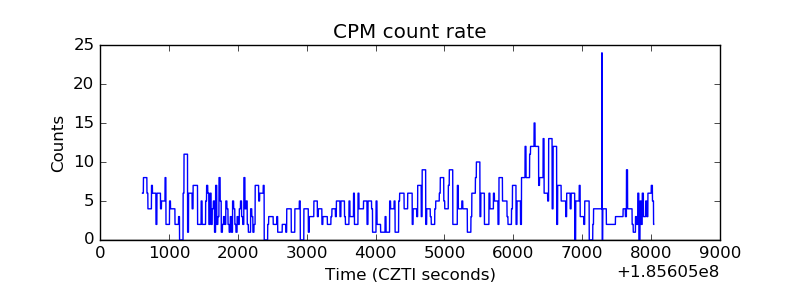 |
| CZT Counter | 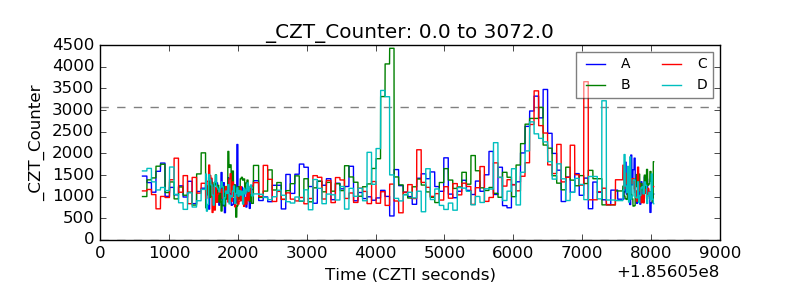 |
| +2.5 Volts monitor |  |
| +5 Volts monitor |  |
| _ROLL_ROT | 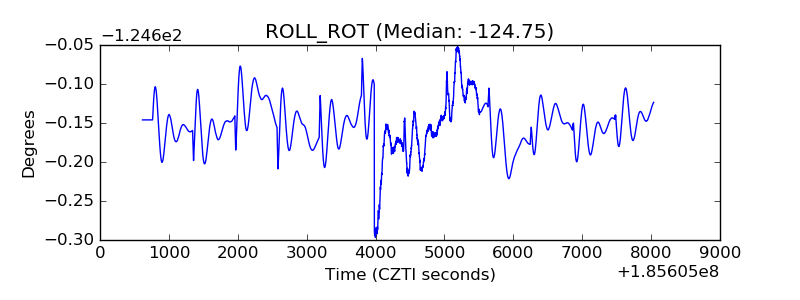 |
| _Roll_DEC | 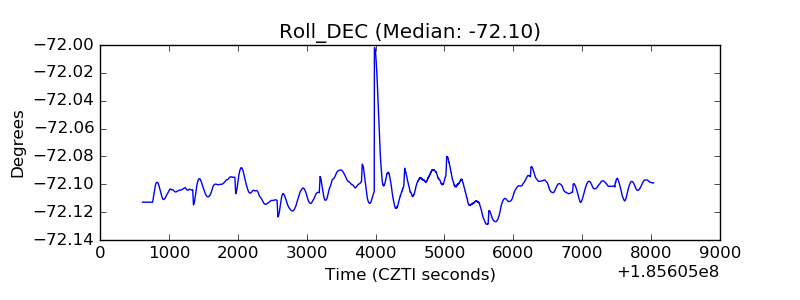 |
| _Roll_RA |  |
| Veto Counter | 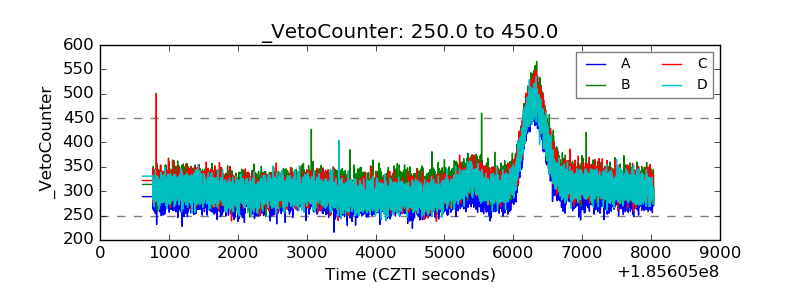 |