| Param | Original file | Final file |
|---|---|---|
| Filename | modeM0/AS1P01_010T01_9000000108_00773cztM0_level2.evt | modeM0/AS1P01_010T01_9000000108_00773cztM0_level2_quad_clean.evt |
| Size (bytes) | 1,169,976,960 | 103,654,080 |
| Size | 1.1 GB | 98.9 MB |
| Events in quadrant A | 8,591,167 | 664,259 |
| Events in quadrant B | 9,517,260 | 671,169 |
| Events in quadrant C | 8,570,348 | 664,068 |
| Events in quadrant D | 8,289,019 | 650,034 |
| Mode SS | |||
|---|---|---|---|
| Quadrant | BADHDUFLAG | Total packets | Discarded packets |
| A | 0 | 142 | 0 |
| B | 0 | 142 | 0 |
| C | 0 | 142 | 0 |
| D | 0 | 142 | 0 |
| Mode M0 | |||
|---|---|---|---|
| Quadrant | BADHDUFLAG | Total packets | Discarded packets |
| A | 0 | 30530 | 0 |
| B | 0 | 33248 | 0 |
| C | 0 | 30452 | 0 |
| D | 0 | 29670 | 0 |
| Mode M9 | |||
|---|---|---|---|
| Quadrant | BADHDUFLAG | Total packets | Discarded packets |
| A | 0 | 3 | 0 |
| B | 0 | 3 | 0 |
| C | 0 | 3 | 0 |
| D | 0 | 3 | 0 |
| Quadrant | Total seconds | Saturated seconds | Saturation percentage |
|---|---|---|---|
| A | 7029 | 113 | 1.607626% |
| B | 7029 | 148 | 2.105563% |
| C | 7028 | 108 | 1.536710% |
| D | 7028 | 120 | 1.707456% |
Noise dominated data is calculated using 1-second bins in cleaned event files. If a bin has >2000 counts, and if more than 50% of those come from <1% of pixels, then it is considered to be noise-dominated and hence unusable.
| Quadrant | # 1 sec bins | Bins with >0 counts | Bins with >2000 counts | High rate bins dominated by noise | Noise dominated (total time) | Noise dominated (detector-on time) | Marked lightcurve |
|---|---|---|---|---|---|---|---|
| A | 7314 | 7030 | 323 | 323 | 4.42% | 4.59% | 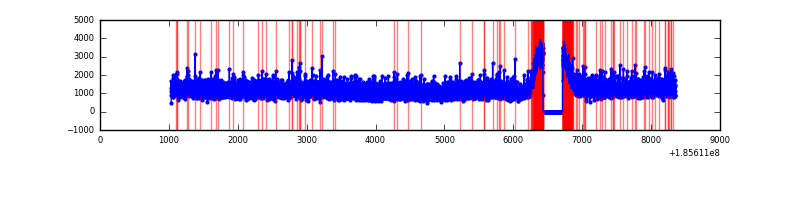 |
| B | 7314 | 7030 | 502 | 502 | 6.86% | 7.14% | 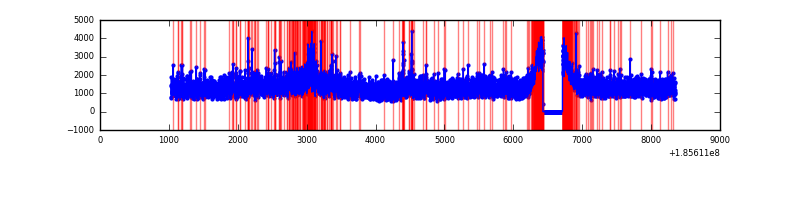 |
| C | 7313 | 7029 | 357 | 357 | 4.88% | 5.08% |  |
| D | 7313 | 7029 | 321 | 321 | 4.39% | 4.57% | 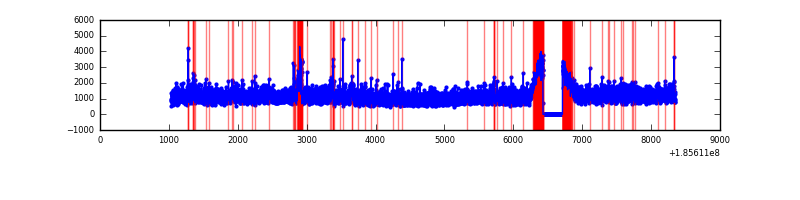 |
Top three noisy pixels from each quadrant. If the there are fewer than three noisy pixels in the level2.evt file, extra rows are filled as -1
| Pixel properties | Quadrant properties | ||||||
|---|---|---|---|---|---|---|---|
| Quadrant | DetID | PixID | Counts | Sigma | Mean | Median | Sigma |
| A | 12 | 236 | 22124 | 36.69 | 2227 | 2242 | 541.9 |
| A | 12 | 189 | 17797 | 28.7 | 2227 | 2242 | 541.9 |
| A | 11 | 79 | 9614 | 13.6 | 2227 | 2242 | 541.9 |
| B | 7 | 221 | 474249 | 862.09 | 2303 | 2306 | 547.4 |
| B | 0 | 220 | 163970 | 295.31 | 2303 | 2306 | 547.4 |
| B | 8 | 234 | 80426 | 142.7 | 2303 | 2306 | 547.4 |
| C | 10 | 17 | 140666 | 232.32 | 2114 | 2188 | 596.1 |
| C | 15 | 241 | 54320 | 87.46 | 2114 | 2188 | 596.1 |
| C | 9 | 68 | 49737 | 79.77 | 2114 | 2188 | 596.1 |
| D | 6 | 226 | 241094 | 370.68 | 2067 | 2135 | 644.6 |
| D | 1 | 4 | 141314 | 215.9 | 2067 | 2135 | 644.6 |
| D | 13 | 25 | 103901 | 157.86 | 2067 | 2135 | 644.6 |
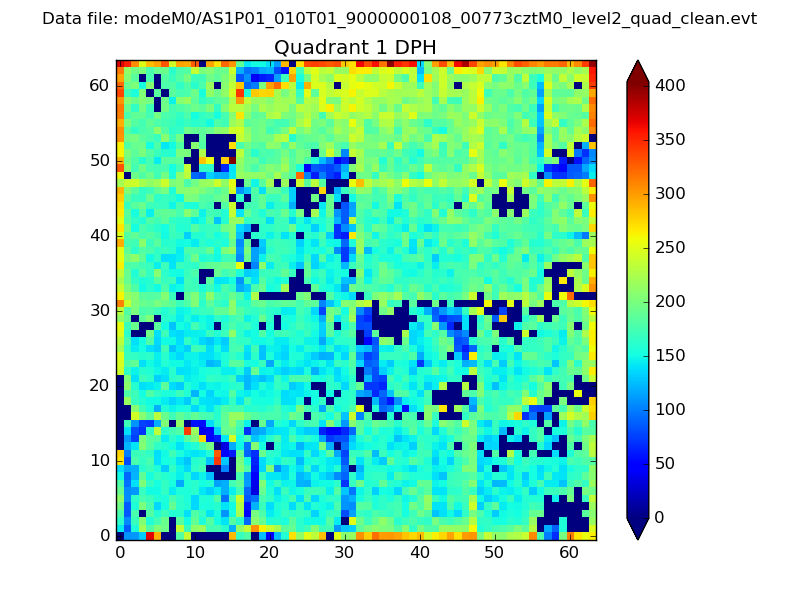
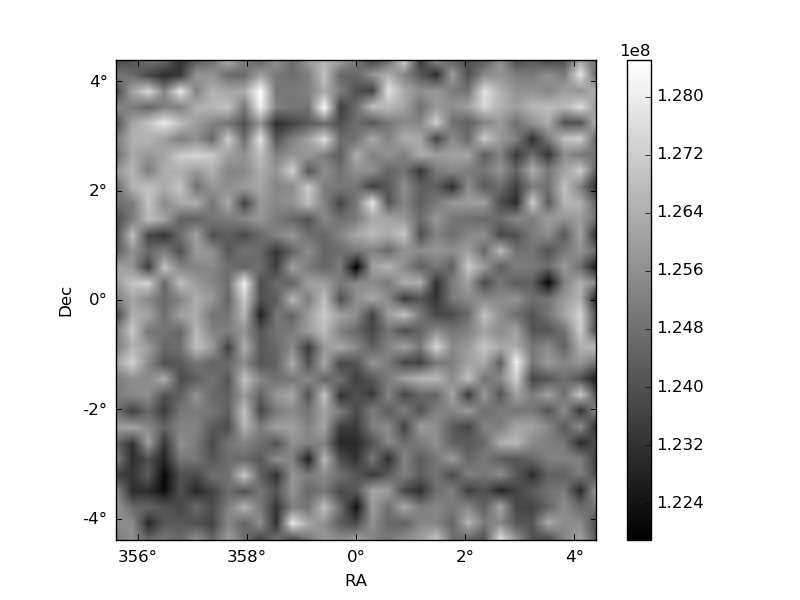
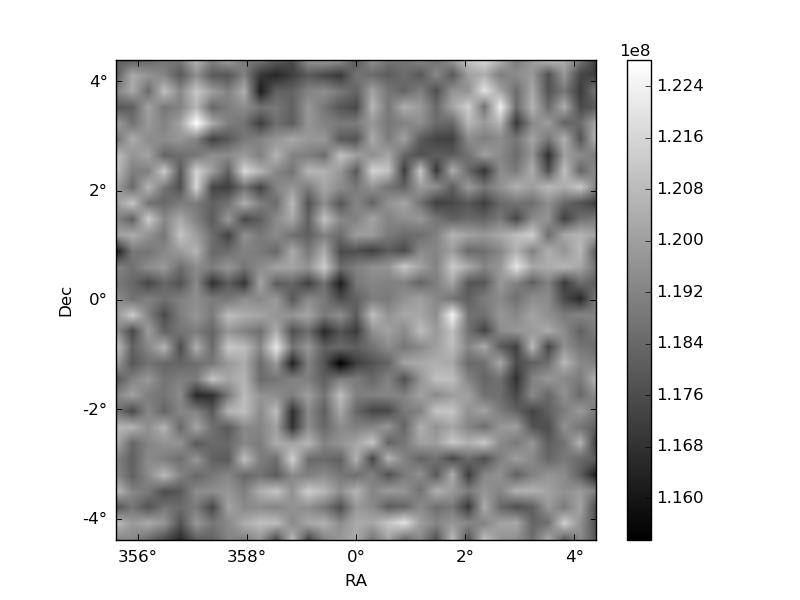
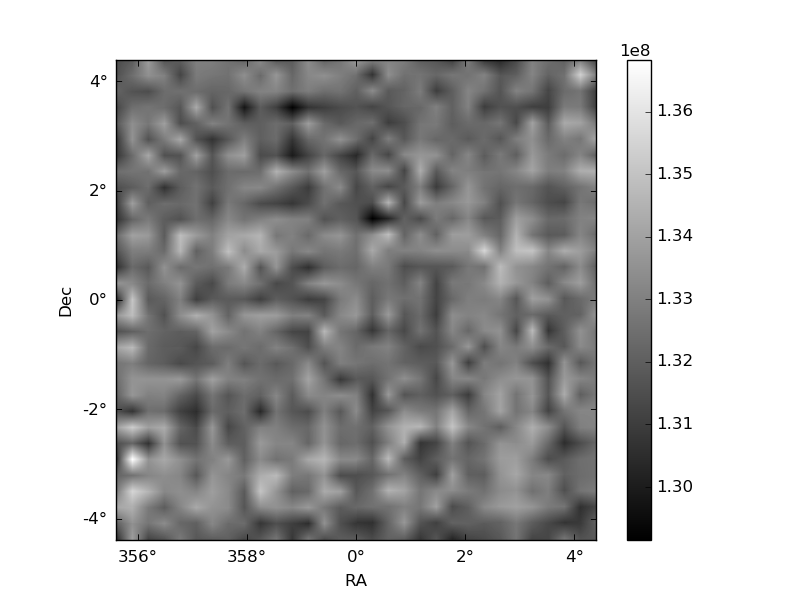
Histogram calculated using DETX and DETY for each event in the final _common_clean file
| Quadrant A | 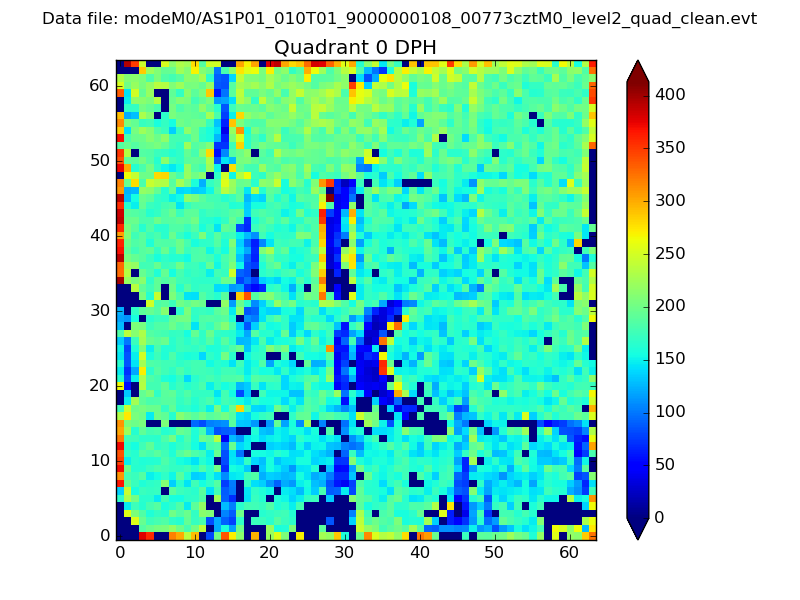 |
 |
Quadrant B |
|---|---|---|---|
| Quadrant D | 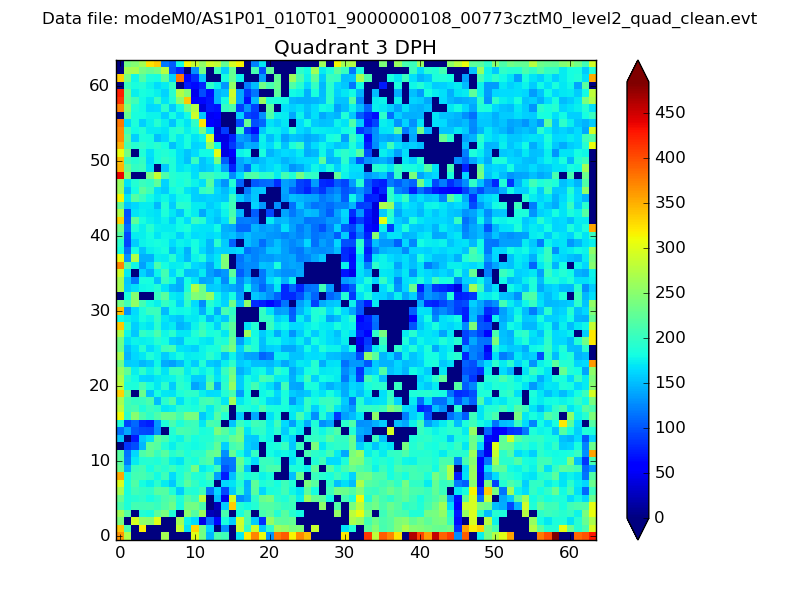 |
 |
Quadrant C |
| Plot type | Count rate plots | Images |
|---|---|---|
| Comparison with Poisson distribution Blue bars denote a histogram of data divided into 1 sec bins. Red curve is a Poisson curve with rate = median count rate of data. |
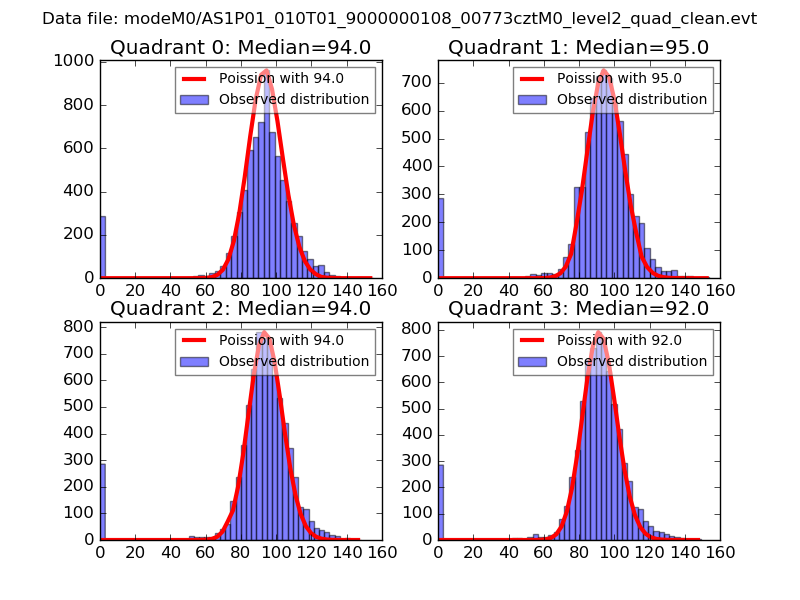 |
 |
| Quadrant-wise count rates Data is divided into 100 sec bins |
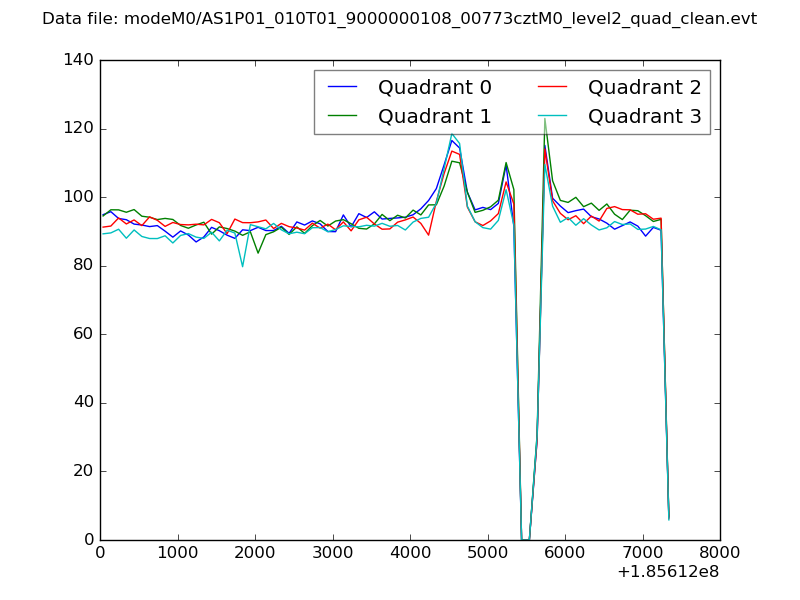 |
|
| Module-wise count rates for Quadrant A Data is divided into 100 sec bins |
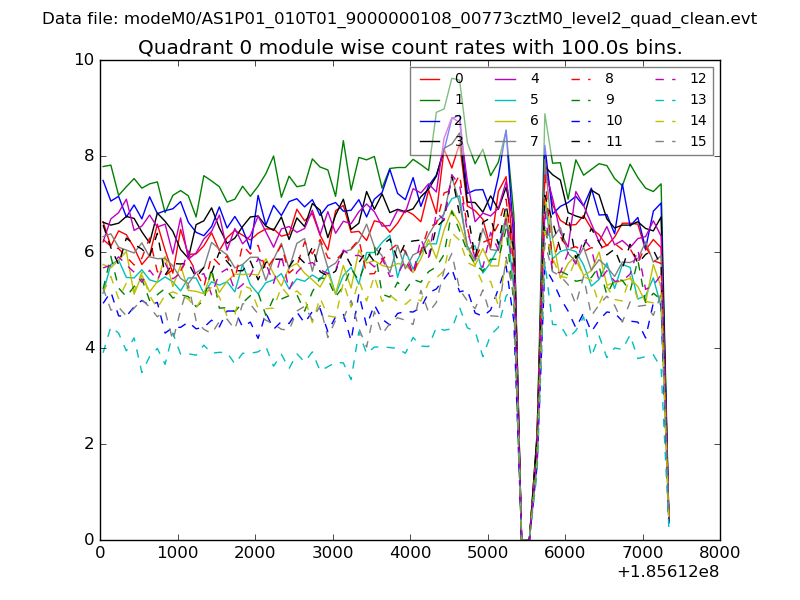 |
 |
| Module-wise count rates for Quadrant B Data is divided into 100 sec bins |
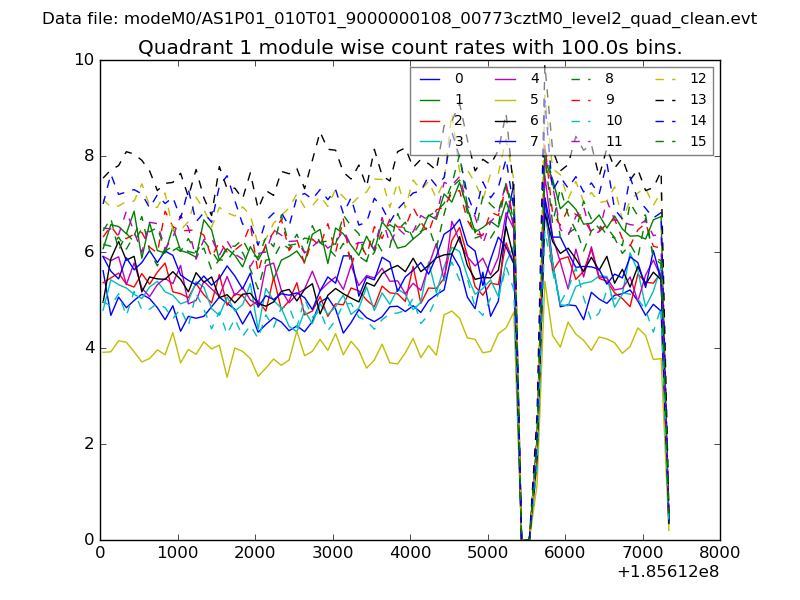 |
 |
| Module-wise count rates for Quadrant C Data is divided into 100 sec bins |
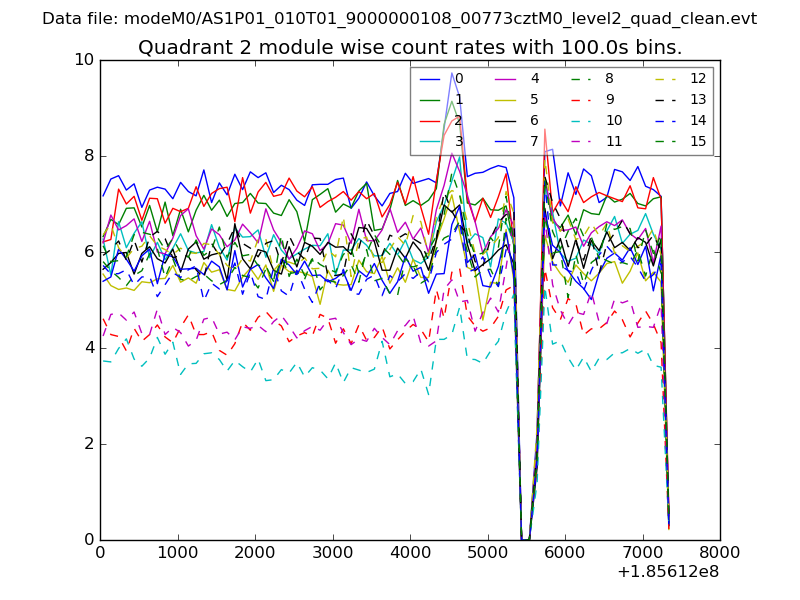 |
 |
| Module-wise count rates for Quadrant D Data is divided into 100 sec bins |
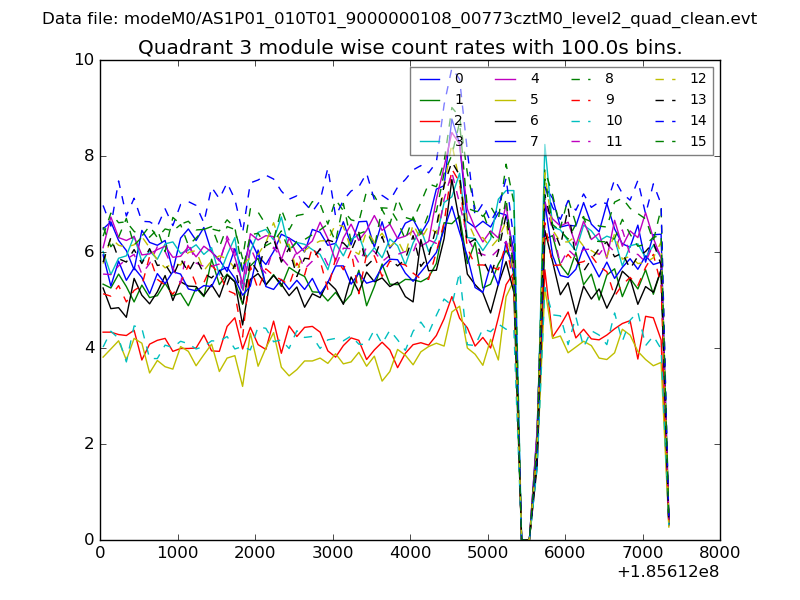 |
 |
| Parameter | Plot |
|---|---|
| CZT HV Monitor | 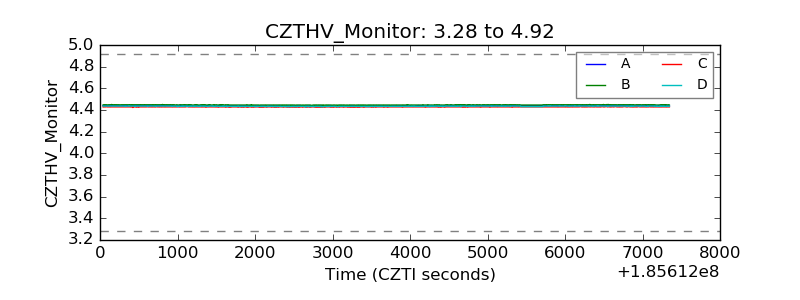 |
| D_VDD | 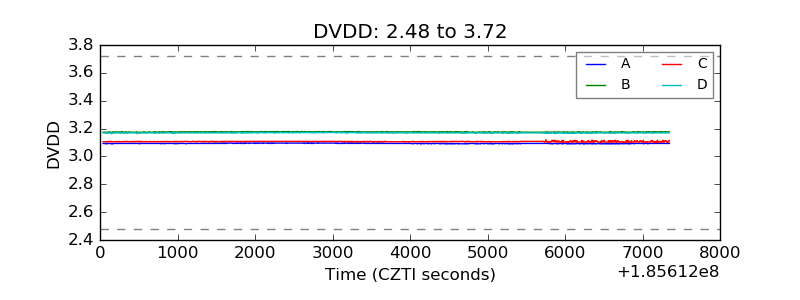 |
| Temperature 1 | 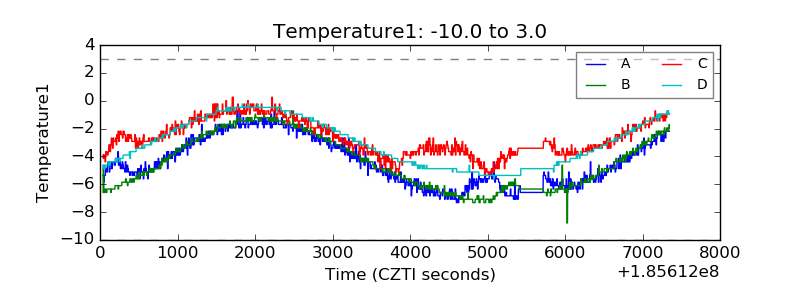 |
| Veto HV Monitor | 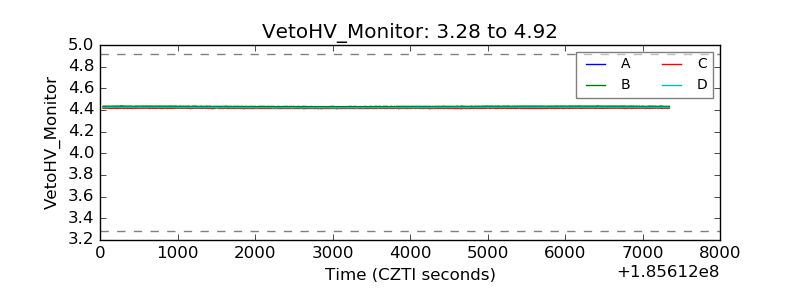 |
| Veto LLD | 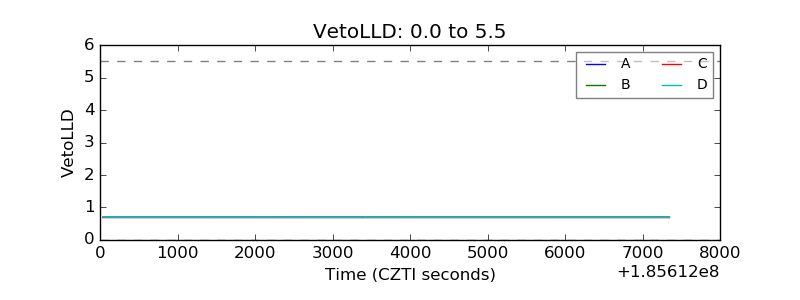 |
| Alpha Counter | 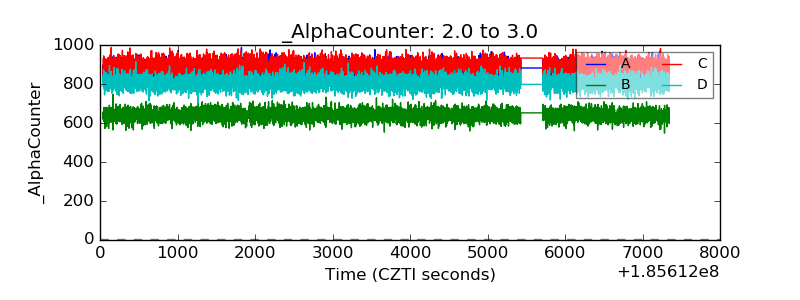 |
| _CPM_Rate | 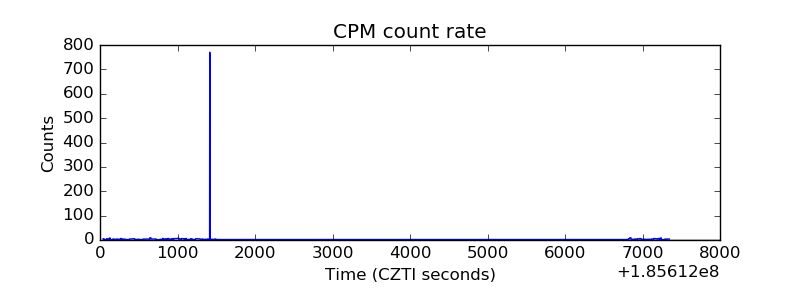 |
| CZT Counter |  |
| +2.5 Volts monitor | 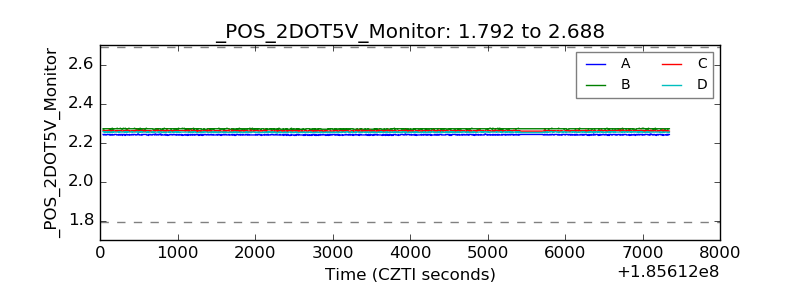 |
| +5 Volts monitor |  |
| _ROLL_ROT | 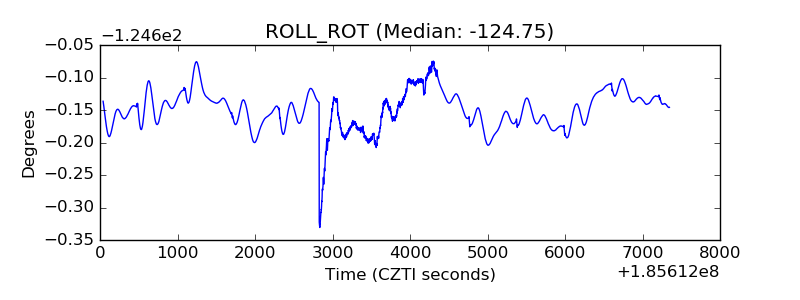 |
| _Roll_DEC | 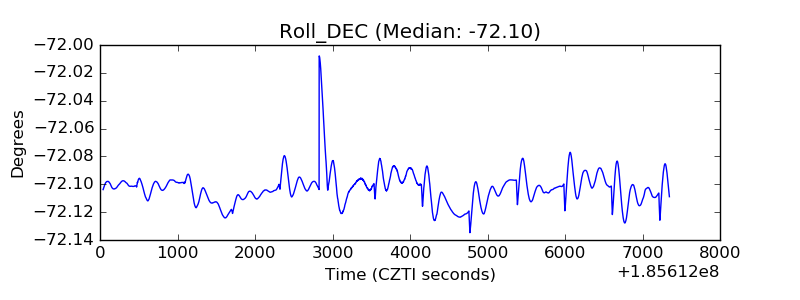 |
| _Roll_RA | 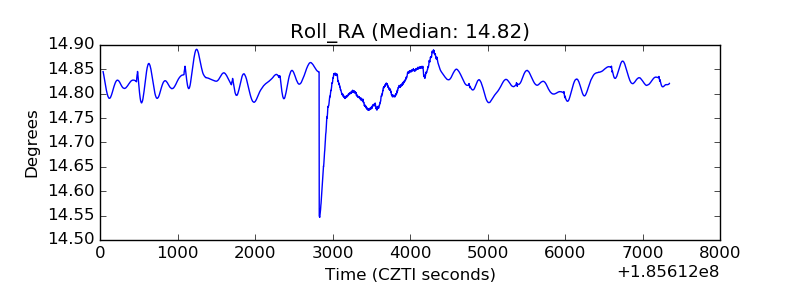 |
| Veto Counter | 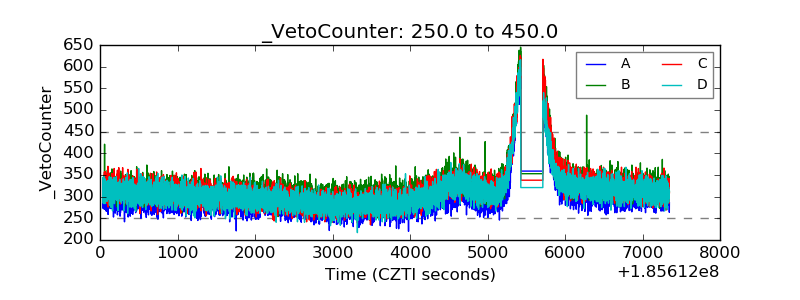 |