| Param | Original file | Final file |
|---|---|---|
| Filename | modeM0/AS1P01_010T01_9000000108_00775cztM0_level2.evt | modeM0/AS1P01_010T01_9000000108_00775cztM0_level2_quad_clean.evt |
| Size (bytes) | 1,491,969,600 | 137,580,480 |
| Size | 1.4 GB | 131.2 MB |
| Events in quadrant A | 11,173,149 | 881,794 |
| Events in quadrant B | 11,943,163 | 886,666 |
| Events in quadrant C | 10,834,356 | 881,138 |
| Events in quadrant D | 10,607,683 | 861,457 |
| Mode SS | |||
|---|---|---|---|
| Quadrant | BADHDUFLAG | Total packets | Discarded packets |
| A | 0 | 190 | 0 |
| B | 0 | 190 | 0 |
| C | 0 | 190 | 0 |
| D | 0 | 190 | 0 |
| Mode M0 | |||
|---|---|---|---|
| Quadrant | BADHDUFLAG | Total packets | Discarded packets |
| A | 0 | 39914 | 0 |
| B | 0 | 42158 | 0 |
| C | 0 | 38966 | 0 |
| D | 0 | 38311 | 0 |
| Mode M9 | |||
|---|---|---|---|
| Quadrant | BADHDUFLAG | Total packets | Discarded packets |
| A | 0 | 6 | 0 |
| B | 0 | 6 | 0 |
| C | 0 | 6 | 0 |
| D | 0 | 6 | 0 |
| Quadrant | Total seconds | Saturated seconds | Saturation percentage |
|---|---|---|---|
| A | 9461 | 74 | 0.782158% |
| B | 9461 | 99 | 1.046401% |
| C | 9461 | 68 | 0.718740% |
| D | 9461 | 154 | 1.627735% |
Noise dominated data is calculated using 1-second bins in cleaned event files. If a bin has >2000 counts, and if more than 50% of those come from <1% of pixels, then it is considered to be noise-dominated and hence unusable.
| Quadrant | # 1 sec bins | Bins with >0 counts | Bins with >2000 counts | High rate bins dominated by noise | Noise dominated (total time) | Noise dominated (detector-on time) | Marked lightcurve |
|---|---|---|---|---|---|---|---|
| A | 10046 | 9462 | 262 | 262 | 2.61% | 2.77% | 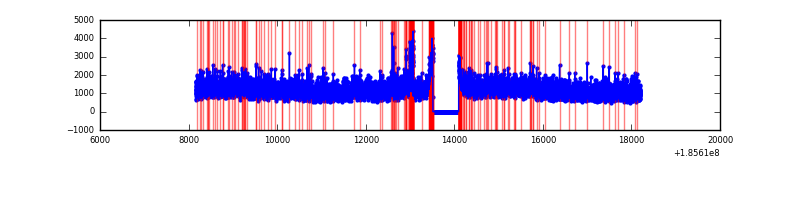 |
| B | 10046 | 9462 | 407 | 407 | 4.05% | 4.30% | 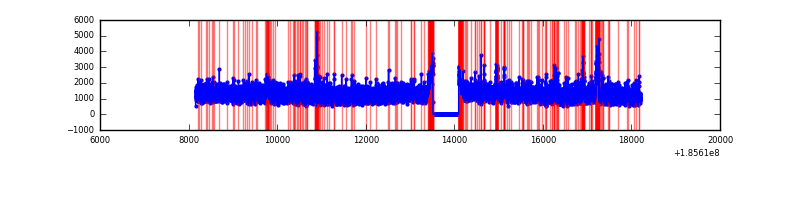 |
| C | 10046 | 9462 | 281 | 281 | 2.80% | 2.97% | 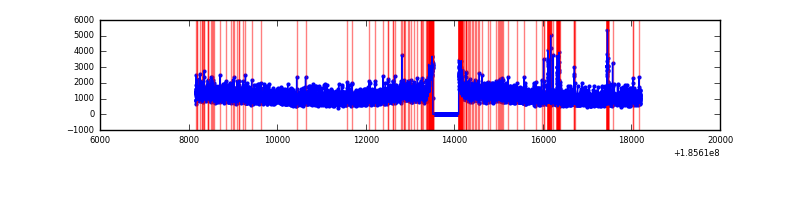 |
| D | 10046 | 9462 | 318 | 318 | 3.17% | 3.36% | 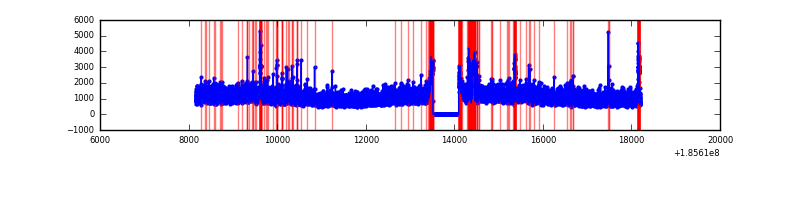 |
Top three noisy pixels from each quadrant. If the there are fewer than three noisy pixels in the level2.evt file, extra rows are filled as -1
| Pixel properties | Quadrant properties | ||||||
|---|---|---|---|---|---|---|---|
| Quadrant | DetID | PixID | Counts | Sigma | Mean | Median | Sigma |
| A | 0 | 117 | 166355 | 238.36 | 2838 | 2857 | 685.9 |
| A | 13 | 164 | 71867 | 100.61 | 2838 | 2857 | 685.9 |
| A | 15 | 171 | 26991 | 35.18 | 2838 | 2857 | 685.9 |
| B | 7 | 221 | 340184 | 483.59 | 2945 | 2953 | 697.4 |
| B | 0 | 220 | 220750 | 312.32 | 2945 | 2953 | 697.4 |
| B | 0 | 245 | 55947 | 75.99 | 2945 | 2953 | 697.4 |
| C | 10 | 17 | 314715 | 426.35 | 2630 | 2715 | 731.8 |
| C | 15 | 241 | 69248 | 90.92 | 2630 | 2715 | 731.8 |
| C | 10 | 207 | 63481 | 83.04 | 2630 | 2715 | 731.8 |
| D | 13 | 25 | 288918 | 358.82 | 2573 | 2665 | 797.8 |
| D | 10 | 157 | 175842 | 217.08 | 2573 | 2665 | 797.8 |
| D | 1 | 4 | 171270 | 211.35 | 2573 | 2665 | 797.8 |
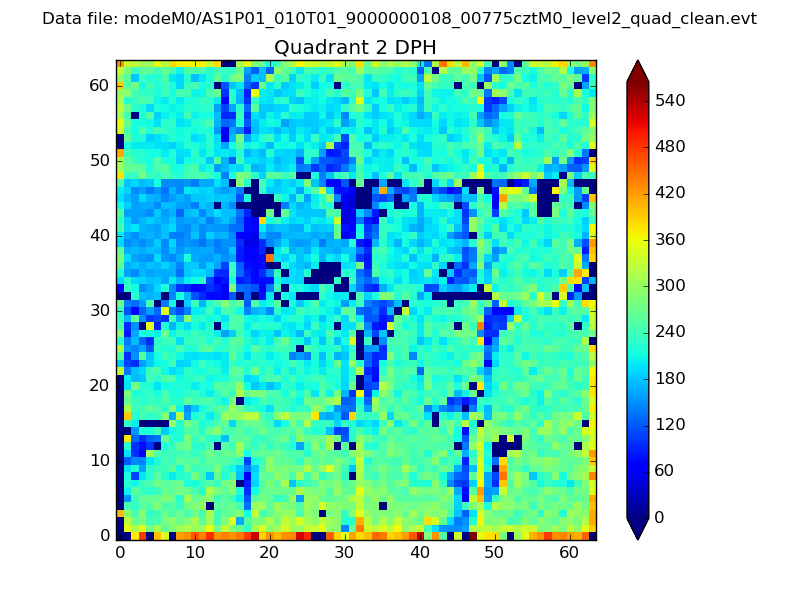
Histogram calculated using DETX and DETY for each event in the final _common_clean file
| Quadrant A | 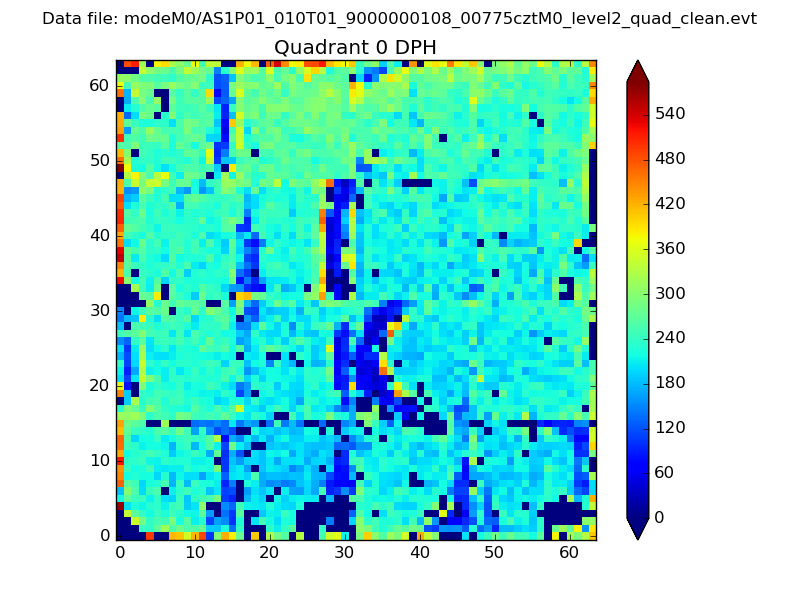 |
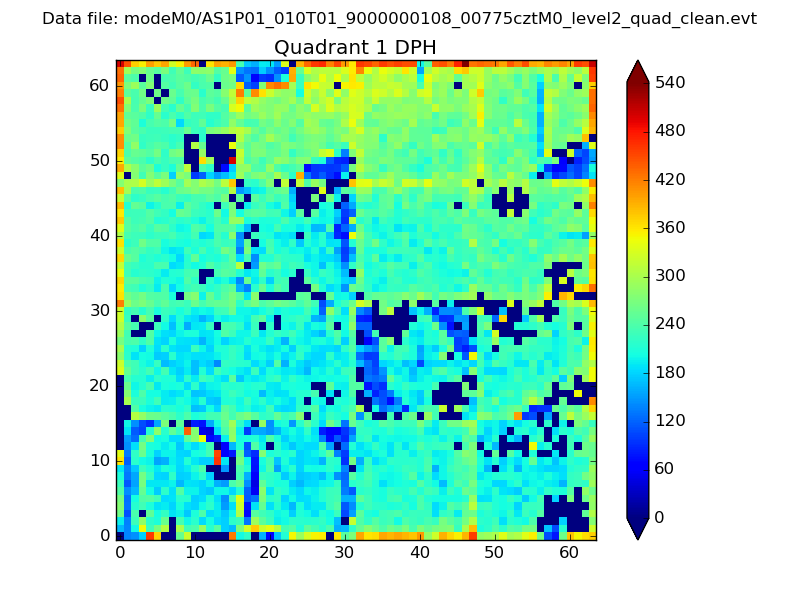 |
Quadrant B |
|---|---|---|---|
| Quadrant D | 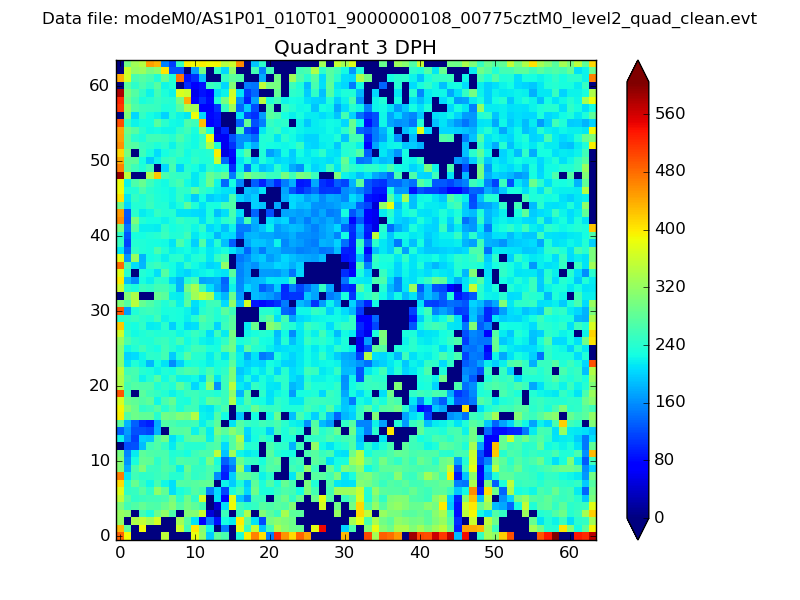 |
 |
Quadrant C |
| Plot type | Count rate plots | Images |
|---|---|---|
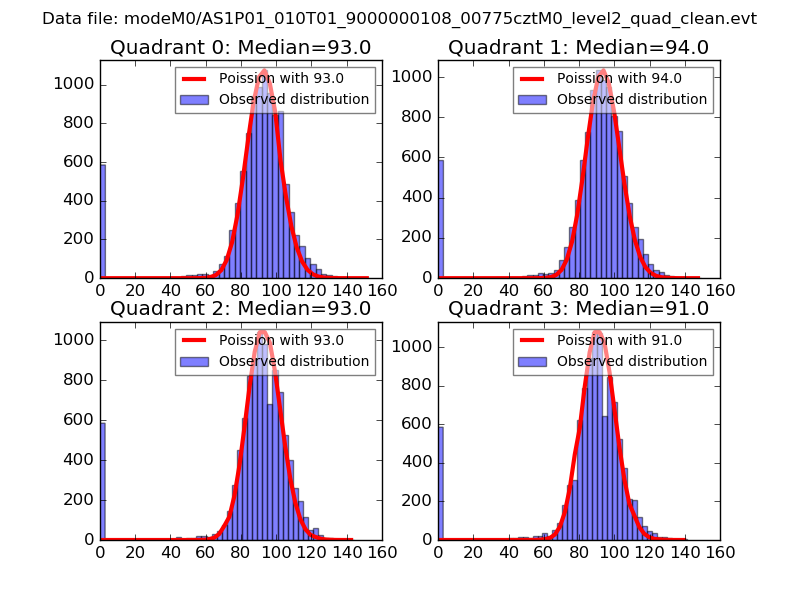
| Comparison with Poisson distribution Blue bars denote a histogram of data divided into 1 sec bins. Red curve is a Poisson curve with rate = median count rate of data. |
 |
 |
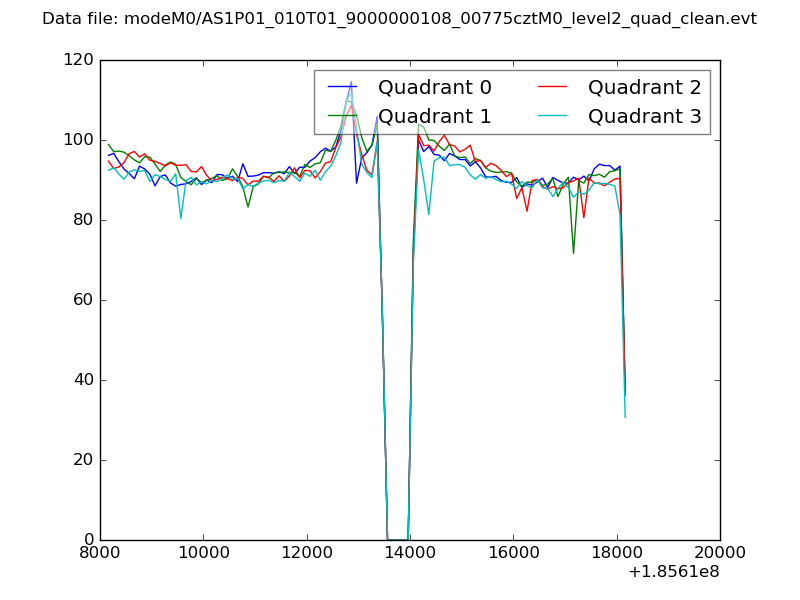
| Quadrant-wise count rates Data is divided into 100 sec bins |
 |
|
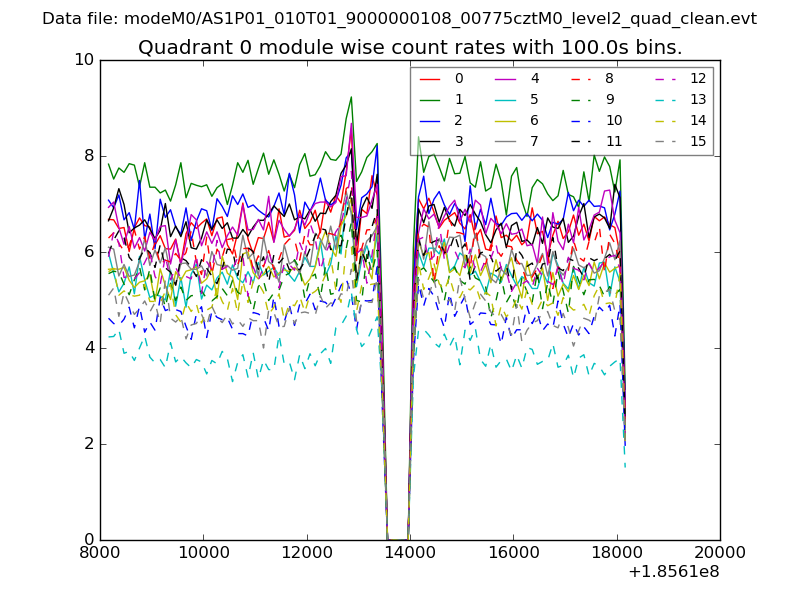
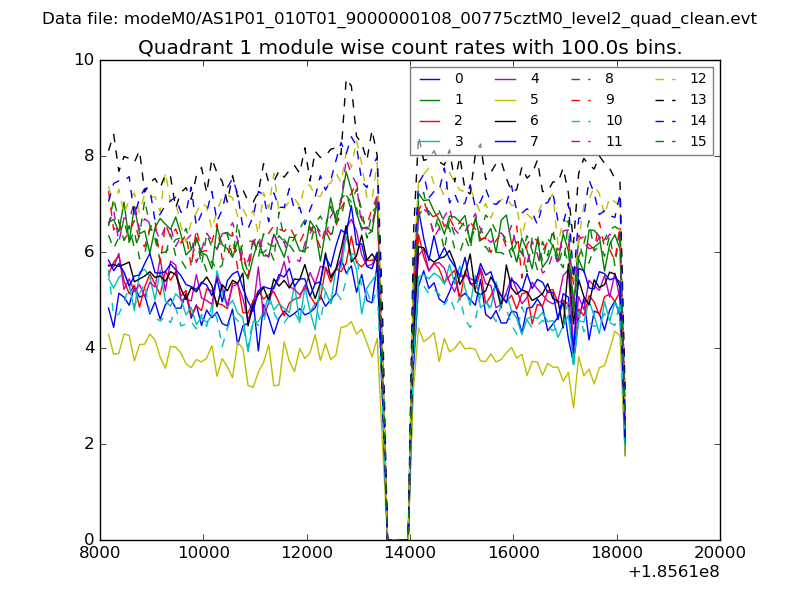
| Module-wise count rates for Quadrant A Data is divided into 100 sec bins |
 |
 |
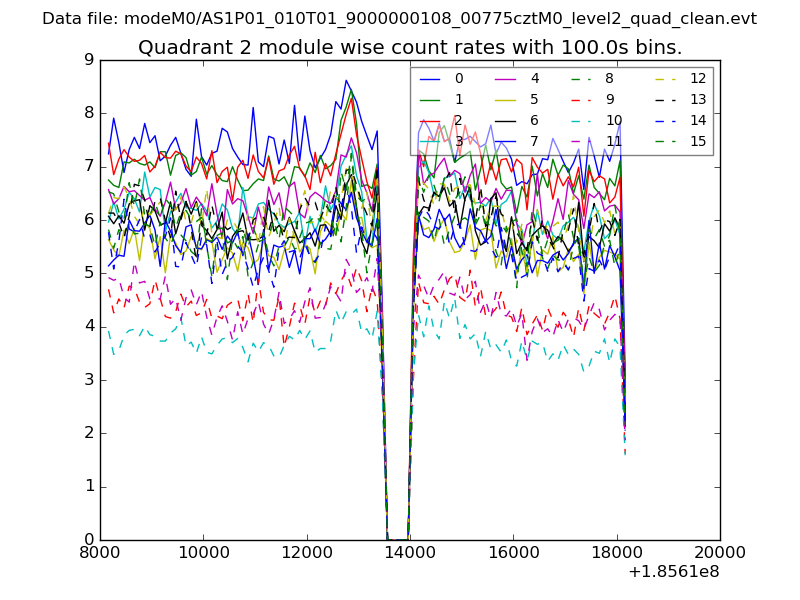
| Module-wise count rates for Quadrant B Data is divided into 100 sec bins |
 |
 |
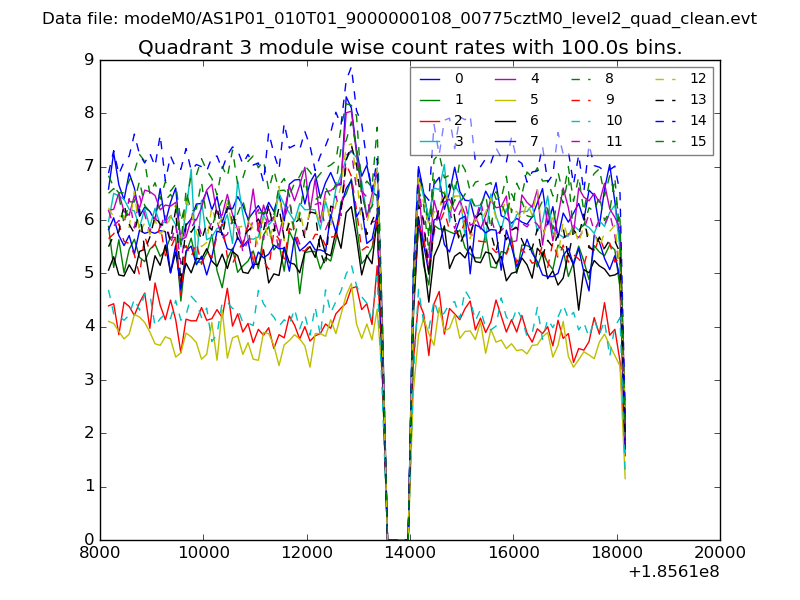
| Module-wise count rates for Quadrant C Data is divided into 100 sec bins |
 |
 |
| Module-wise count rates for Quadrant D Data is divided into 100 sec bins |
 |
 |
| Parameter | Plot |
|---|---|
| CZT HV Monitor |  |
| D_VDD | 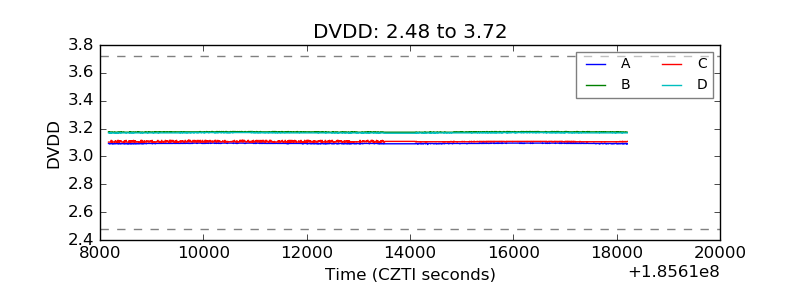 |
| Temperature 1 | 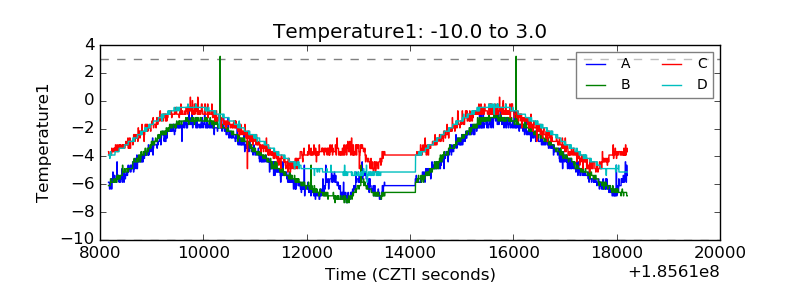 |
| Veto HV Monitor | 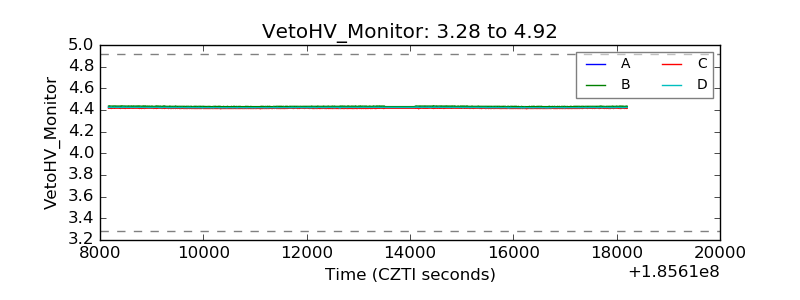 |
| Veto LLD | 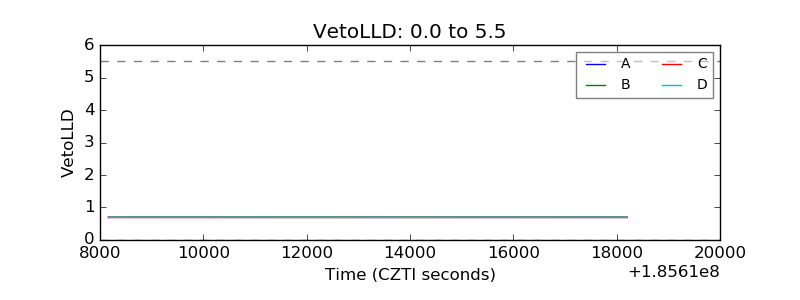 |
| Alpha Counter | 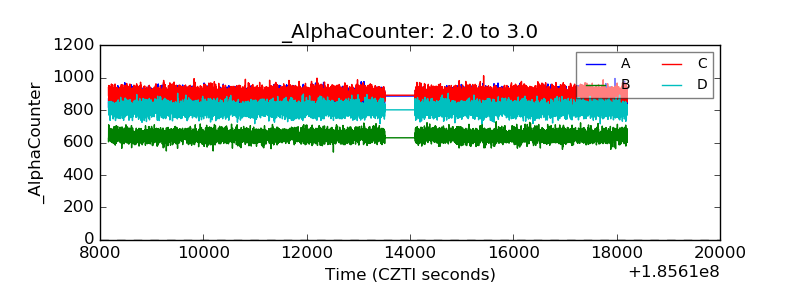 |
| _CPM_Rate | 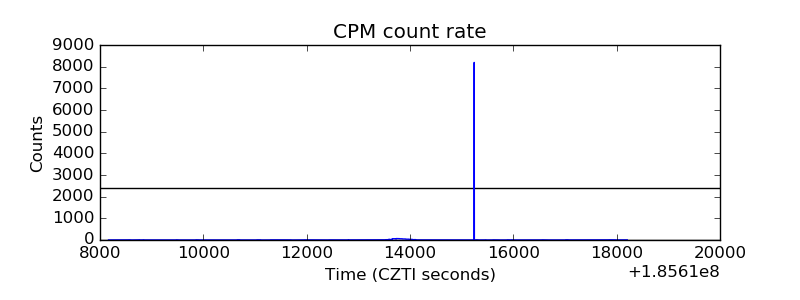 |
| CZT Counter | 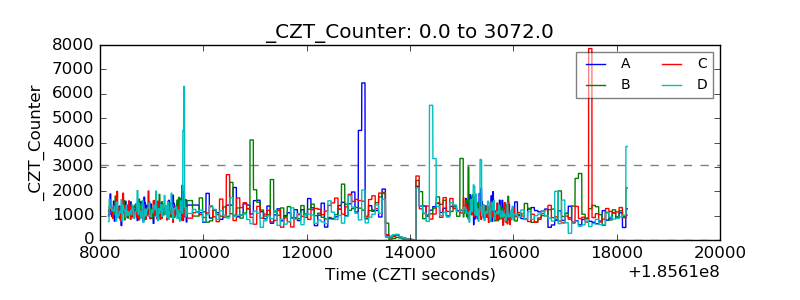 |
| +2.5 Volts monitor |  |
| +5 Volts monitor |  |
| _ROLL_ROT | 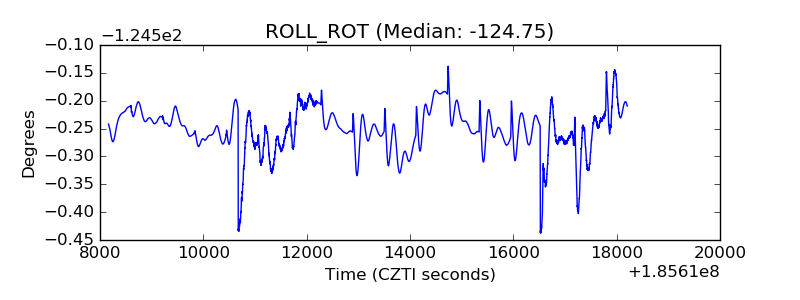 |
| _Roll_DEC | 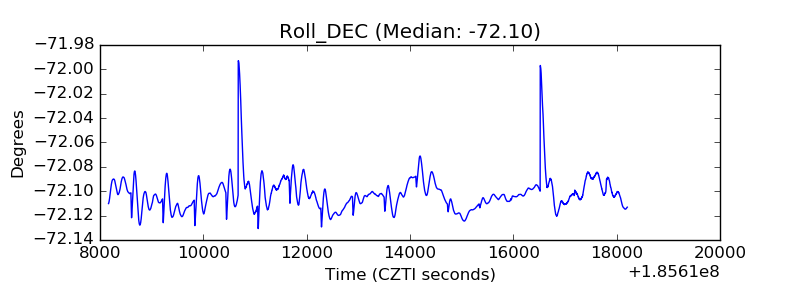 |
| _Roll_RA | 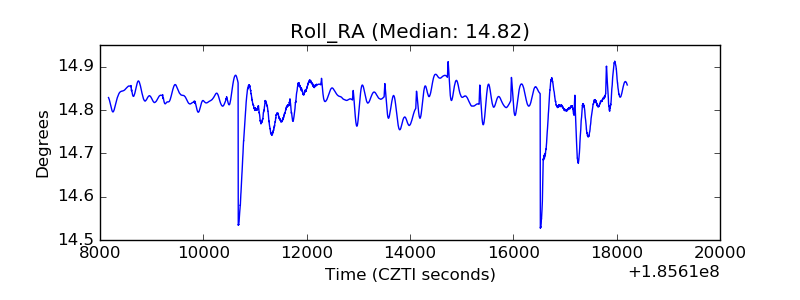 |
| Veto Counter | 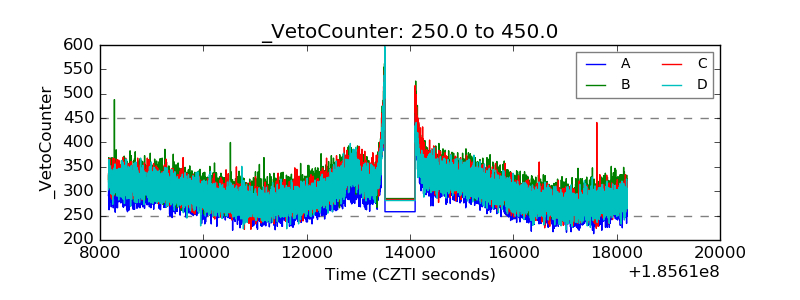 |