| Param | Original file | Final file |
|---|---|---|
| Filename | modeM0/AS1P01_010T01_9000000108_00776cztM0_level2.evt | modeM0/AS1P01_010T01_9000000108_00776cztM0_level2_quad_clean.evt |
| Size (bytes) | 1,536,482,880 | 141,626,880 |
| Size | 1.4 GB | 135.1 MB |
| Events in quadrant A | 11,301,636 | 928,930 |
| Events in quadrant B | 11,892,341 | 919,571 |
| Events in quadrant C | 11,457,563 | 903,653 |
| Events in quadrant D | 11,270,372 | 896,203 |
| Mode SS | |||
|---|---|---|---|
| Quadrant | BADHDUFLAG | Total packets | Discarded packets |
| A | 0 | 190 | 0 |
| B | 0 | 190 | 0 |
| C | 0 | 190 | 0 |
| D | 0 | 190 | 0 |
| Mode M0 | |||
|---|---|---|---|
| Quadrant | BADHDUFLAG | Total packets | Discarded packets |
| A | 0 | 40110 | 0 |
| B | 0 | 41852 | 0 |
| C | 0 | 40637 | 0 |
| D | 0 | 40099 | 0 |
| Mode M9 | |||
|---|---|---|---|
| Quadrant | BADHDUFLAG | Total packets | Discarded packets |
| A | 0 | 16 | 0 |
| B | 0 | 16 | 0 |
| C | 0 | 16 | 0 |
| D | 0 | 16 | 0 |
| Quadrant | Total seconds | Saturated seconds | Saturation percentage |
|---|---|---|---|
| A | 9236 | 111 | 1.201819% |
| B | 9236 | 95 | 1.028584% |
| C | 9236 | 190 | 2.057168% |
| D | 9237 | 270 | 2.923027% |
Noise dominated data is calculated using 1-second bins in cleaned event files. If a bin has >2000 counts, and if more than 50% of those come from <1% of pixels, then it is considered to be noise-dominated and hence unusable.
| Quadrant | # 1 sec bins | Bins with >0 counts | Bins with >2000 counts | High rate bins dominated by noise | Noise dominated (total time) | Noise dominated (detector-on time) | Marked lightcurve |
|---|---|---|---|---|---|---|---|
| A | 10871 | 9236 | 402 | 402 | 3.70% | 4.35% |  |
| B | 10871 | 9236 | 409 | 409 | 3.76% | 4.43% | 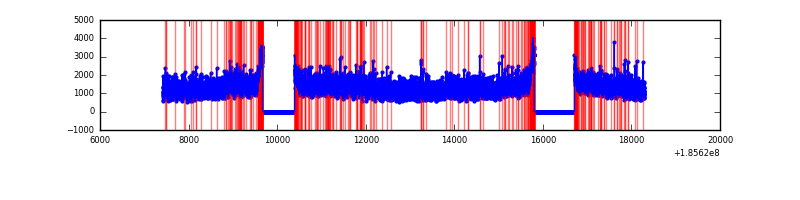 |
| C | 10871 | 9236 | 524 | 524 | 4.82% | 5.67% | 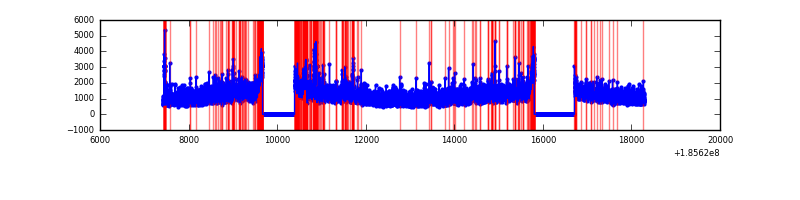 |
| D | 10872 | 9237 | 590 | 590 | 5.43% | 6.39% | 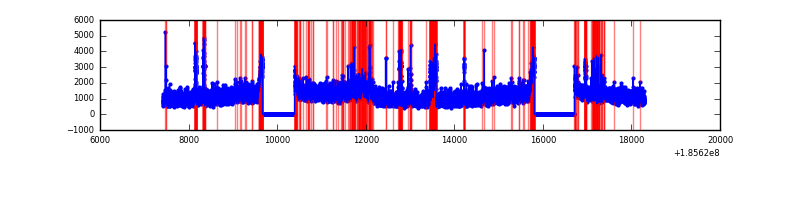 |
Top three noisy pixels from each quadrant. If the there are fewer than three noisy pixels in the level2.evt file, extra rows are filled as -1
| Pixel properties | Quadrant properties | ||||||
|---|---|---|---|---|---|---|---|
| Quadrant | DetID | PixID | Counts | Sigma | Mean | Median | Sigma |
| A | 8 | 192 | 128442 | 180.67 | 2884 | 2901 | 694.9 |
| A | 15 | 171 | 71571 | 98.83 | 2884 | 2901 | 694.9 |
| A | 15 | 17 | 24082 | 30.48 | 2884 | 2901 | 694.9 |
| B | 0 | 220 | 231091 | 321.8 | 3008 | 3019 | 708.7 |
| B | 7 | 221 | 124474 | 171.37 | 3008 | 3019 | 708.7 |
| B | 5 | 191 | 23162 | 28.42 | 3008 | 3019 | 708.7 |
| C | 10 | 17 | 676304 | 892.84 | 2707 | 2797 | 754.3 |
| C | 15 | 241 | 71332 | 90.85 | 2707 | 2797 | 754.3 |
| C | 10 | 207 | 53212 | 66.83 | 2707 | 2797 | 754.3 |
| D | 13 | 25 | 894846 | 1089.88 | 2635 | 2733 | 818.5 |
| D | 1 | 4 | 144999 | 173.8 | 2635 | 2733 | 818.5 |
| D | 6 | 226 | 132323 | 158.32 | 2635 | 2733 | 818.5 |
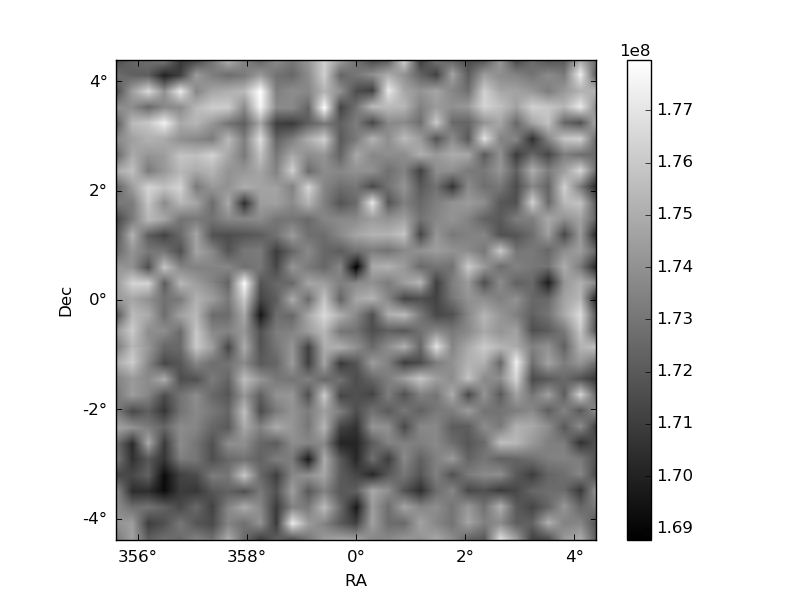
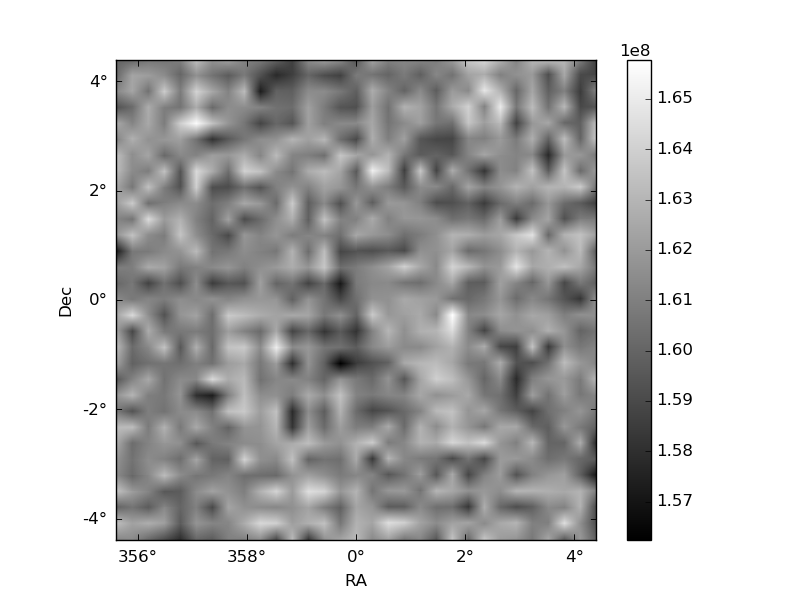
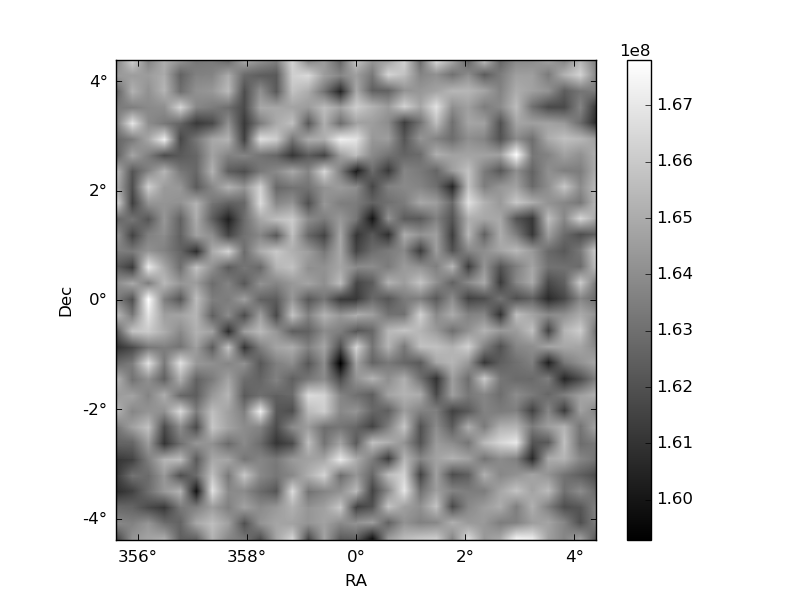
Histogram calculated using DETX and DETY for each event in the final _common_clean file
| Quadrant A |  |
 |
Quadrant B |
|---|---|---|---|
| Quadrant D | 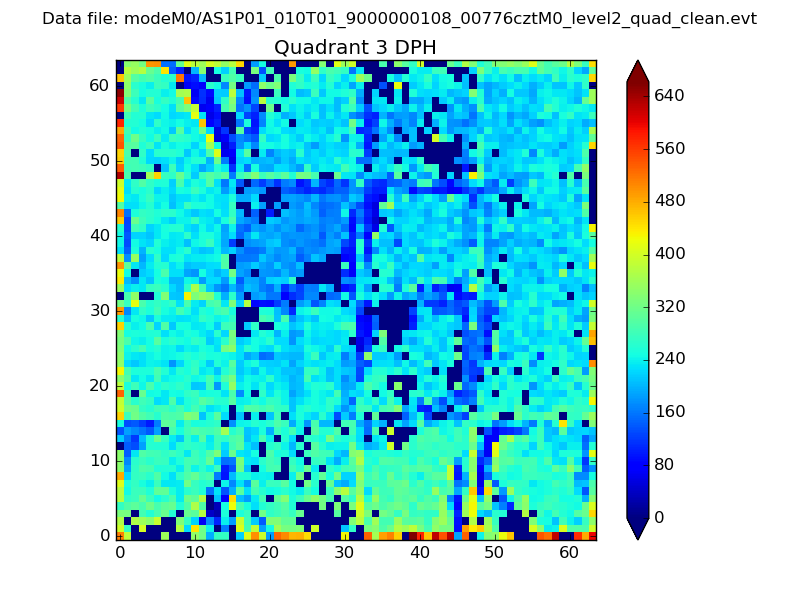 |
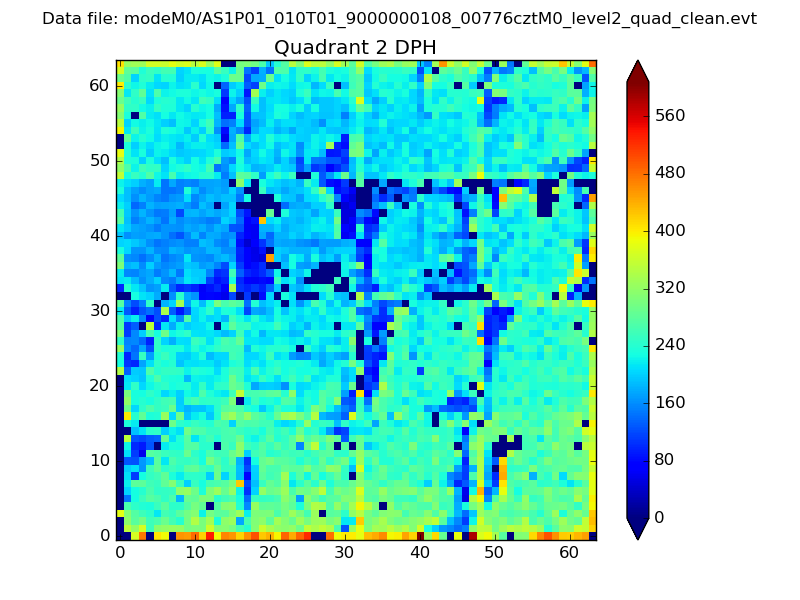 |
Quadrant C |
| Plot type | Count rate plots | Images |
|---|---|---|
| Comparison with Poisson distribution Blue bars denote a histogram of data divided into 1 sec bins. Red curve is a Poisson curve with rate = median count rate of data. |
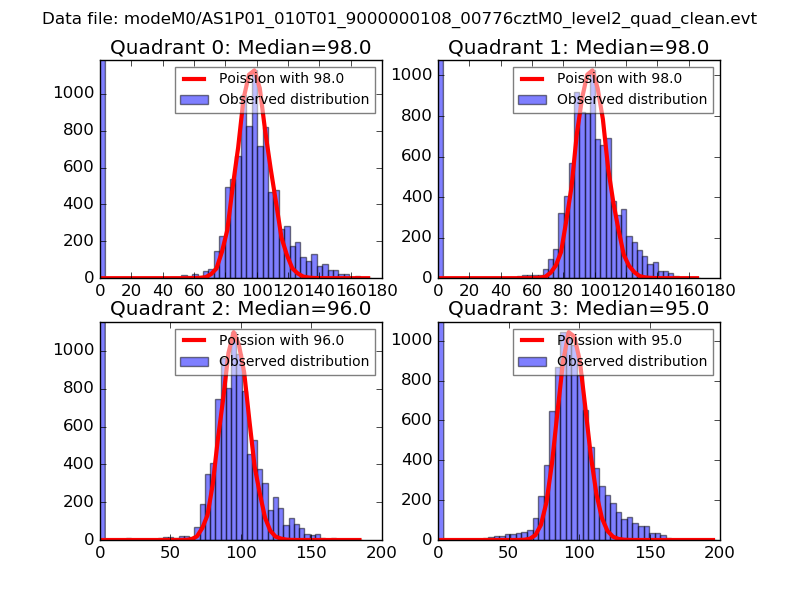 |
 |
| Quadrant-wise count rates Data is divided into 100 sec bins |
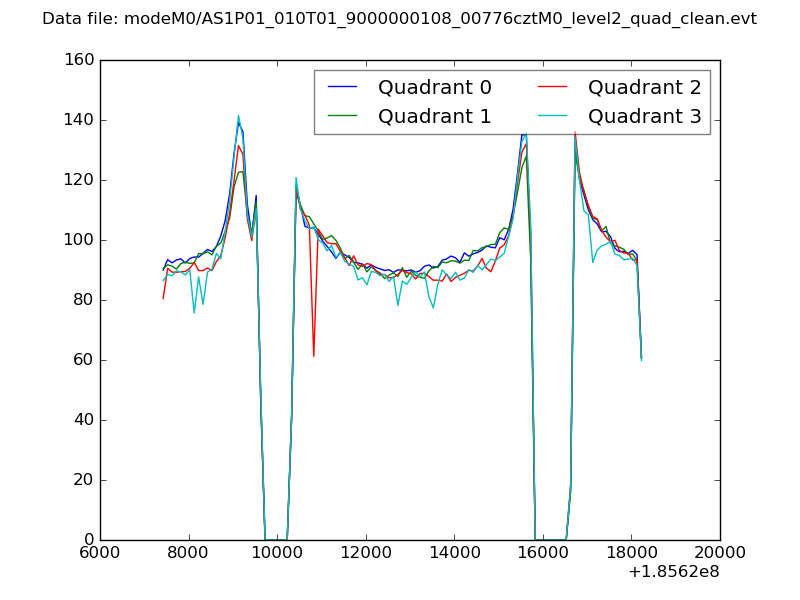 |
|
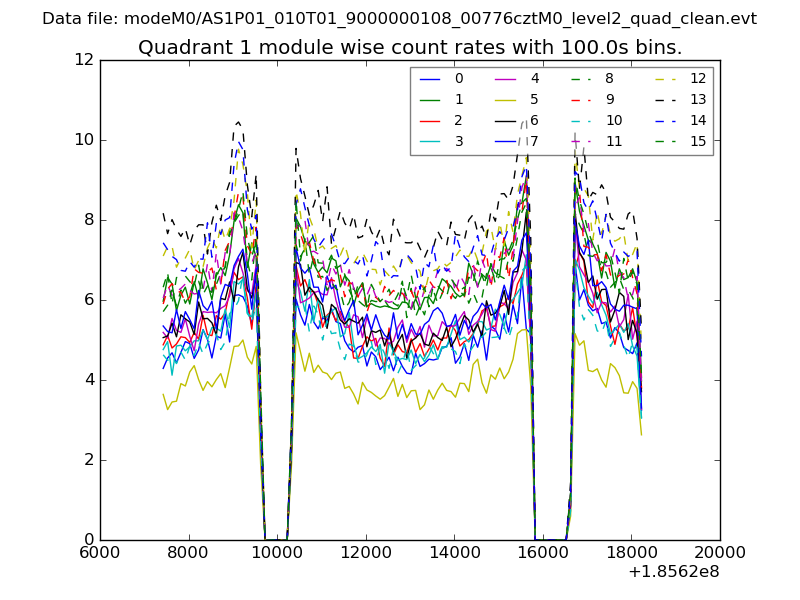
| Module-wise count rates for Quadrant A Data is divided into 100 sec bins |
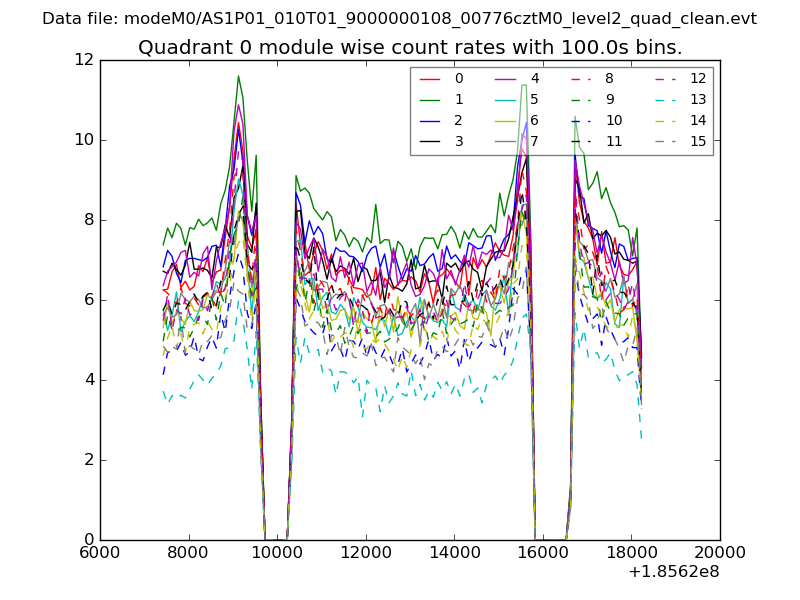 |
 |
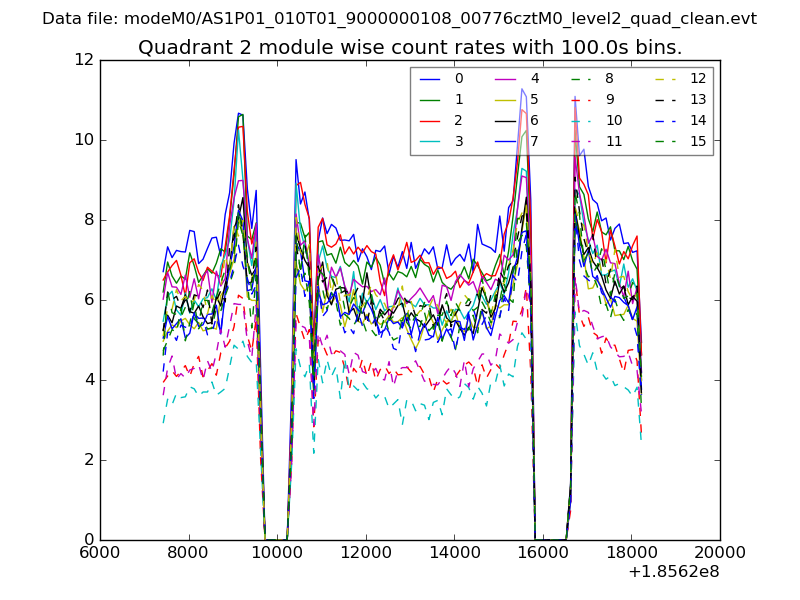
| Module-wise count rates for Quadrant B Data is divided into 100 sec bins |
 |
 |
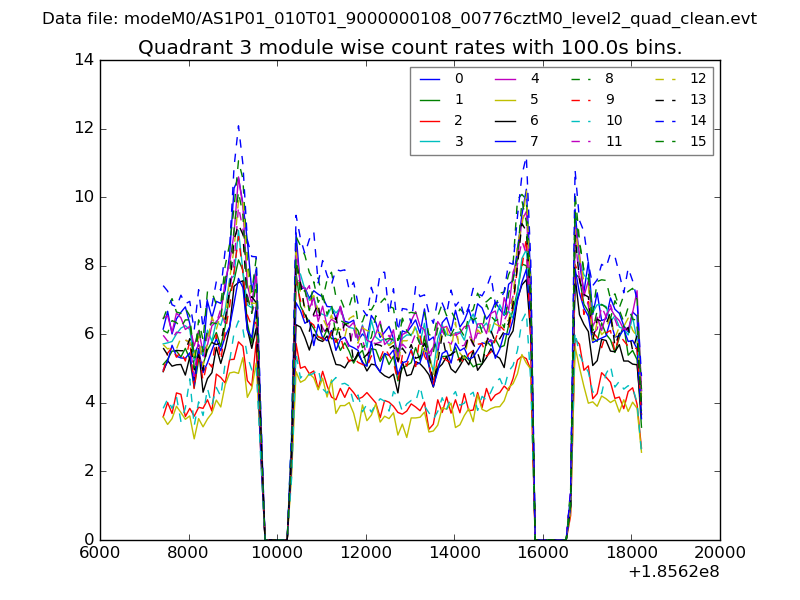
| Module-wise count rates for Quadrant C Data is divided into 100 sec bins |
 |
 |
| Module-wise count rates for Quadrant D Data is divided into 100 sec bins |
 |
 |
| Parameter | Plot |
|---|---|
| CZT HV Monitor | 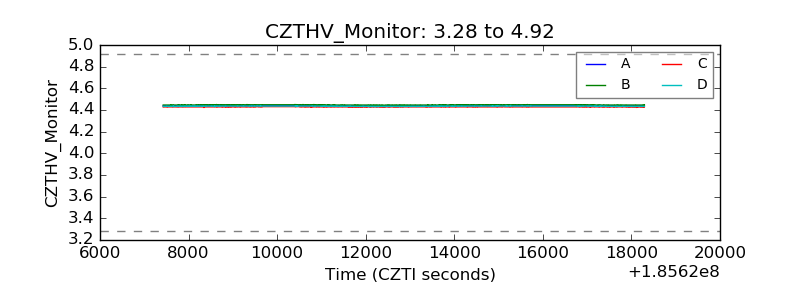 |
| D_VDD | 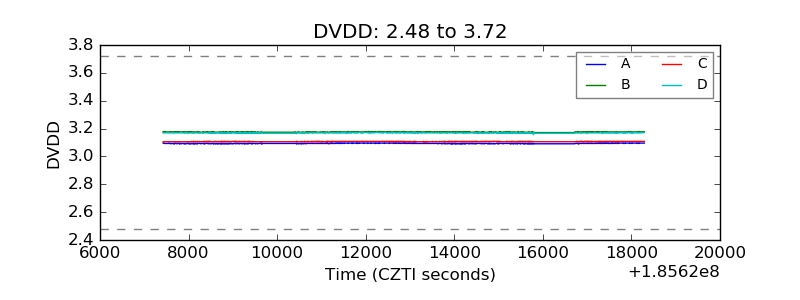 |
| Temperature 1 | 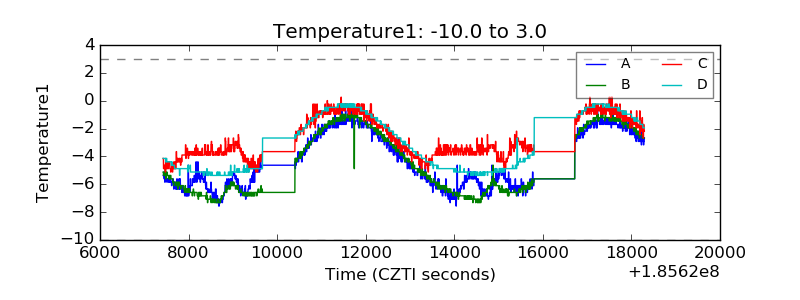 |
| Veto HV Monitor | 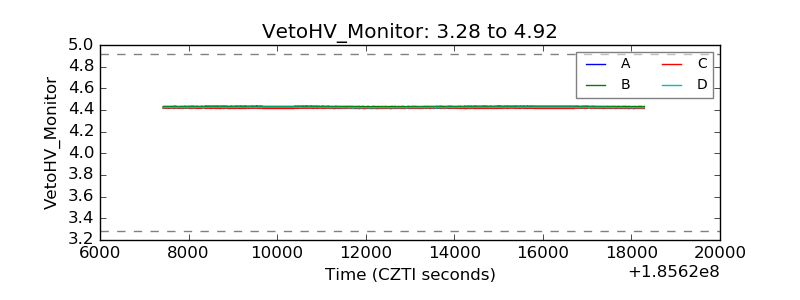 |
| Veto LLD | 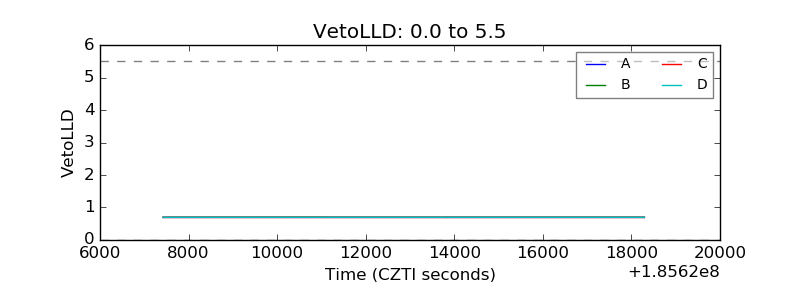 |
| Alpha Counter | 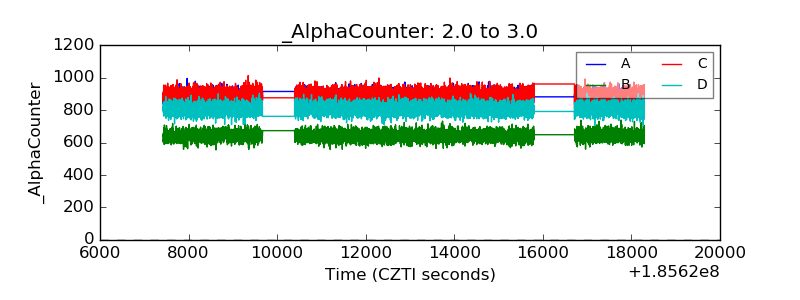 |
| _CPM_Rate | 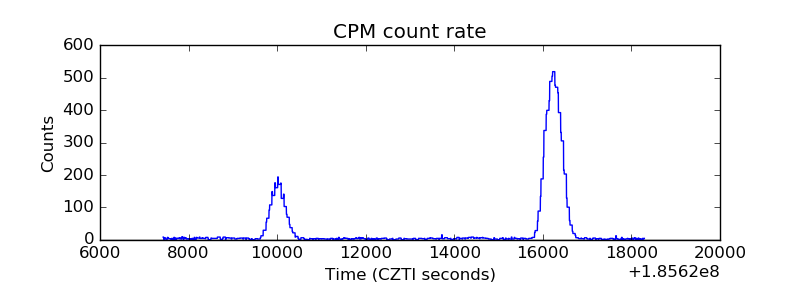 |
| CZT Counter | 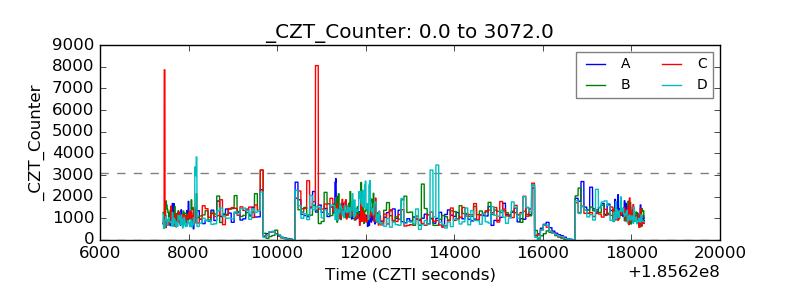 |
| +2.5 Volts monitor |  |
| +5 Volts monitor |  |
| _ROLL_ROT | 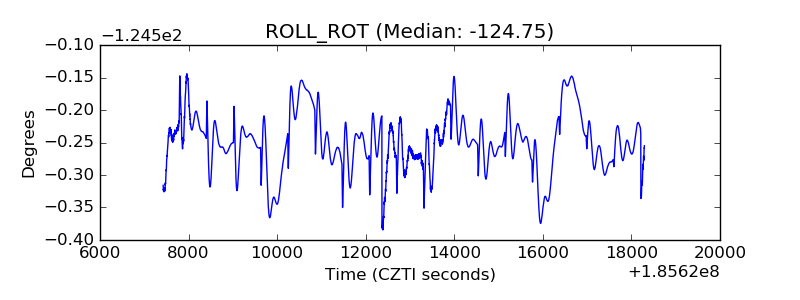 |
| _Roll_DEC | 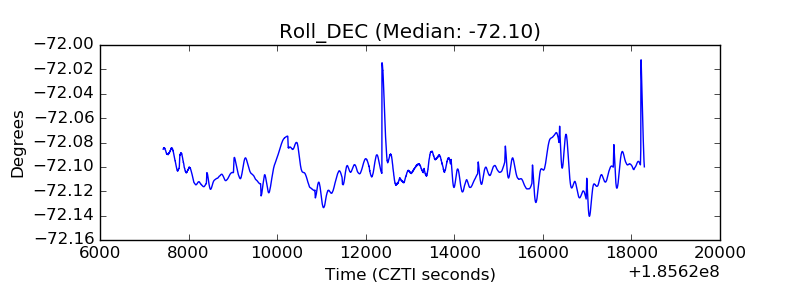 |
| _Roll_RA |  |
| Veto Counter | 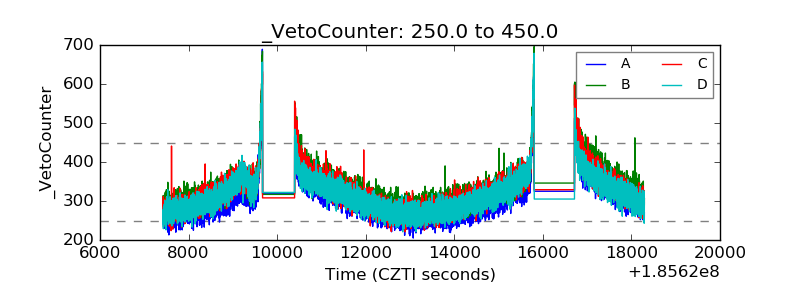 |