| Param | Original file | Final file |
|---|---|---|
| Filename | modeM0/AS1P01_010T01_9000000108_00778cztM0_level2.evt | modeM0/AS1P01_010T01_9000000108_00778cztM0_level2_quad_clean.evt |
| Size (bytes) | 970,519,680 | 95,932,800 |
| Size | 925.6 MB | 91.5 MB |
| Events in quadrant A | 7,181,305 | 633,002 |
| Events in quadrant B | 7,576,925 | 626,042 |
| Events in quadrant C | 7,382,923 | 607,812 |
| Events in quadrant D | 6,841,946 | 608,150 |
| Mode SS | |||
|---|---|---|---|
| Quadrant | BADHDUFLAG | Total packets | Discarded packets |
| A | 0 | 126 | 0 |
| B | 0 | 126 | 0 |
| C | 0 | 126 | 0 |
| D | 0 | 126 | 0 |
| Mode M0 | |||
|---|---|---|---|
| Quadrant | BADHDUFLAG | Total packets | Discarded packets |
| A | 0 | 25670 | 0 |
| B | 0 | 26875 | 0 |
| C | 0 | 26343 | 0 |
| D | 0 | 24746 | 0 |
| Mode M9 | |||
|---|---|---|---|
| Quadrant | BADHDUFLAG | Total packets | Discarded packets |
| A | 0 | 11 | 0 |
| B | 0 | 11 | 0 |
| C | 0 | 11 | 0 |
| D | 0 | 11 | 0 |
| Quadrant | Total seconds | Saturated seconds | Saturation percentage |
|---|---|---|---|
| A | 6159 | 24 | 0.389674% |
| B | 6159 | 25 | 0.405910% |
| C | 6159 | 204 | 3.312226% |
| D | 6159 | 35 | 0.568274% |
Noise dominated data is calculated using 1-second bins in cleaned event files. If a bin has >2000 counts, and if more than 50% of those come from <1% of pixels, then it is considered to be noise-dominated and hence unusable.
| Quadrant | # 1 sec bins | Bins with >0 counts | Bins with >2000 counts | High rate bins dominated by noise | Noise dominated (total time) | Noise dominated (detector-on time) | Marked lightcurve |
|---|---|---|---|---|---|---|---|
| A | 7229 | 6160 | 181 | 181 | 2.50% | 2.94% | 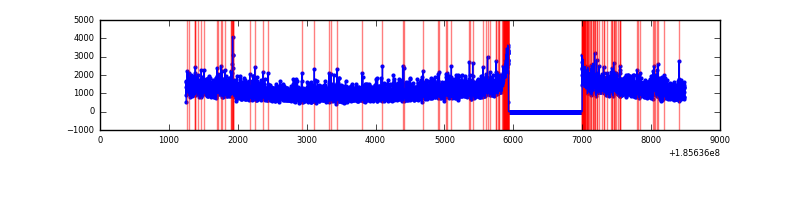 |
| B | 7229 | 6160 | 200 | 200 | 2.77% | 3.25% | 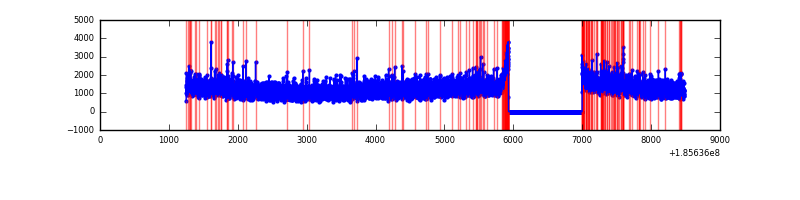 |
| C | 7229 | 6160 | 384 | 384 | 5.31% | 6.23% | 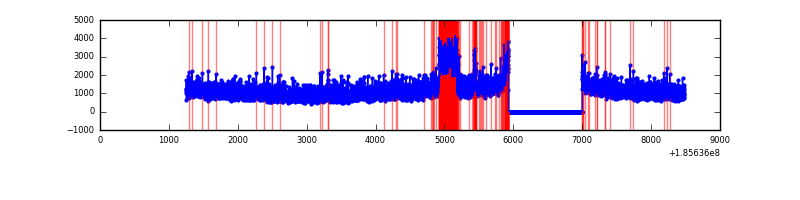 |
| D | 7229 | 6160 | 165 | 165 | 2.28% | 2.68% | 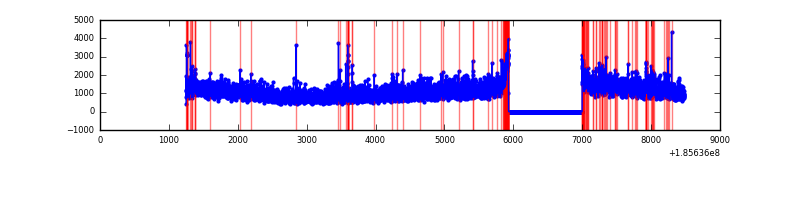 |
Top three noisy pixels from each quadrant. If the there are fewer than three noisy pixels in the level2.evt file, extra rows are filled as -1
| Pixel properties | Quadrant properties | ||||||
|---|---|---|---|---|---|---|---|
| Quadrant | DetID | PixID | Counts | Sigma | Mean | Median | Sigma |
| A | 15 | 17 | 31207 | 65.76 | 1855 | 1872 | 446.1 |
| A | 15 | 171 | 22484 | 46.21 | 1855 | 1872 | 446.1 |
| A | 8 | 192 | 12929 | 24.79 | 1855 | 1872 | 446.1 |
| B | 0 | 220 | 88910 | 191.5 | 1938 | 1949 | 454.1 |
| B | 0 | 157 | 32051 | 66.29 | 1938 | 1949 | 454.1 |
| B | 5 | 191 | 19204 | 38.0 | 1938 | 1949 | 454.1 |
| C | 10 | 17 | 603070 | 1264.61 | 1704 | 1759 | 475.5 |
| C | 15 | 241 | 47612 | 96.43 | 1704 | 1759 | 475.5 |
| C | 3 | 111 | 33034 | 65.77 | 1704 | 1759 | 475.5 |
| D | 1 | 4 | 162651 | 310.3 | 1673 | 1727 | 518.6 |
| D | 6 | 226 | 134113 | 255.27 | 1673 | 1727 | 518.6 |
| D | 13 | 25 | 60269 | 112.88 | 1673 | 1727 | 518.6 |
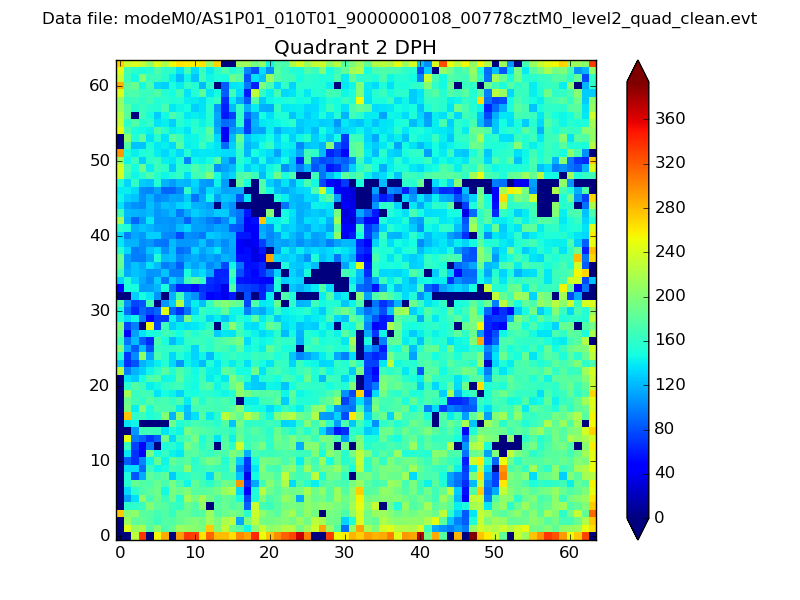
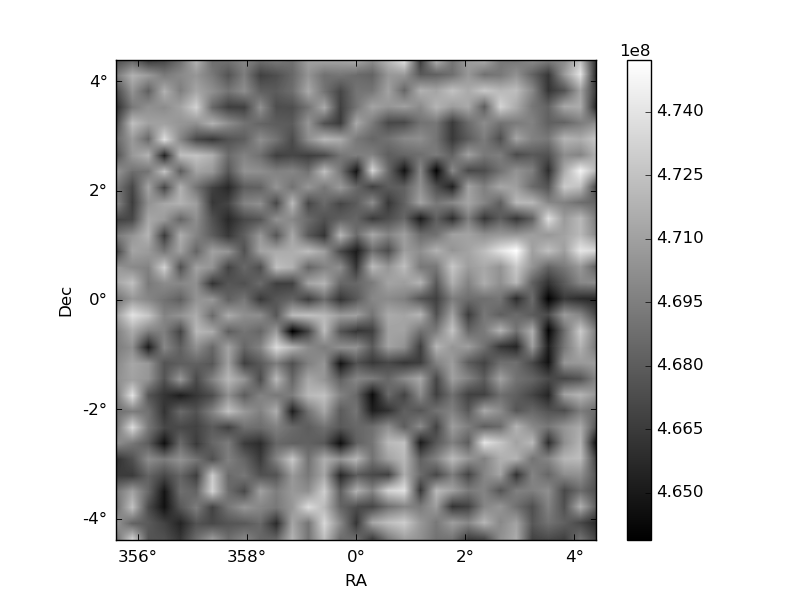
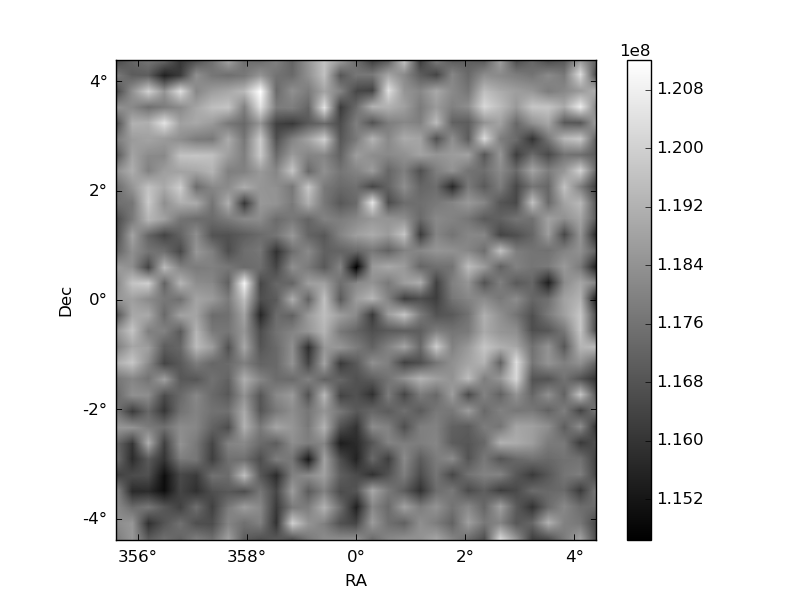
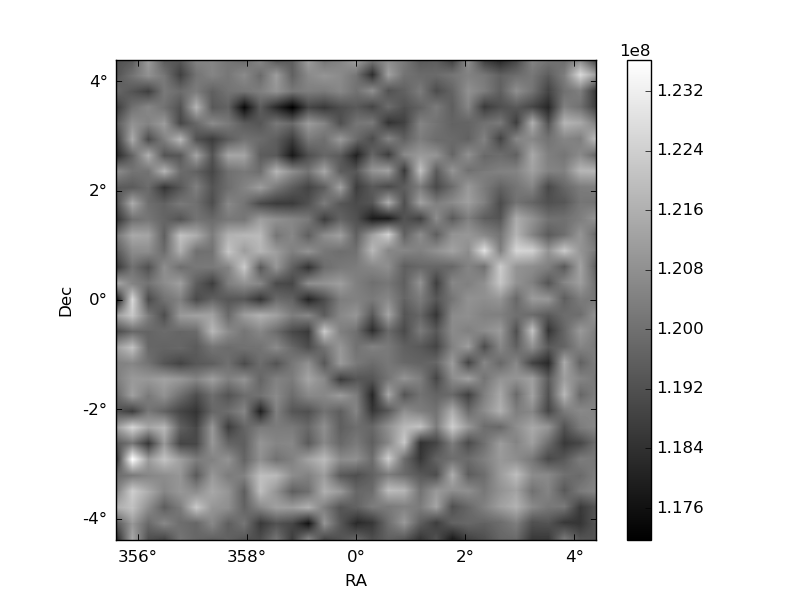
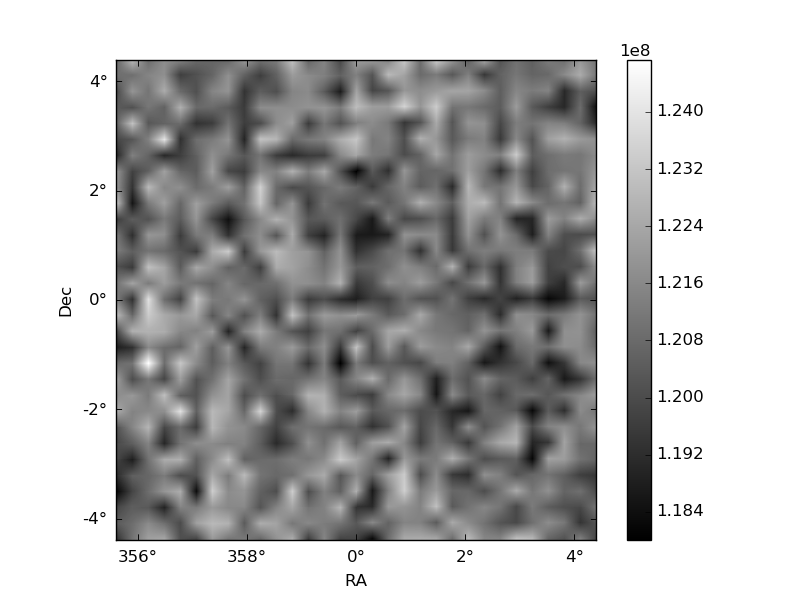
Histogram calculated using DETX and DETY for each event in the final _common_clean file
| Quadrant A | 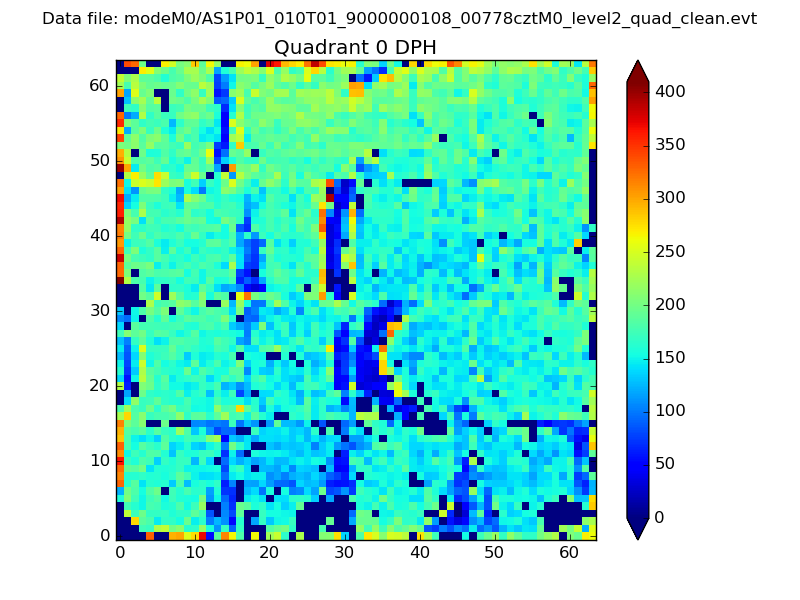 |
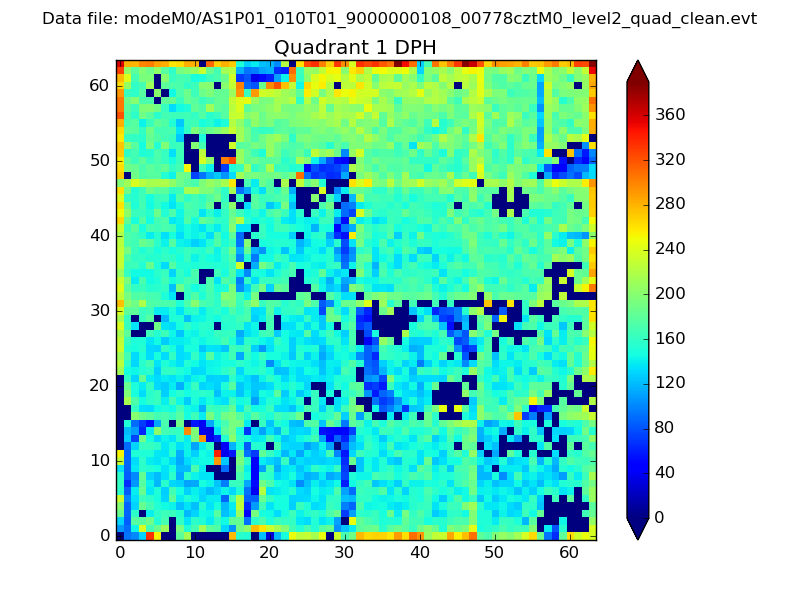 |
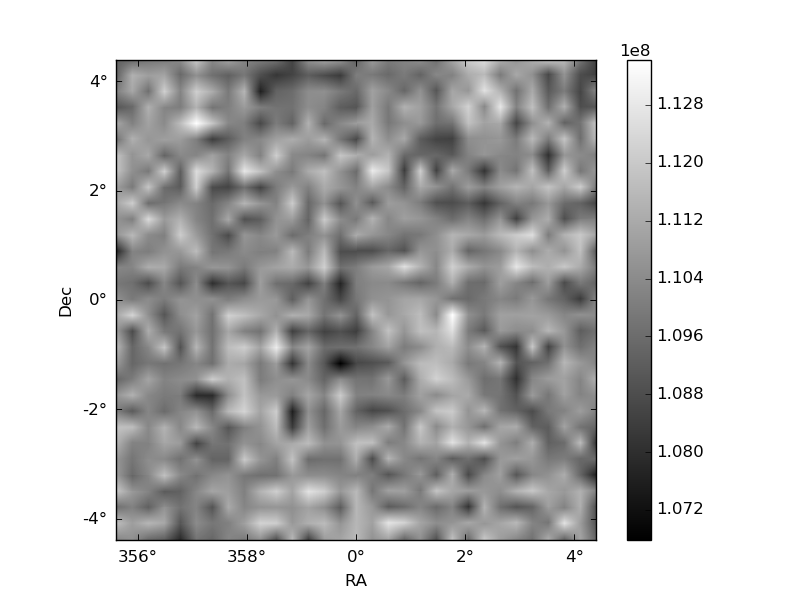
Quadrant B |
|---|---|---|---|
| Quadrant D | 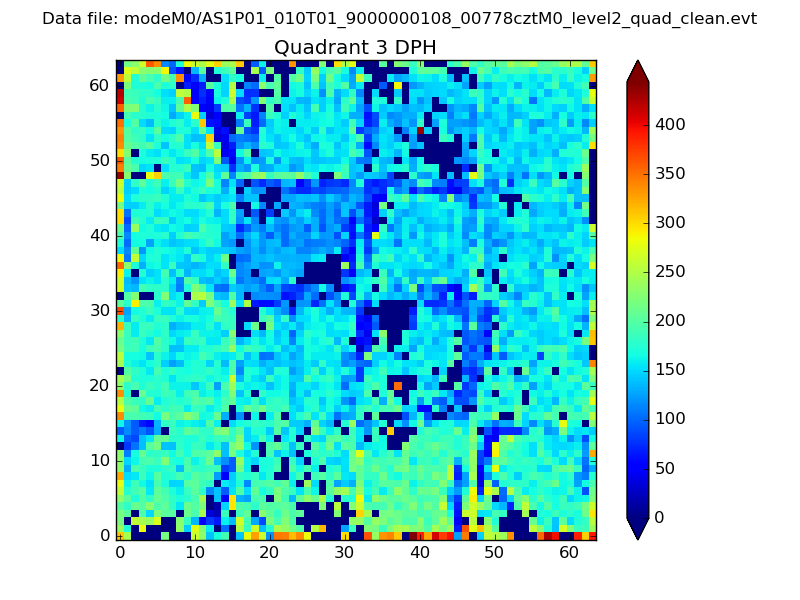 |
 |
Quadrant C |
| Plot type | Count rate plots | Images |
|---|---|---|
| Comparison with Poisson distribution Blue bars denote a histogram of data divided into 1 sec bins. Red curve is a Poisson curve with rate = median count rate of data. |
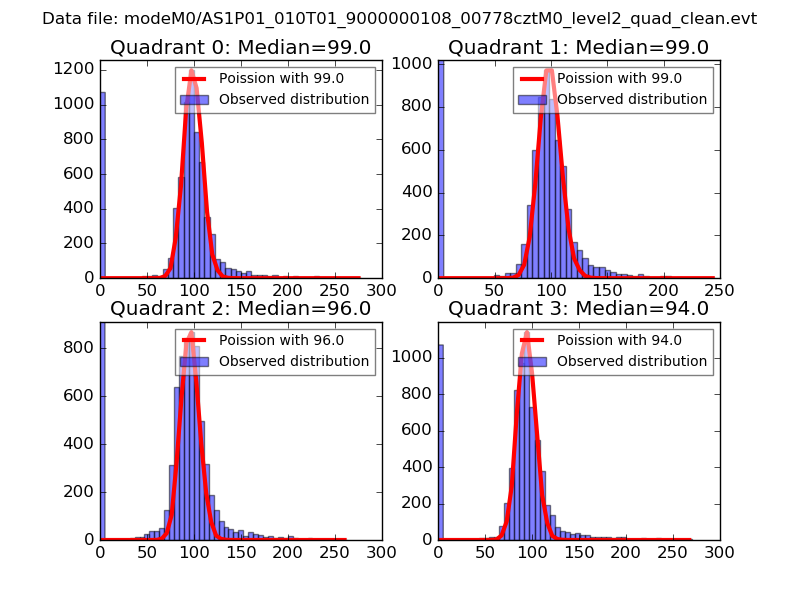 |
 |
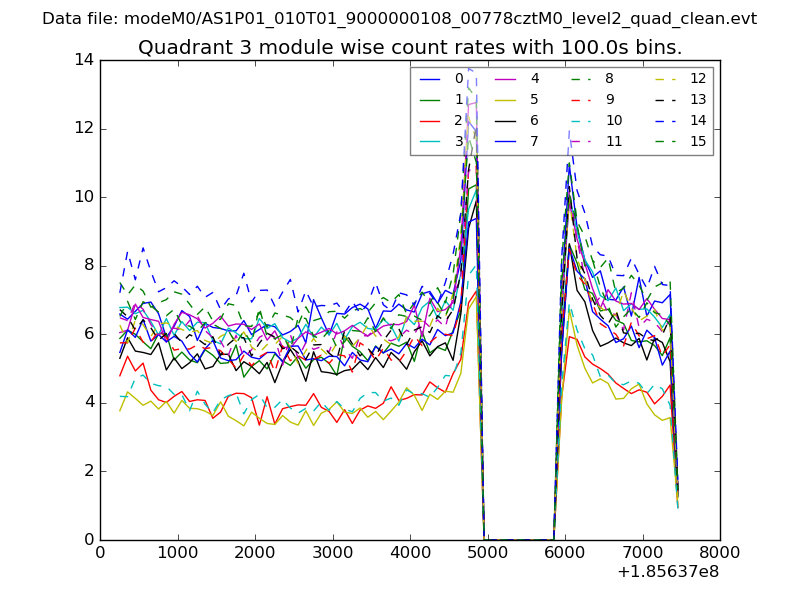
| Quadrant-wise count rates Data is divided into 100 sec bins |
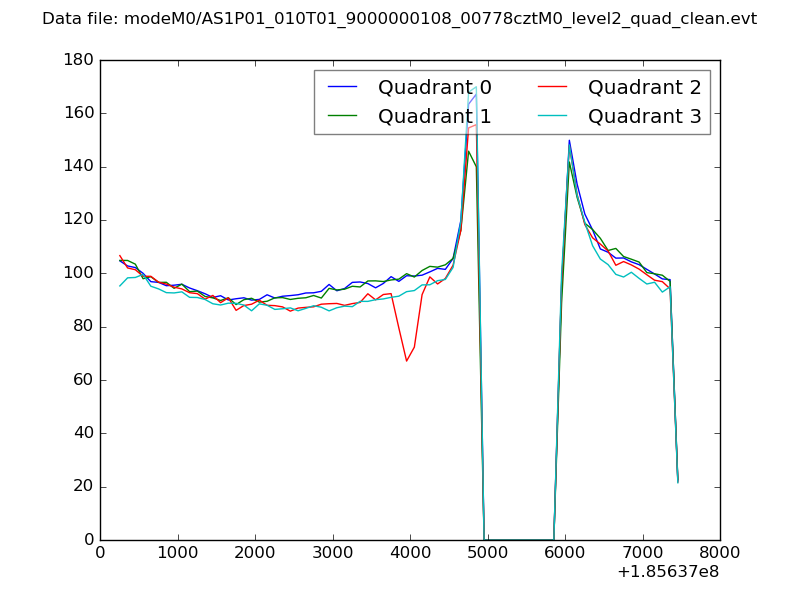 |
|
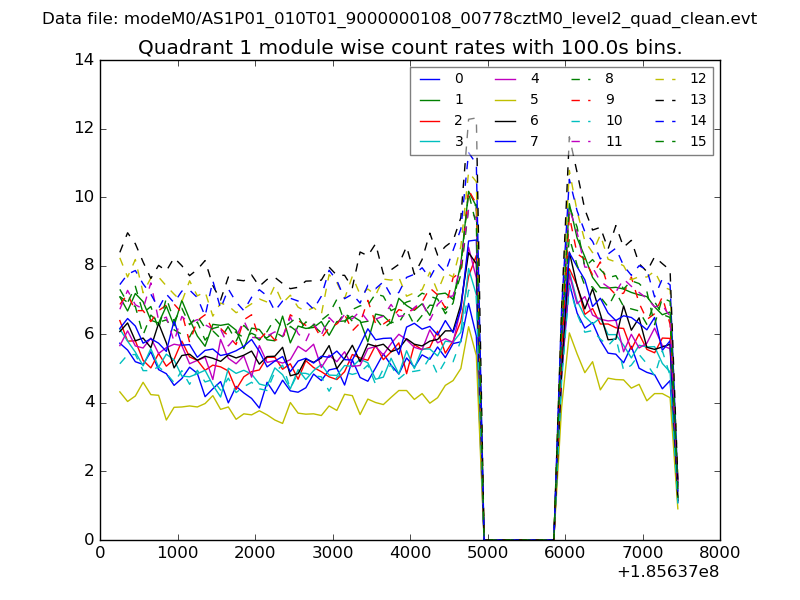
| Module-wise count rates for Quadrant A Data is divided into 100 sec bins |
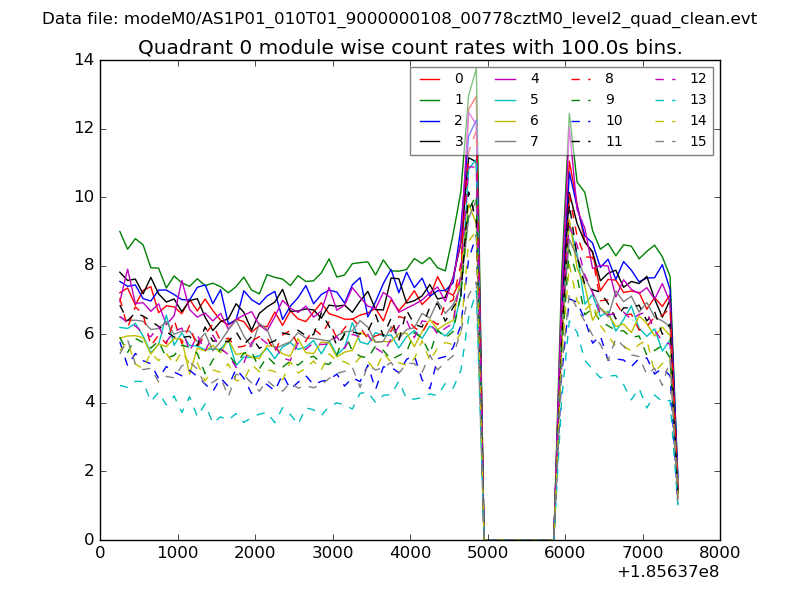 |
 |
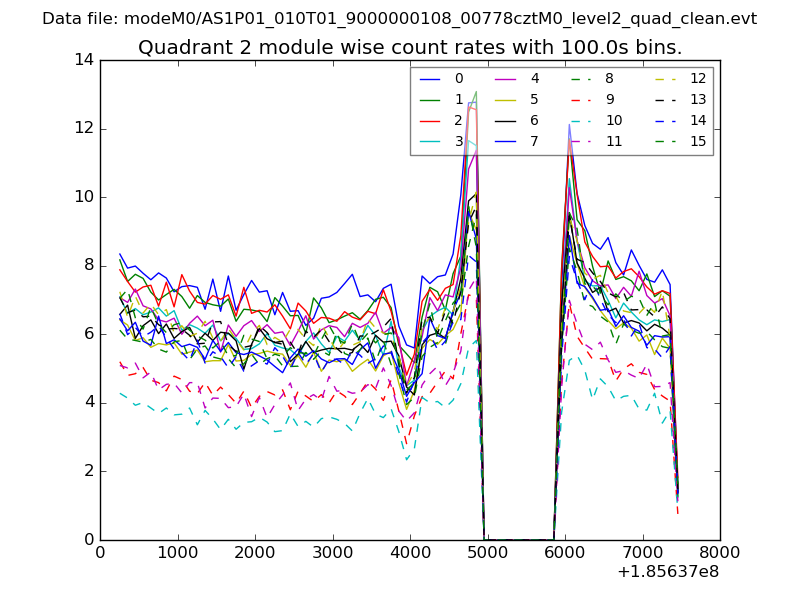
| Module-wise count rates for Quadrant B Data is divided into 100 sec bins |
 |
 |
| Module-wise count rates for Quadrant C Data is divided into 100 sec bins |
 |
 |
| Module-wise count rates for Quadrant D Data is divided into 100 sec bins |
 |
 |
| Parameter | Plot |
|---|---|
| CZT HV Monitor | 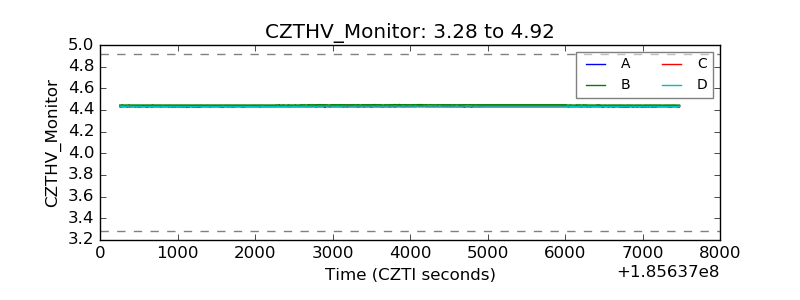 |
| D_VDD | 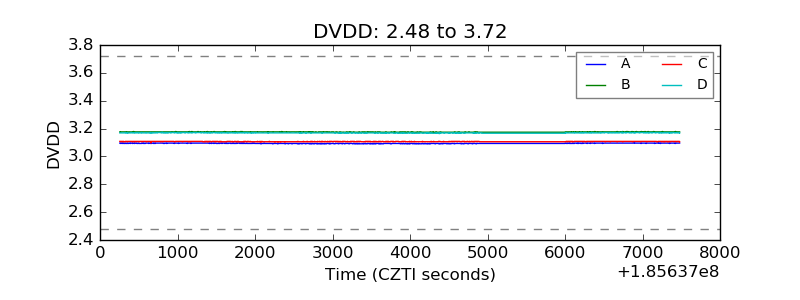 |
| Temperature 1 | 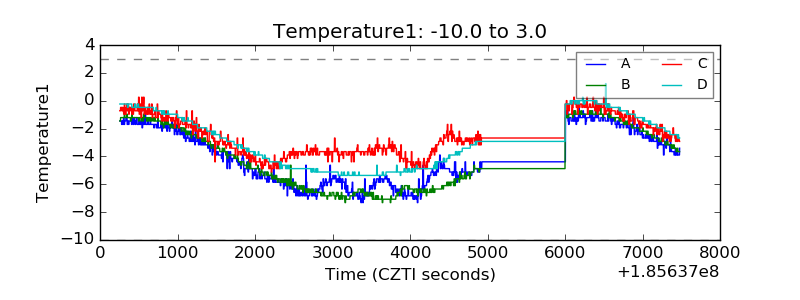 |
| Veto HV Monitor | 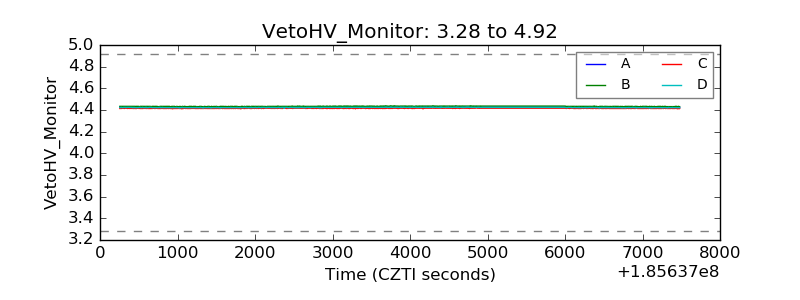 |
| Veto LLD | 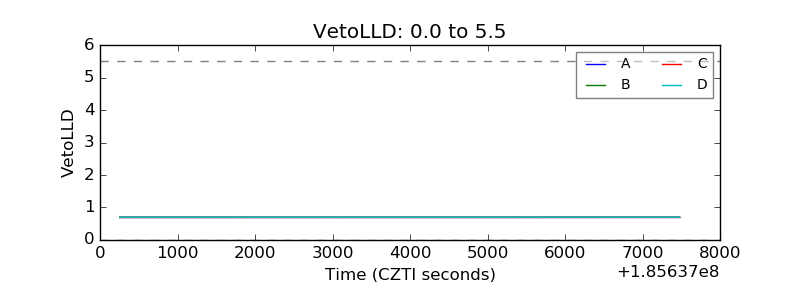 |
| Alpha Counter | 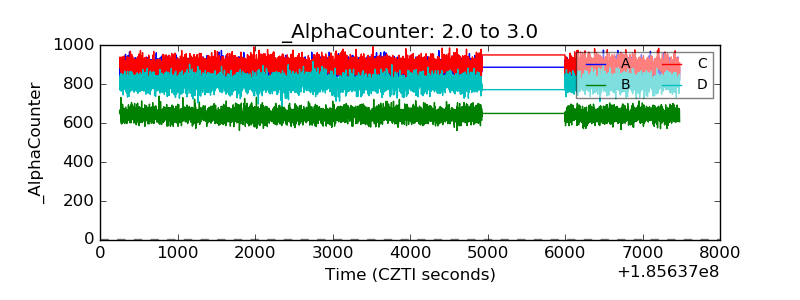 |
| _CPM_Rate | 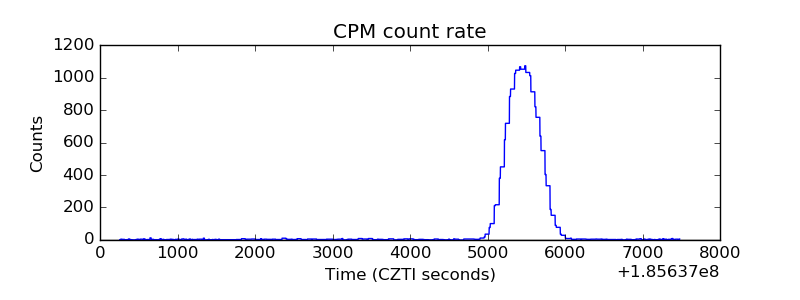 |
| CZT Counter | 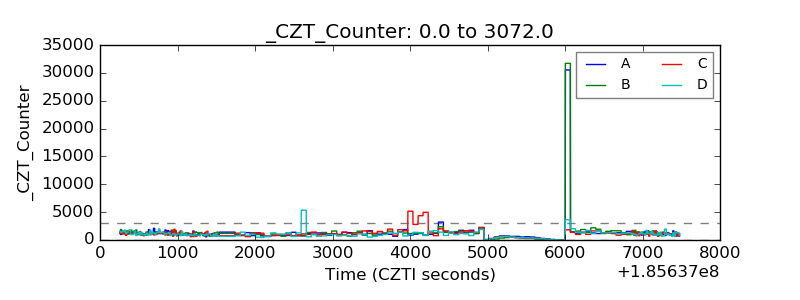 |
| +2.5 Volts monitor | 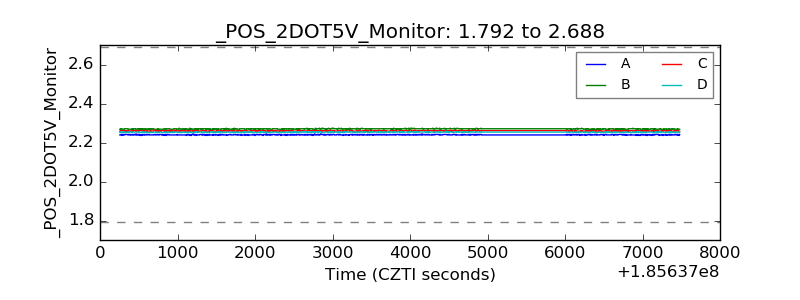 |
| +5 Volts monitor |  |
| _ROLL_ROT | 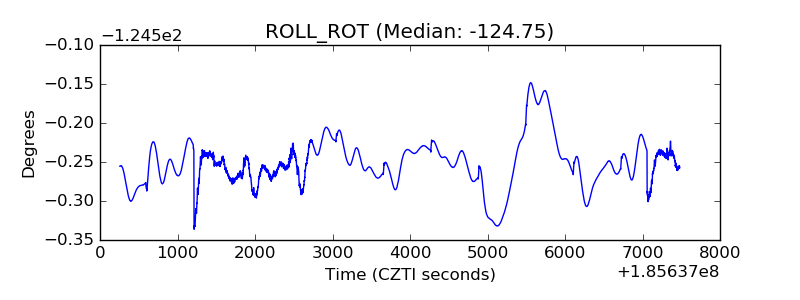 |
| _Roll_DEC | 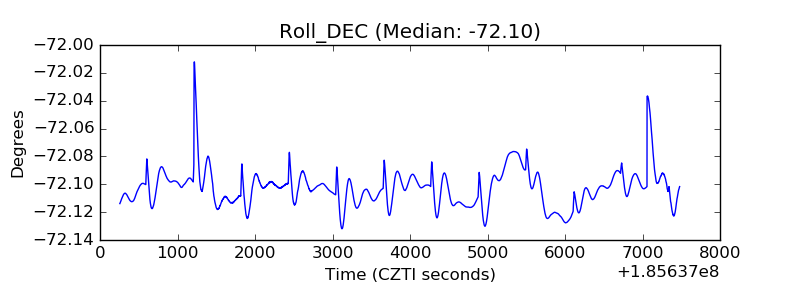 |
| _Roll_RA | 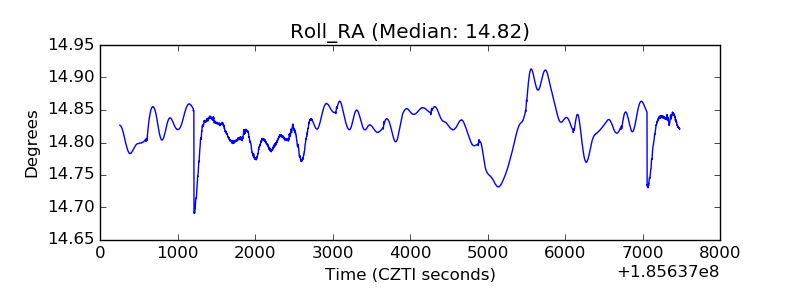 |
| Veto Counter | 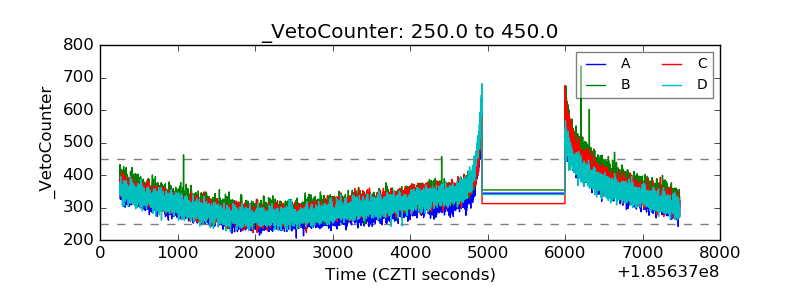 |