| Param | Original file | Final file |
|---|---|---|
| Filename | modeM0/AS1P01_010T01_9000000108_00779cztM0_level2.evt | modeM0/AS1P01_010T01_9000000108_00779cztM0_level2_quad_clean.evt |
| Size (bytes) | 1,001,004,480 | 98,763,840 |
| Size | 954.6 MB | 94.2 MB |
| Events in quadrant A | 7,429,446 | 652,990 |
| Events in quadrant B | 7,897,655 | 652,963 |
| Events in quadrant C | 7,348,840 | 629,388 |
| Events in quadrant D | 7,222,013 | 616,753 |
| Mode SS | |||
|---|---|---|---|
| Quadrant | BADHDUFLAG | Total packets | Discarded packets |
| A | 0 | 126 | 0 |
| B | 0 | 126 | 0 |
| C | 0 | 126 | 0 |
| D | 0 | 126 | 0 |
| Mode M0 | |||
|---|---|---|---|
| Quadrant | BADHDUFLAG | Total packets | Discarded packets |
| A | 0 | 26493 | 0 |
| B | 0 | 27942 | 0 |
| C | 0 | 26364 | 0 |
| D | 0 | 25967 | 0 |
| Mode M9 | |||
|---|---|---|---|
| Quadrant | BADHDUFLAG | Total packets | Discarded packets |
| A | 0 | 12 | 0 |
| B | 0 | 12 | 0 |
| C | 0 | 12 | 0 |
| D | 0 | 12 | 0 |
| Quadrant | Total seconds | Saturated seconds | Saturation percentage |
|---|---|---|---|
| A | 6298 | 30 | 0.476342% |
| B | 6298 | 41 | 0.651000% |
| C | 6298 | 64 | 1.016196% |
| D | 6298 | 60 | 0.952683% |
Noise dominated data is calculated using 1-second bins in cleaned event files. If a bin has >2000 counts, and if more than 50% of those come from <1% of pixels, then it is considered to be noise-dominated and hence unusable.
| Quadrant | # 1 sec bins | Bins with >0 counts | Bins with >2000 counts | High rate bins dominated by noise | Noise dominated (total time) | Noise dominated (detector-on time) | Marked lightcurve |
|---|---|---|---|---|---|---|---|
| A | 7478 | 6299 | 185 | 185 | 2.47% | 2.94% | 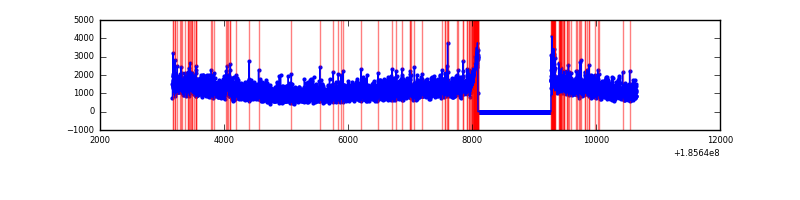 |
| B | 7478 | 6299 | 249 | 249 | 3.33% | 3.95% | 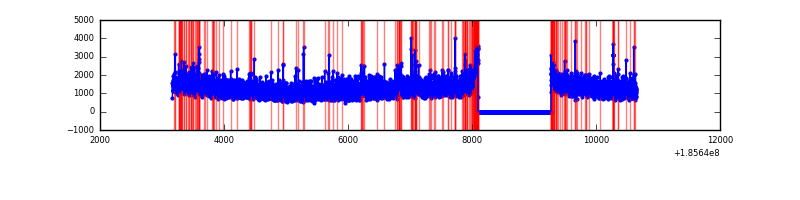 |
| C | 7478 | 6299 | 245 | 245 | 3.28% | 3.89% | 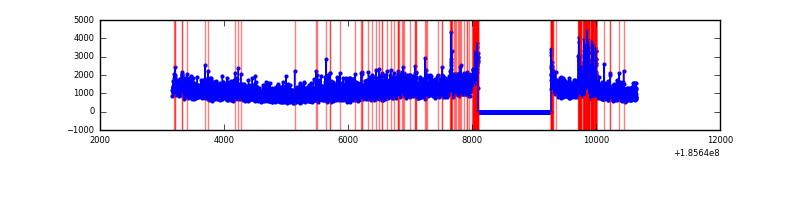 |
| D | 7478 | 6299 | 231 | 231 | 3.09% | 3.67% | 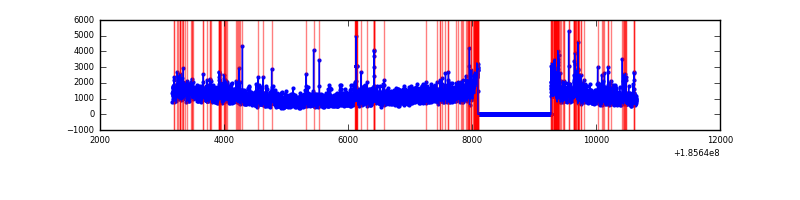 |
Top three noisy pixels from each quadrant. If the there are fewer than three noisy pixels in the level2.evt file, extra rows are filled as -1
| Pixel properties | Quadrant properties | ||||||
|---|---|---|---|---|---|---|---|
| Quadrant | DetID | PixID | Counts | Sigma | Mean | Median | Sigma |
| A | 15 | 17 | 24583 | 48.94 | 1909 | 1925 | 463.0 |
| A | 8 | 192 | 23457 | 46.51 | 1909 | 1925 | 463.0 |
| A | 15 | 171 | 22325 | 44.06 | 1909 | 1925 | 463.0 |
| B | 5 | 191 | 129056 | 273.22 | 1989 | 1997 | 465.0 |
| B | 0 | 157 | 47173 | 97.14 | 1989 | 1997 | 465.0 |
| B | 0 | 182 | 32652 | 65.92 | 1989 | 1997 | 465.0 |
| C | 10 | 17 | 257696 | 523.18 | 1759 | 1817 | 489.1 |
| C | 10 | 207 | 104792 | 210.55 | 1759 | 1817 | 489.1 |
| C | 15 | 241 | 56413 | 111.63 | 1759 | 1817 | 489.1 |
| D | 12 | 188 | 200310 | 373.56 | 1709 | 1766 | 531.5 |
| D | 13 | 25 | 187407 | 349.28 | 1709 | 1766 | 531.5 |
| D | 1 | 4 | 175801 | 327.45 | 1709 | 1766 | 531.5 |
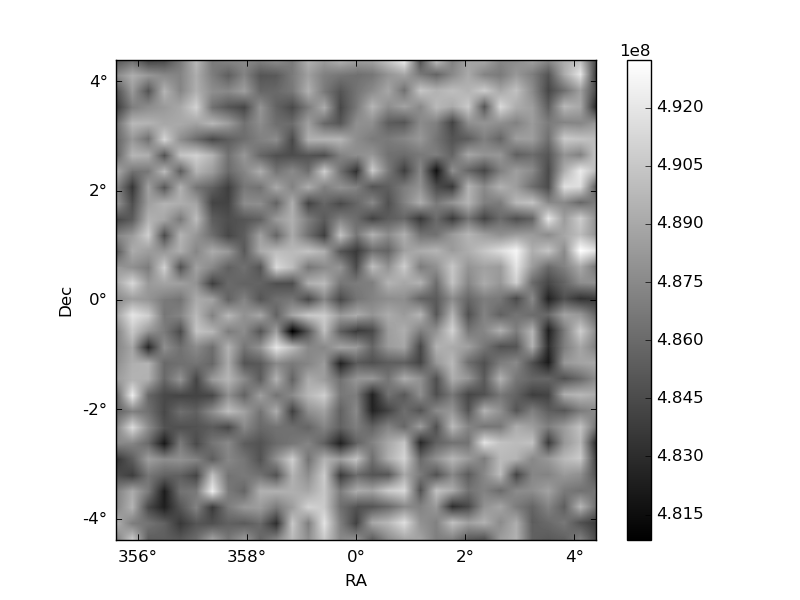
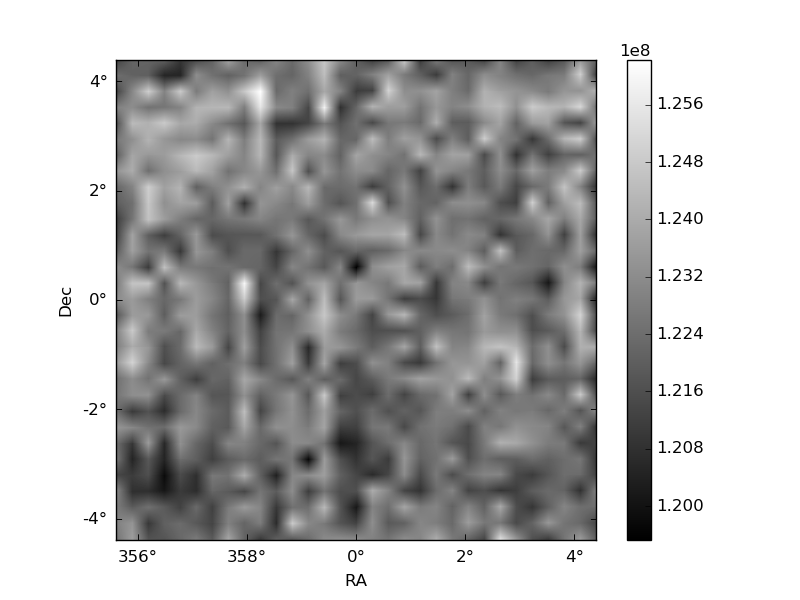
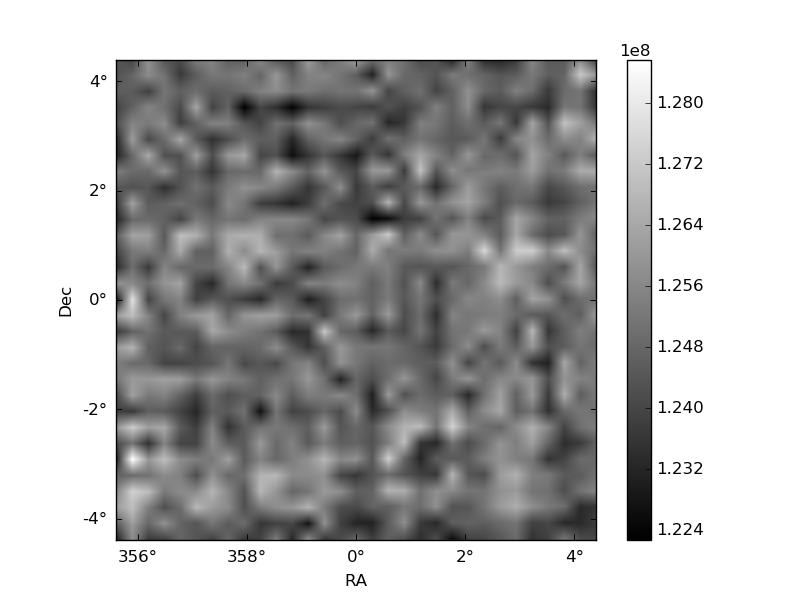
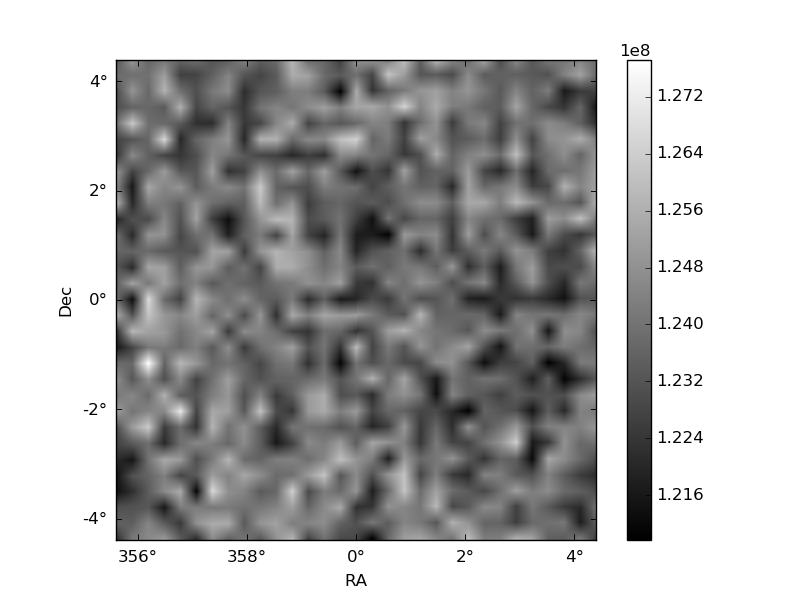
Histogram calculated using DETX and DETY for each event in the final _common_clean file
| Quadrant A | 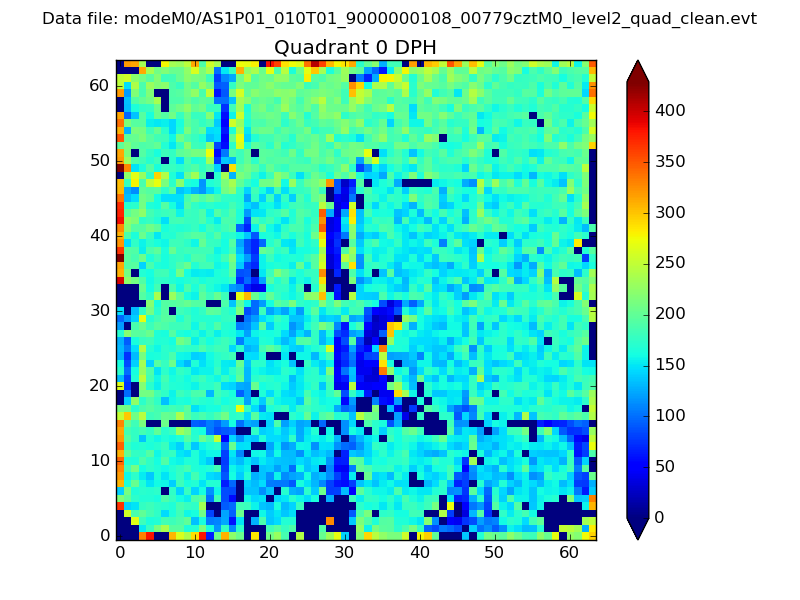 |
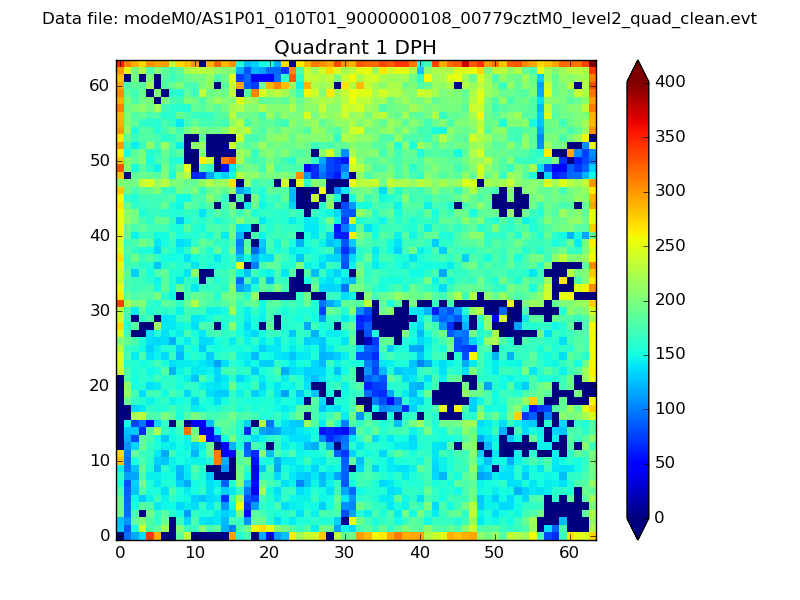 |
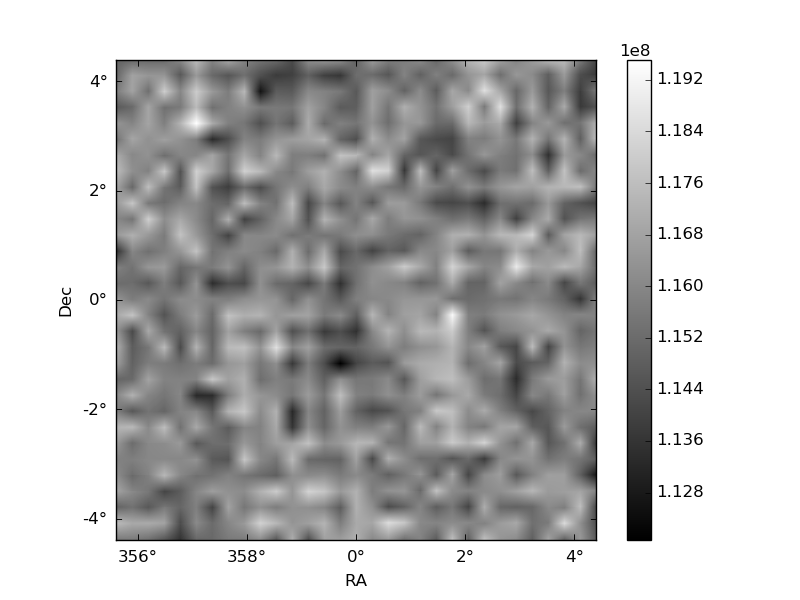
Quadrant B |
|---|---|---|---|
| Quadrant D | 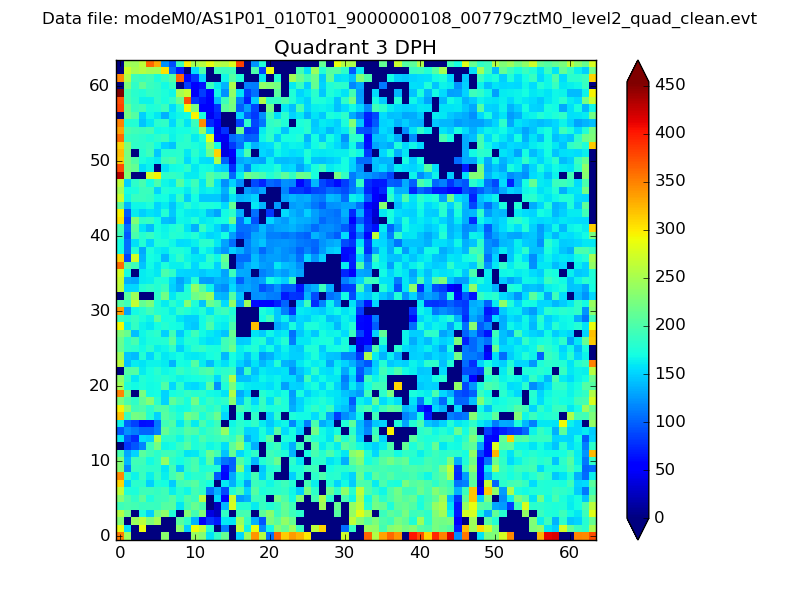 |
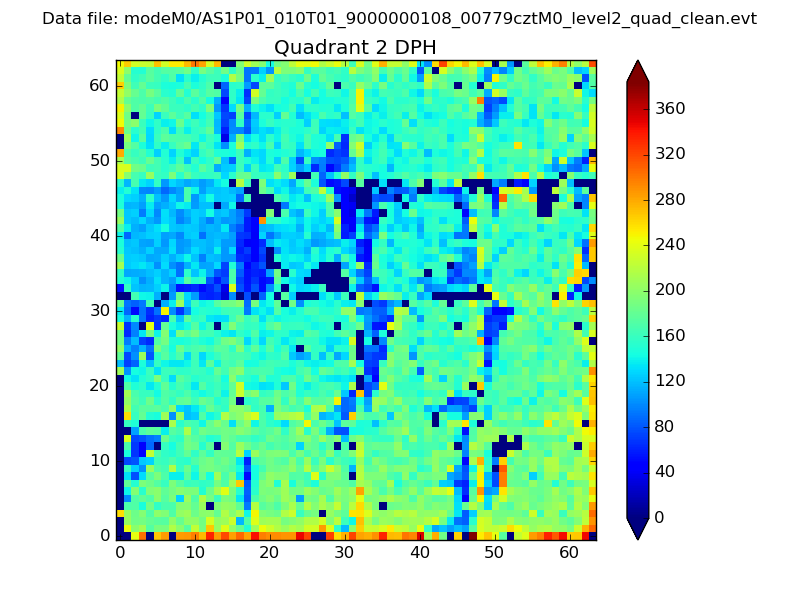 |
Quadrant C |
| Plot type | Count rate plots | Images |
|---|---|---|
| Comparison with Poisson distribution Blue bars denote a histogram of data divided into 1 sec bins. Red curve is a Poisson curve with rate = median count rate of data. |
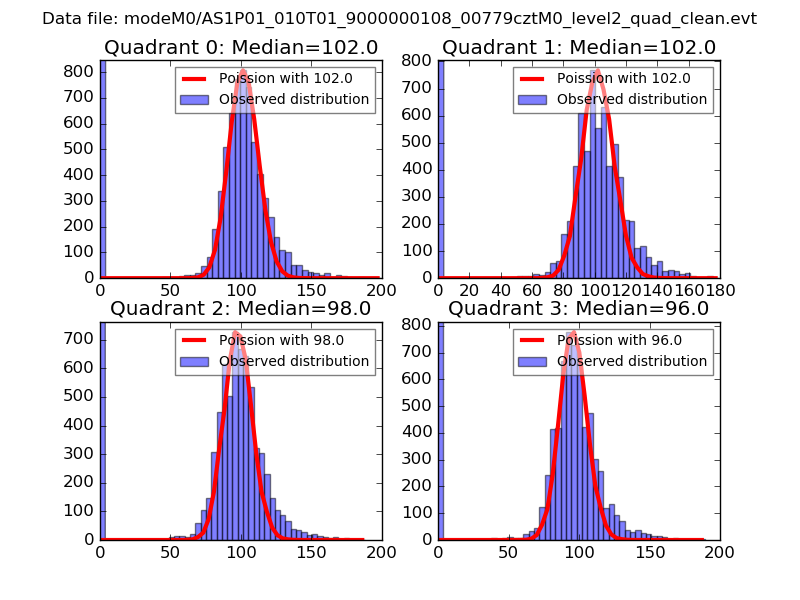 |
 |
| Quadrant-wise count rates Data is divided into 100 sec bins |
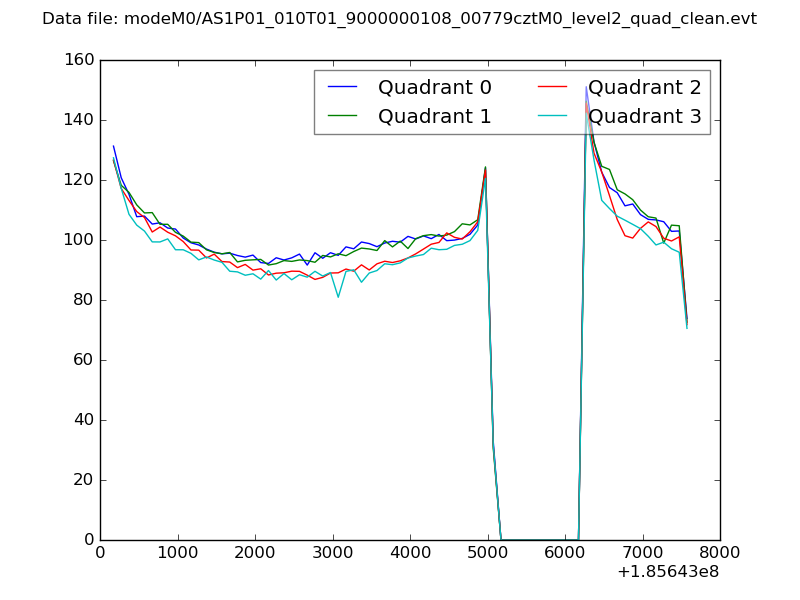 |
|
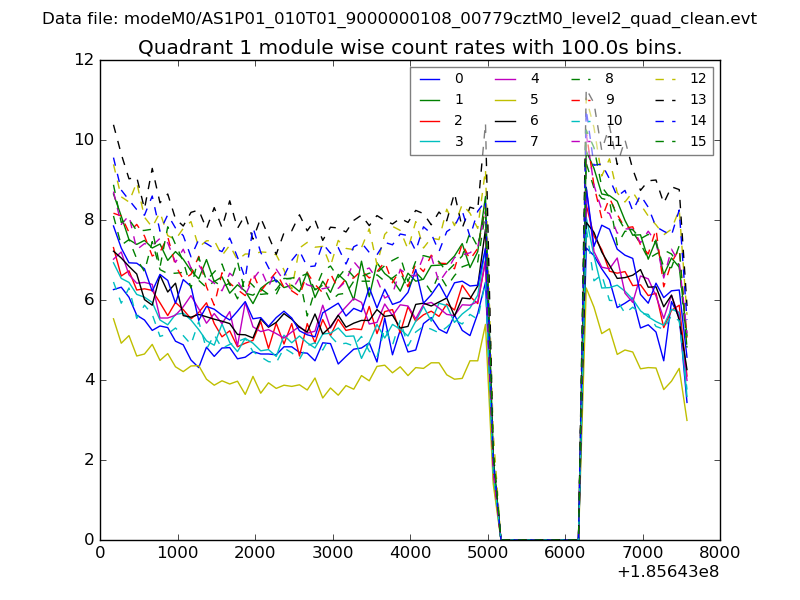
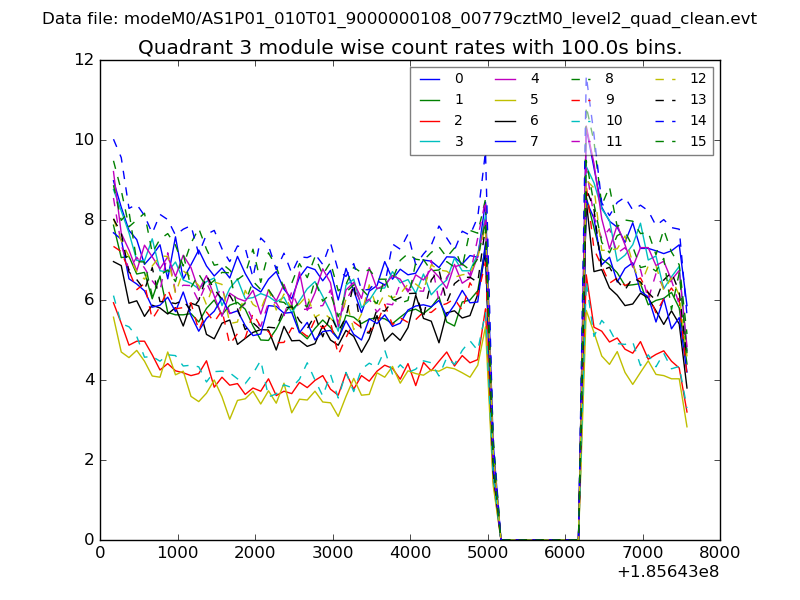
| Module-wise count rates for Quadrant A Data is divided into 100 sec bins |
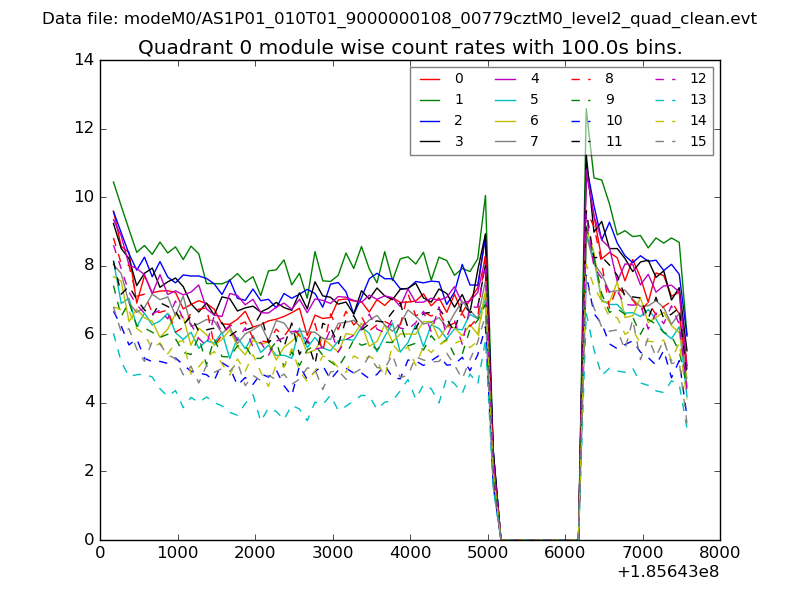 |
 |
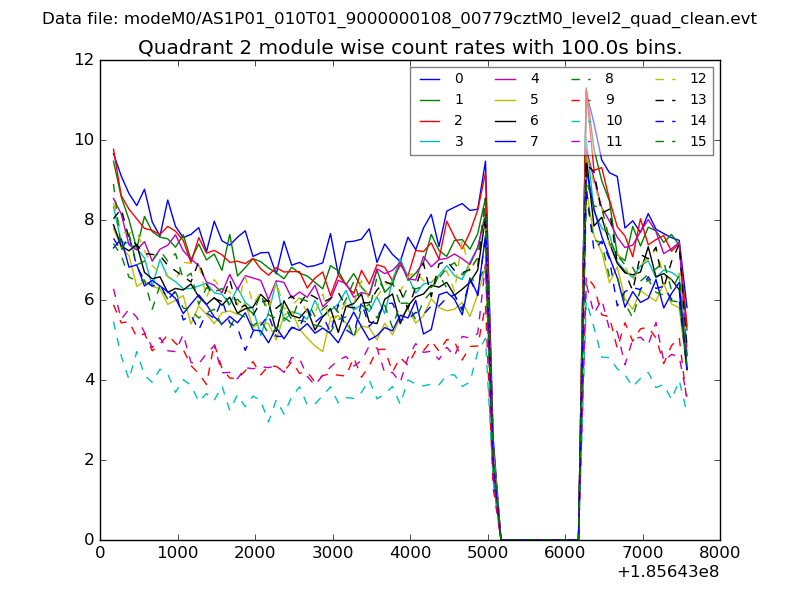
| Module-wise count rates for Quadrant B Data is divided into 100 sec bins |
 |
 |
| Module-wise count rates for Quadrant C Data is divided into 100 sec bins |
 |
 |
| Module-wise count rates for Quadrant D Data is divided into 100 sec bins |
 |
 |
| Parameter | Plot |
|---|---|
| CZT HV Monitor | 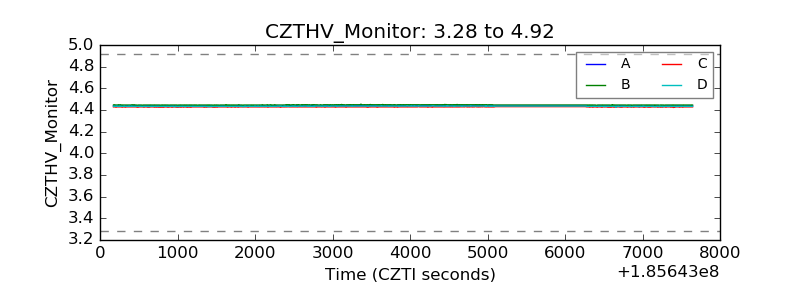 |
| D_VDD | 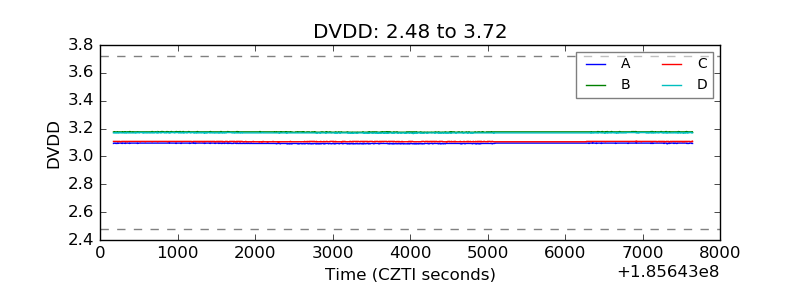 |
| Temperature 1 | 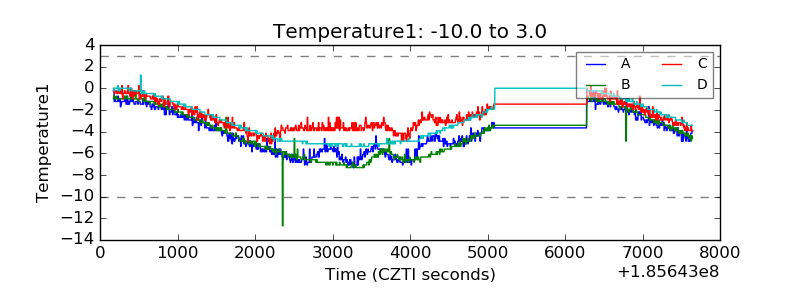 |
| Veto HV Monitor | 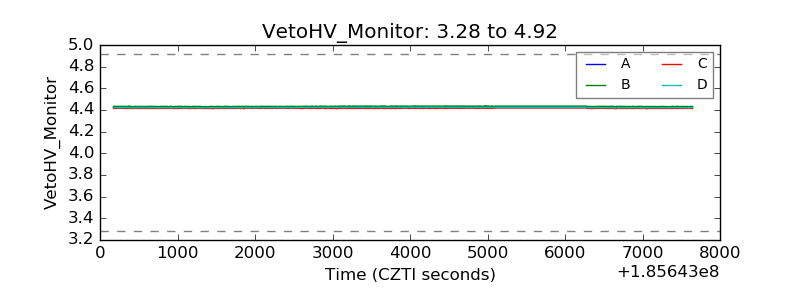 |
| Veto LLD | 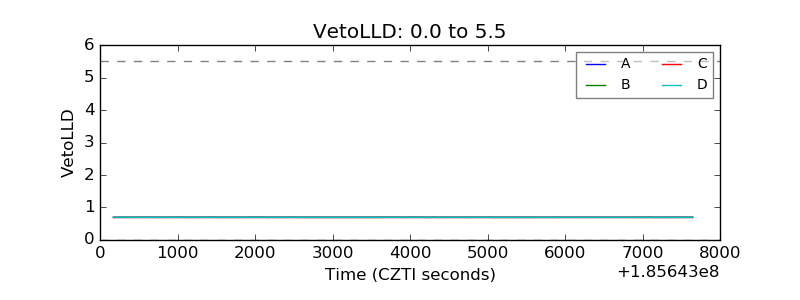 |
| Alpha Counter | 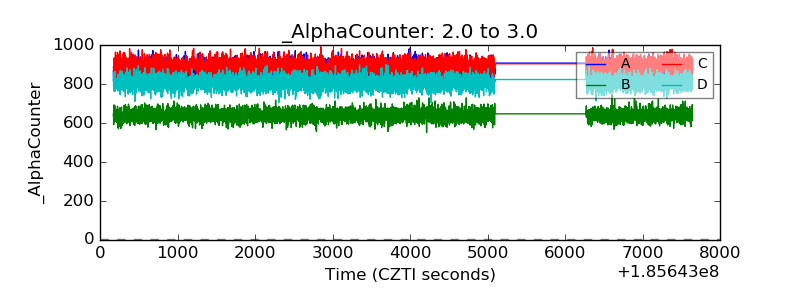 |
| _CPM_Rate | 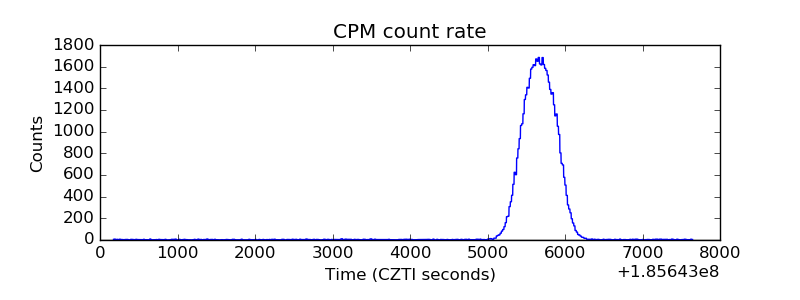 |
| CZT Counter | 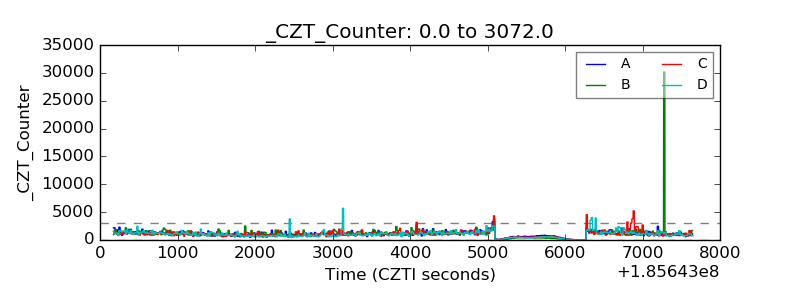 |
| +2.5 Volts monitor |  |
| +5 Volts monitor |  |
| _ROLL_ROT | 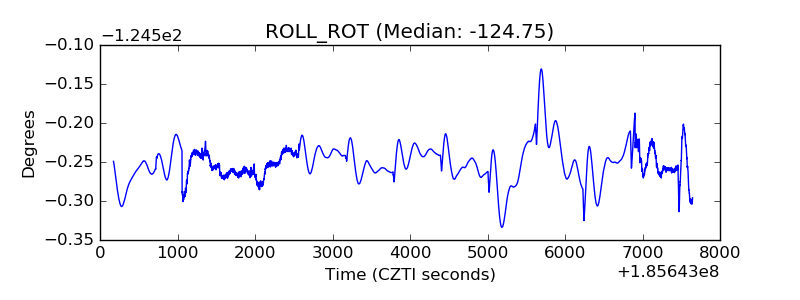 |
| _Roll_DEC | 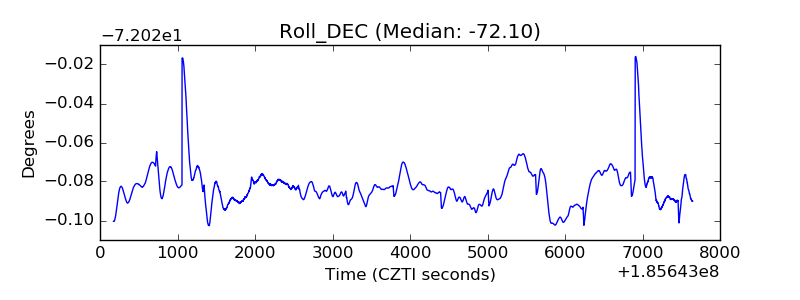 |
| _Roll_RA | 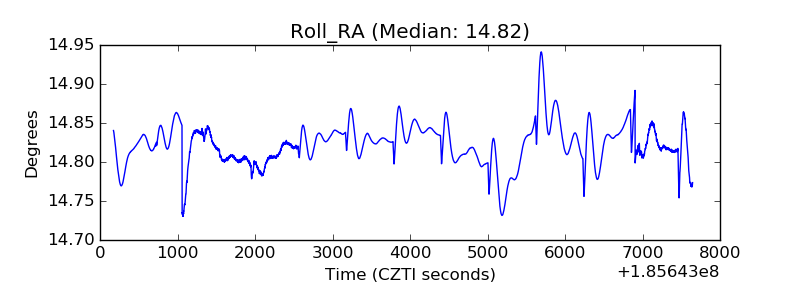 |
| Veto Counter | 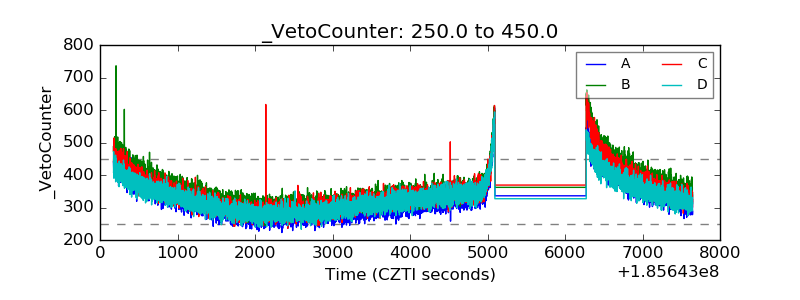 |