| Param | Original file | Final file |
|---|---|---|
| Filename | modeM0/AS1P01_010T01_9000000108_00780cztM0_level2.evt | modeM0/AS1P01_010T01_9000000108_00780cztM0_level2_quad_clean.evt |
| Size (bytes) | 894,395,520 | 90,469,440 |
| Size | 853.0 MB | 86.3 MB |
| Events in quadrant A | 6,621,152 | 595,638 |
| Events in quadrant B | 7,001,389 | 604,557 |
| Events in quadrant C | 6,782,712 | 576,167 |
| Events in quadrant D | 6,300,314 | 562,451 |
| Mode SS | |||
|---|---|---|---|
| Quadrant | BADHDUFLAG | Total packets | Discarded packets |
| A | 0 | 118 | 0 |
| B | 0 | 118 | 0 |
| C | 0 | 118 | 0 |
| D | 0 | 118 | 0 |
| Mode M0 | |||
|---|---|---|---|
| Quadrant | BADHDUFLAG | Total packets | Discarded packets |
| A | 0 | 23746 | 0 |
| B | 0 | 24897 | 0 |
| C | 0 | 24216 | 0 |
| D | 0 | 22814 | 0 |
| Mode M9 | |||
|---|---|---|---|
| Quadrant | BADHDUFLAG | Total packets | Discarded packets |
| A | 0 | 12 | 0 |
| B | 0 | 12 | 0 |
| C | 0 | 12 | 0 |
| D | 0 | 12 | 0 |
| Quadrant | Total seconds | Saturated seconds | Saturation percentage |
|---|---|---|---|
| A | 5731 | 7 | 0.122143% |
| B | 5731 | 19 | 0.331530% |
| C | 5730 | 51 | 0.890052% |
| D | 5731 | 35 | 0.610714% |
Noise dominated data is calculated using 1-second bins in cleaned event files. If a bin has >2000 counts, and if more than 50% of those come from <1% of pixels, then it is considered to be noise-dominated and hence unusable.
| Quadrant | # 1 sec bins | Bins with >0 counts | Bins with >2000 counts | High rate bins dominated by noise | Noise dominated (total time) | Noise dominated (detector-on time) | Marked lightcurve |
|---|---|---|---|---|---|---|---|
| A | 6981 | 5732 | 141 | 141 | 2.02% | 2.46% | 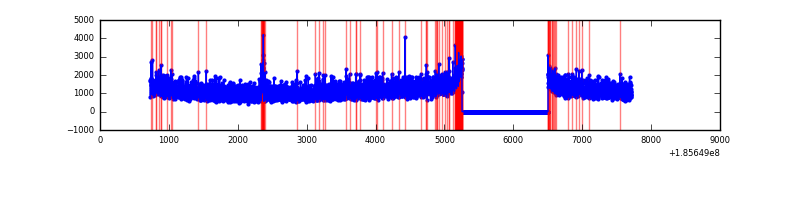 |
| B | 6981 | 5732 | 170 | 170 | 2.44% | 2.97% | 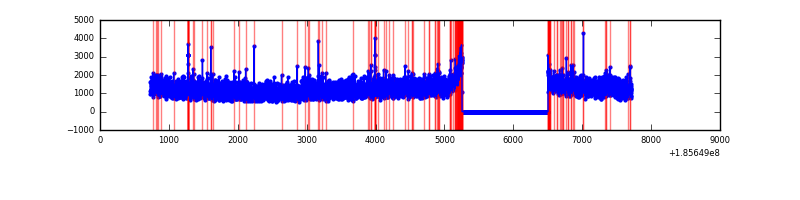 |
| C | 6980 | 5731 | 256 | 256 | 3.67% | 4.47% | 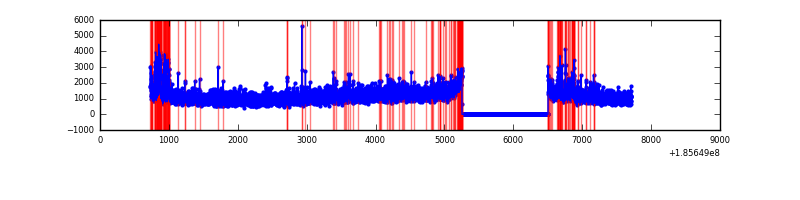 |
| D | 6981 | 5732 | 149 | 149 | 2.13% | 2.60% | 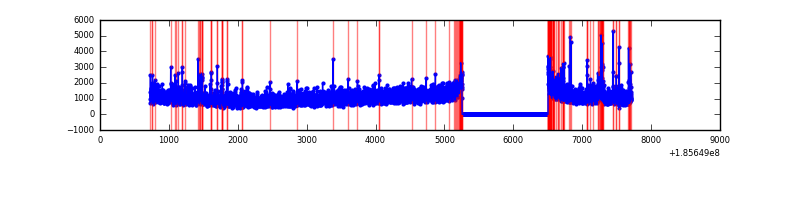 |
Top three noisy pixels from each quadrant. If the there are fewer than three noisy pixels in the level2.evt file, extra rows are filled as -1
| Pixel properties | Quadrant properties | ||||||
|---|---|---|---|---|---|---|---|
| Quadrant | DetID | PixID | Counts | Sigma | Mean | Median | Sigma |
| A | 15 | 171 | 54321 | 129.37 | 1692 | 1703 | 406.7 |
| A | 8 | 192 | 46546 | 110.25 | 1692 | 1703 | 406.7 |
| A | 15 | 17 | 14852 | 32.33 | 1692 | 1703 | 406.7 |
| B | 4 | 232 | 43748 | 100.94 | 1788 | 1799 | 415.6 |
| B | 5 | 191 | 30784 | 69.74 | 1788 | 1799 | 415.6 |
| B | 0 | 182 | 30390 | 68.8 | 1788 | 1799 | 415.6 |
| C | 10 | 17 | 237296 | 533.84 | 1589 | 1637 | 441.4 |
| C | 10 | 207 | 235864 | 530.6 | 1589 | 1637 | 441.4 |
| C | 15 | 241 | 60502 | 133.35 | 1589 | 1637 | 441.4 |
| D | 12 | 188 | 186035 | 394.17 | 1516 | 1565 | 468.0 |
| D | 6 | 226 | 145746 | 308.08 | 1516 | 1565 | 468.0 |
| D | 13 | 25 | 131559 | 277.76 | 1516 | 1565 | 468.0 |
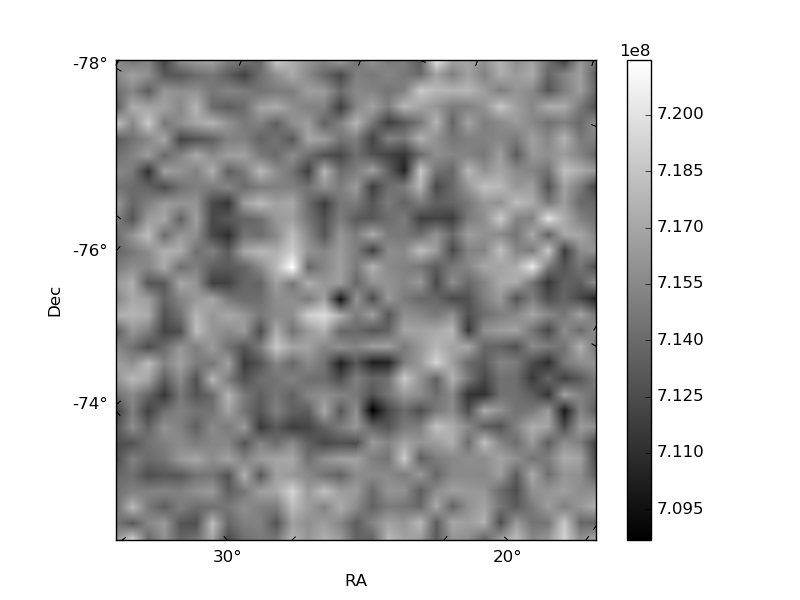
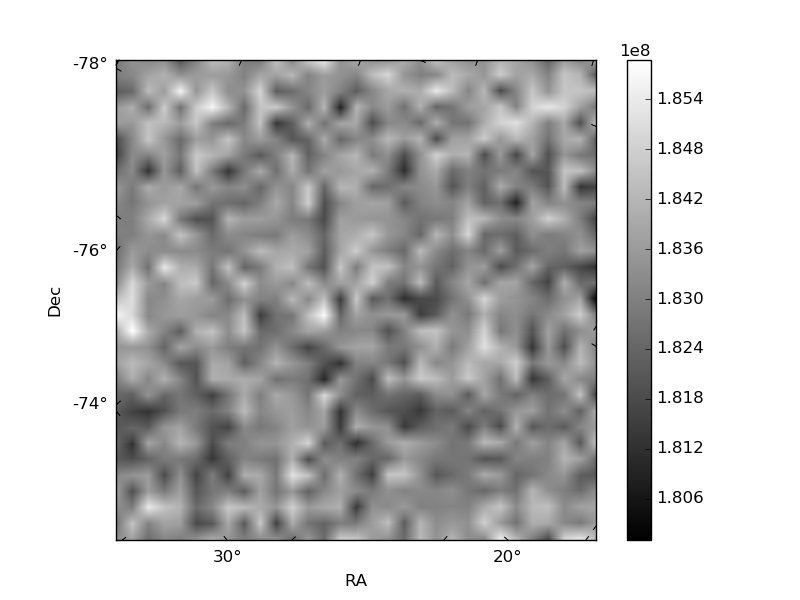
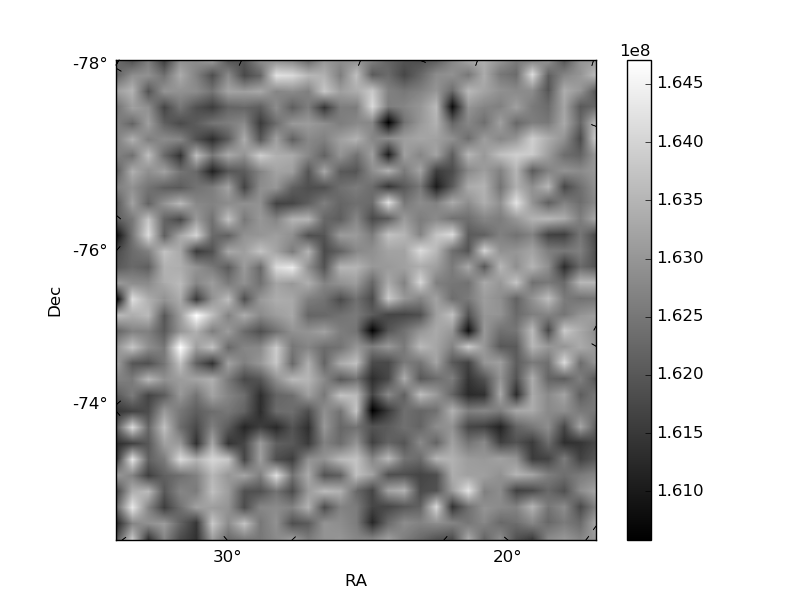
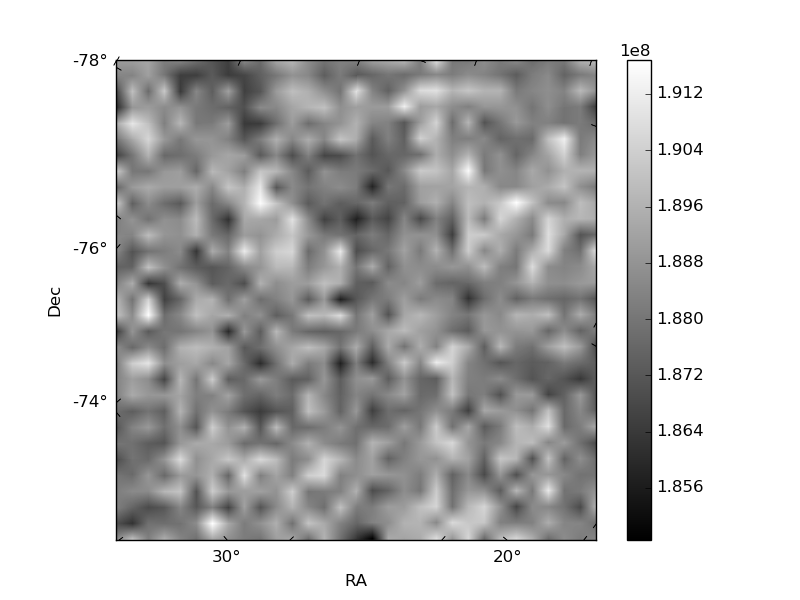
Histogram calculated using DETX and DETY for each event in the final _common_clean file
| Quadrant A | 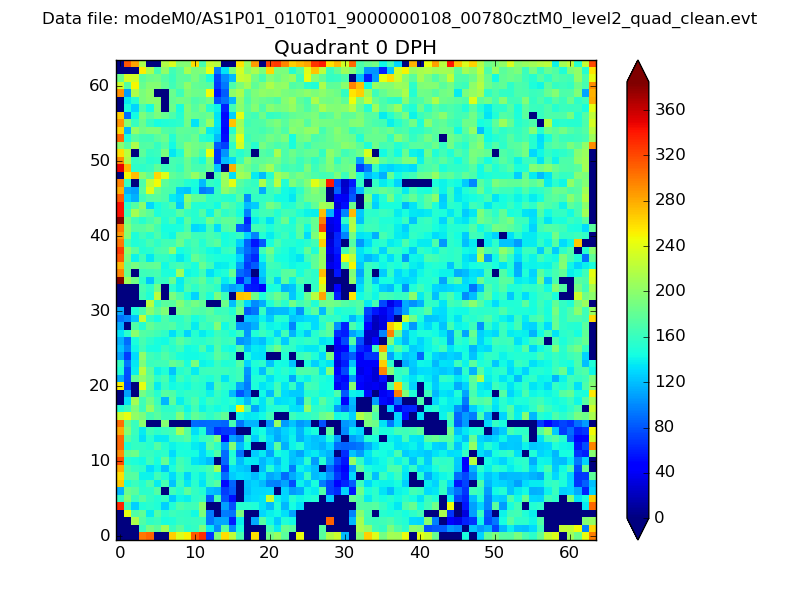 |
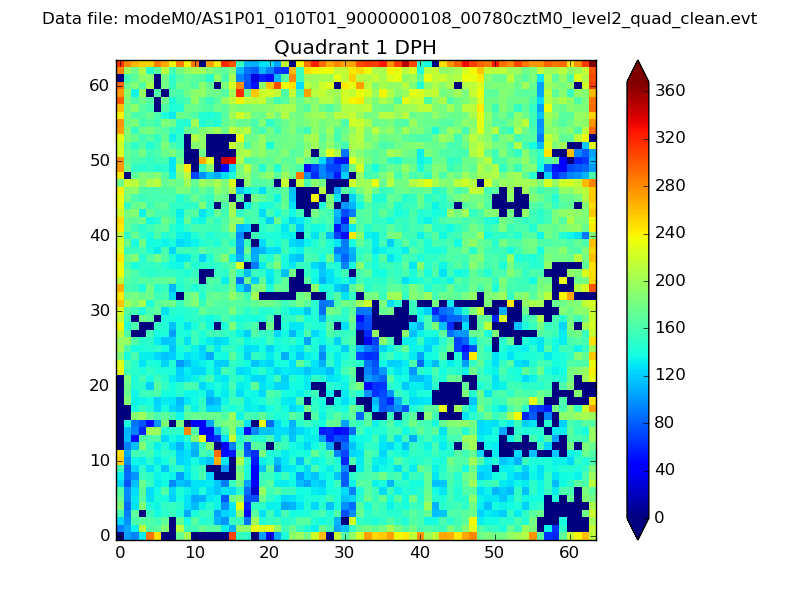 |
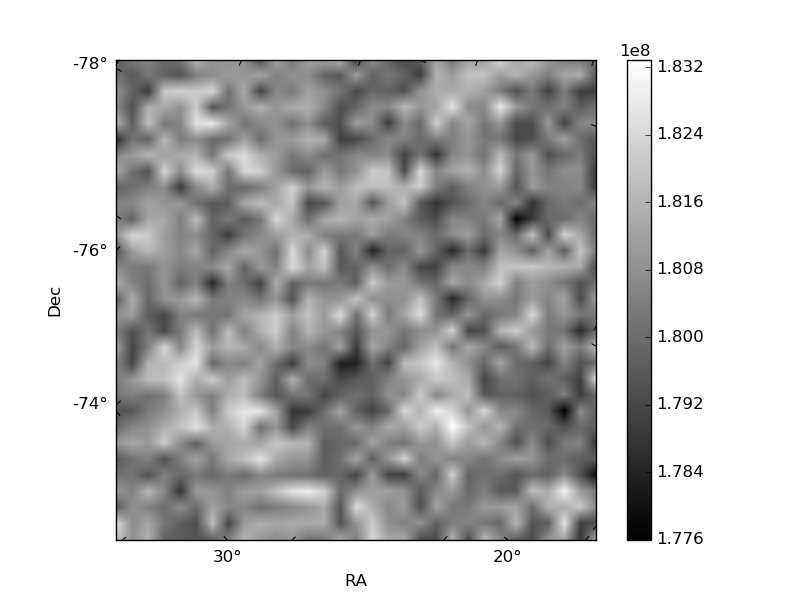
Quadrant B |
|---|---|---|---|
| Quadrant D | 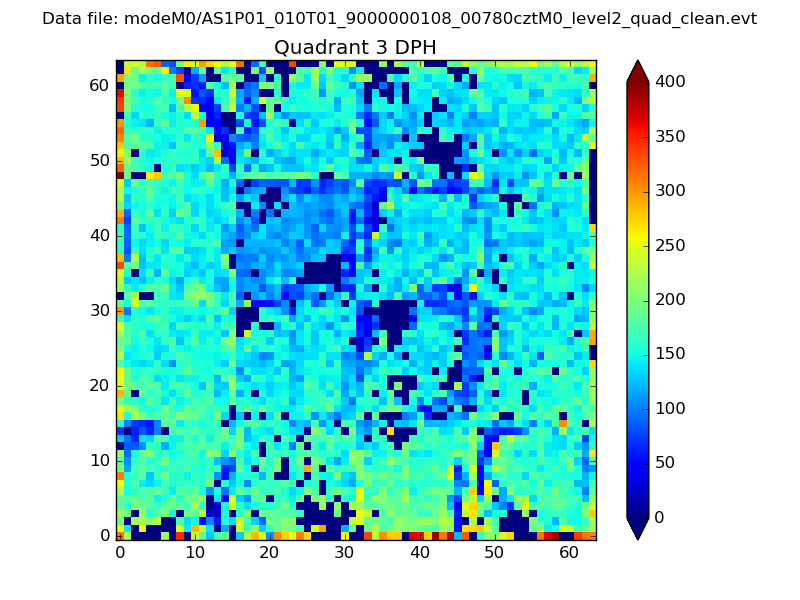 |
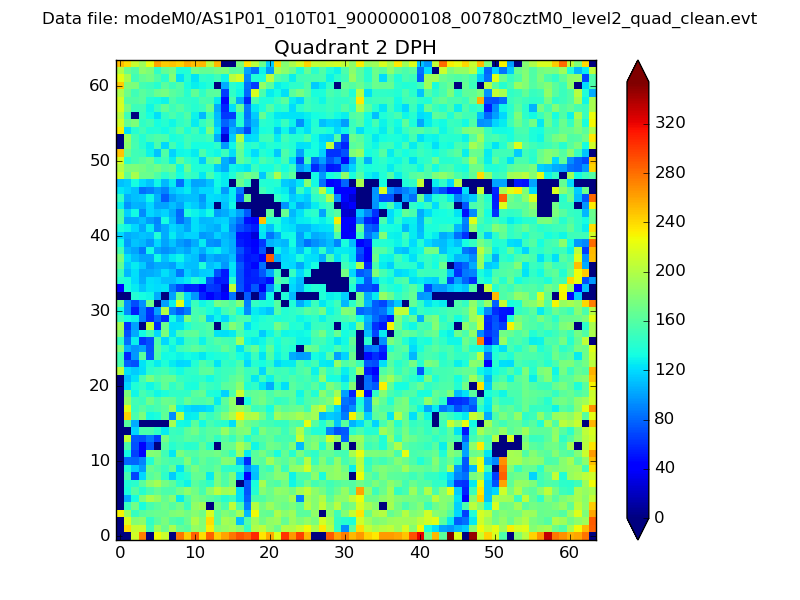 |
Quadrant C |
| Plot type | Count rate plots | Images |
|---|---|---|
| Comparison with Poisson distribution Blue bars denote a histogram of data divided into 1 sec bins. Red curve is a Poisson curve with rate = median count rate of data. |
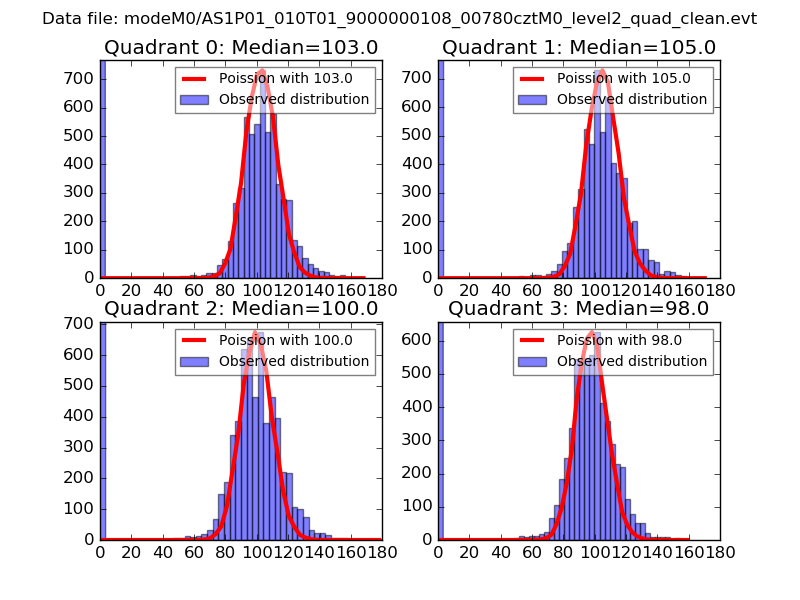 |
 |
| Quadrant-wise count rates Data is divided into 100 sec bins |
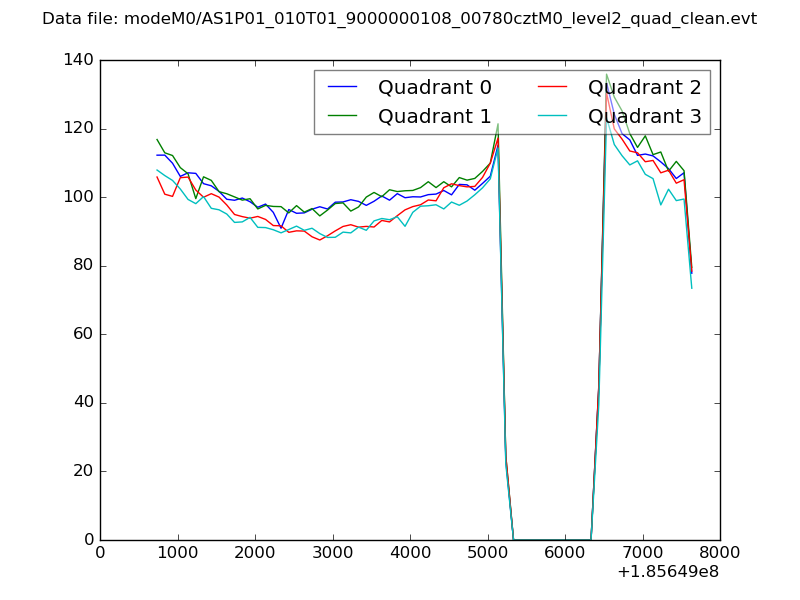 |
|
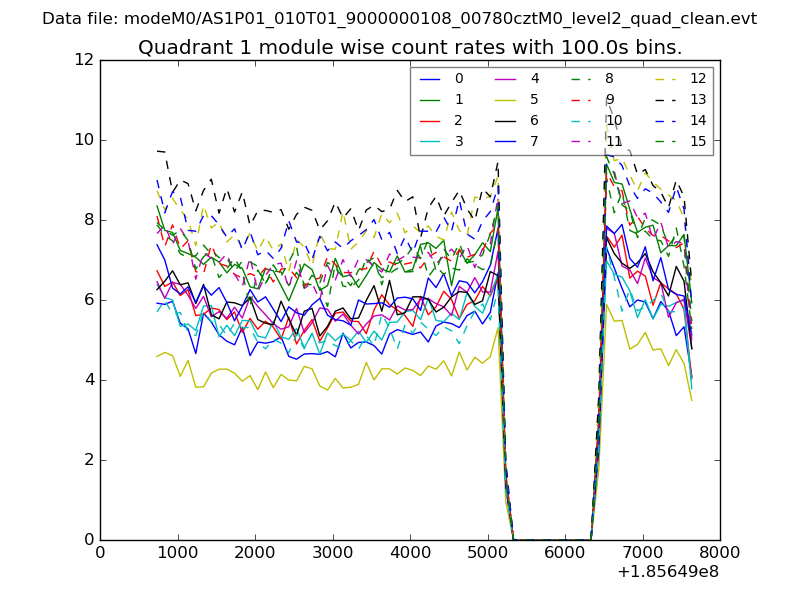
| Module-wise count rates for Quadrant A Data is divided into 100 sec bins |
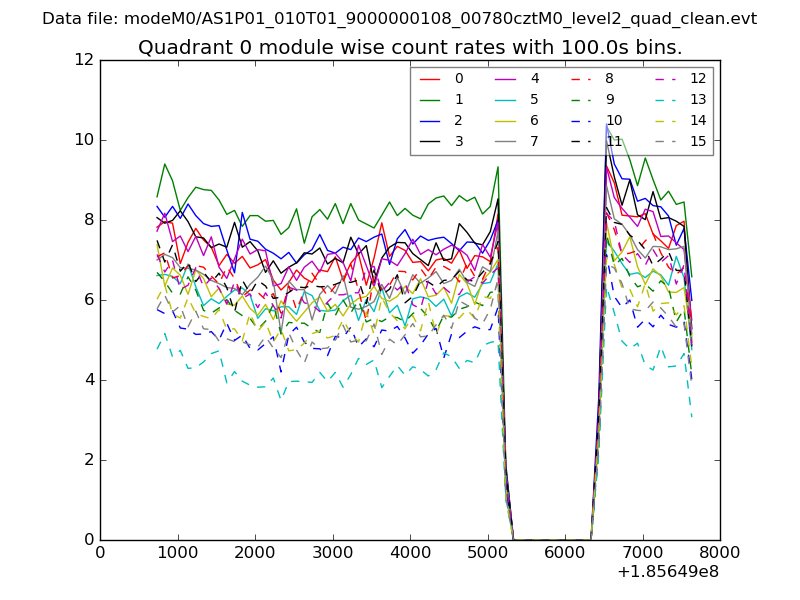 |
 |
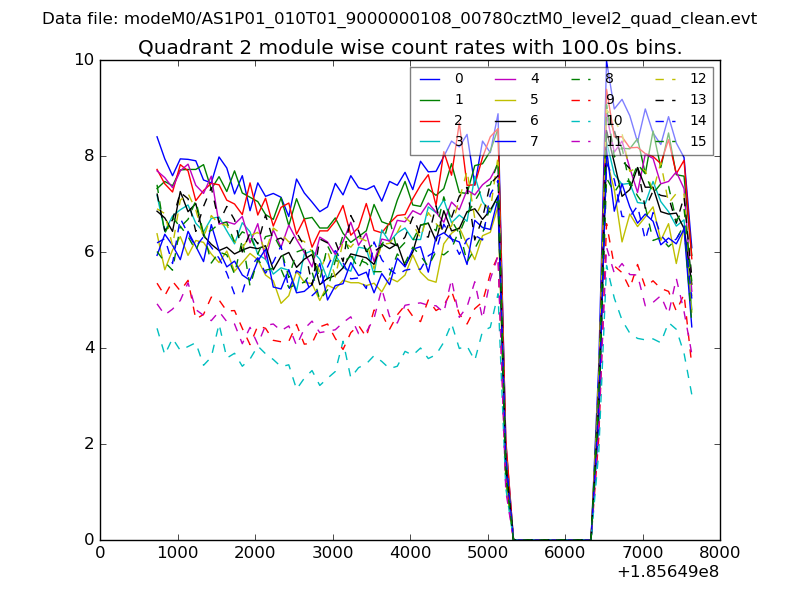
| Module-wise count rates for Quadrant B Data is divided into 100 sec bins |
 |
 |
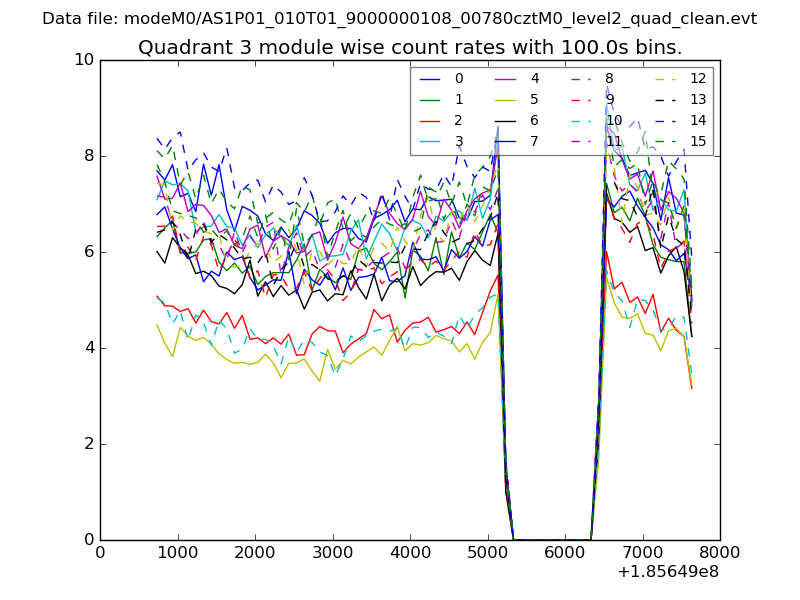
| Module-wise count rates for Quadrant C Data is divided into 100 sec bins |
 |
 |
| Module-wise count rates for Quadrant D Data is divided into 100 sec bins |
 |
 |
| Parameter | Plot |
|---|---|
| CZT HV Monitor | 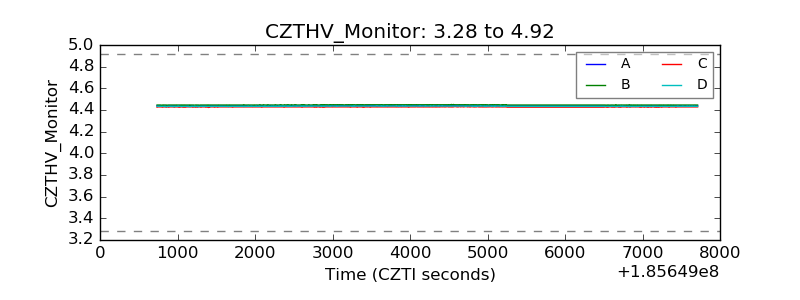 |
| D_VDD | 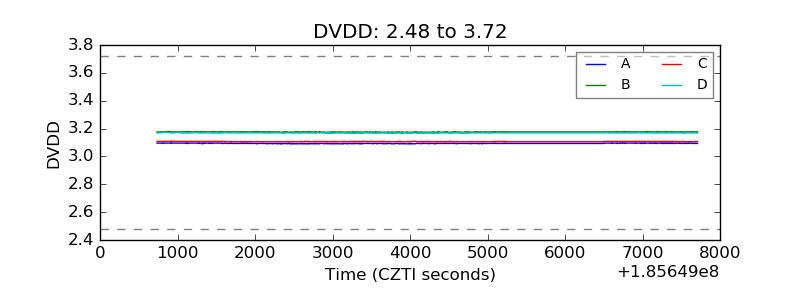 |
| Temperature 1 | 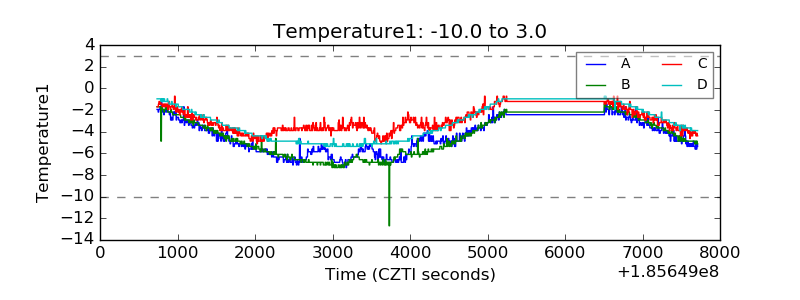 |
| Veto HV Monitor | 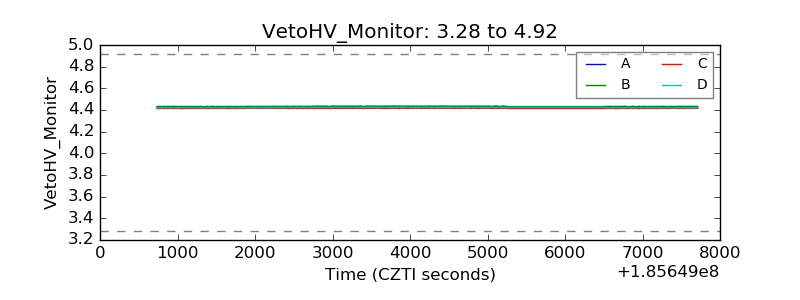 |
| Veto LLD | 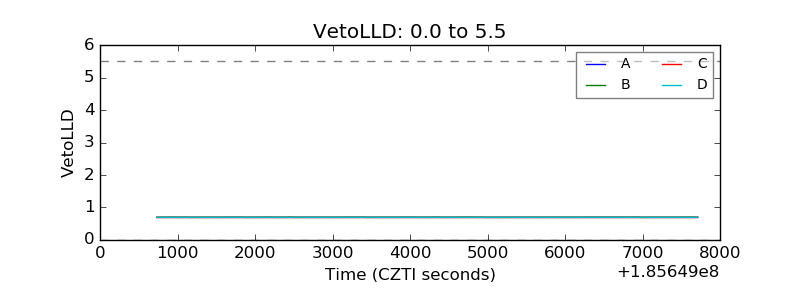 |
| Alpha Counter | 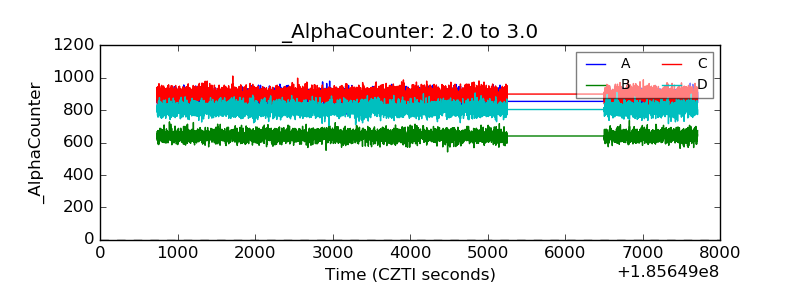 |
| _CPM_Rate | 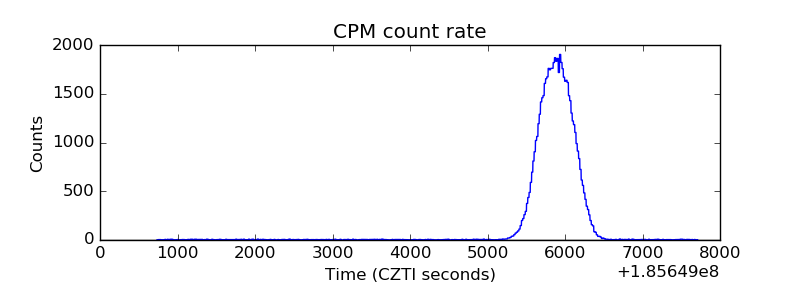 |
| CZT Counter | 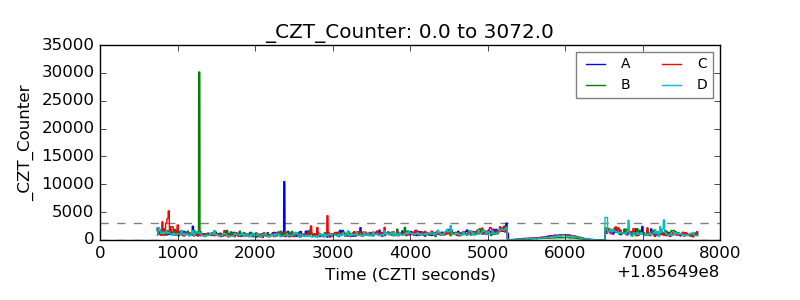 |
| +2.5 Volts monitor |  |
| +5 Volts monitor |  |
| _ROLL_ROT | 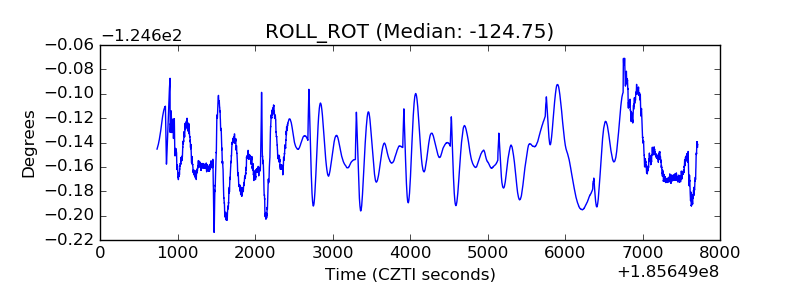 |
| _Roll_DEC | 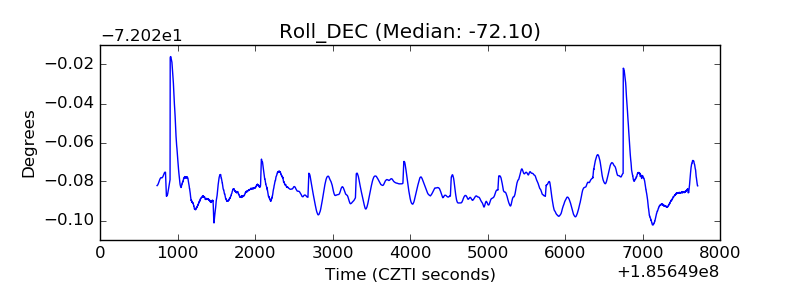 |
| _Roll_RA | 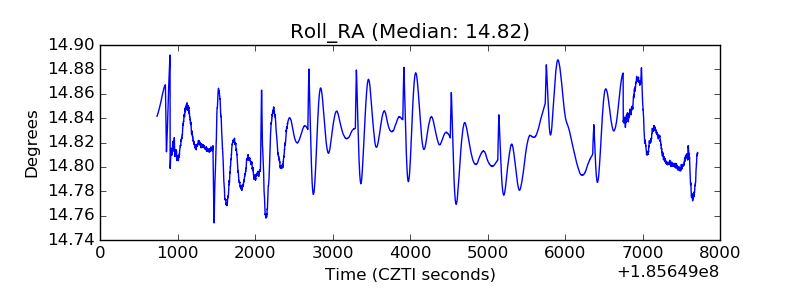 |
| Veto Counter | 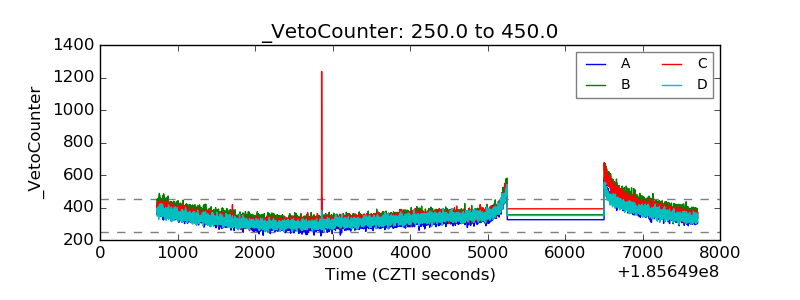 |