| Param | Original file | Final file |
|---|---|---|
| Filename | modeM0/AS1P01_010T01_9000000108_00782cztM0_level2.evt | modeM0/AS1P01_010T01_9000000108_00782cztM0_level2_quad_clean.evt |
| Size (bytes) | 1,060,015,680 | 98,913,600 |
| Size | 1010.9 MB | 94.3 MB |
| Events in quadrant A | 7,315,611 | 649,915 |
| Events in quadrant B | 7,755,931 | 664,243 |
| Events in quadrant C | 9,885,024 | 619,456 |
| Events in quadrant D | 6,726,038 | 619,379 |
| Mode SS | |||
|---|---|---|---|
| Quadrant | BADHDUFLAG | Total packets | Discarded packets |
| A | 0 | 128 | 0 |
| B | 0 | 128 | 0 |
| C | 0 | 128 | 0 |
| D | 0 | 128 | 0 |
| Mode M0 | |||
|---|---|---|---|
| Quadrant | BADHDUFLAG | Total packets | Discarded packets |
| A | 0 | 26291 | 0 |
| B | 0 | 27513 | 0 |
| C | 0 | 33821 | 0 |
| D | 0 | 24558 | 0 |
| Mode M9 | |||
|---|---|---|---|
| Quadrant | BADHDUFLAG | Total packets | Discarded packets |
| A | 0 | 14 | 0 |
| B | 0 | 14 | 0 |
| C | 0 | 14 | 0 |
| D | 0 | 14 | 0 |
| Quadrant | Total seconds | Saturated seconds | Saturation percentage |
|---|---|---|---|
| A | 6345 | 10 | 0.157604% |
| B | 6344 | 11 | 0.173392% |
| C | 6344 | 217 | 3.420555% |
| D | 6344 | 35 | 0.551702% |
Noise dominated data is calculated using 1-second bins in cleaned event files. If a bin has >2000 counts, and if more than 50% of those come from <1% of pixels, then it is considered to be noise-dominated and hence unusable.
| Quadrant | # 1 sec bins | Bins with >0 counts | Bins with >2000 counts | High rate bins dominated by noise | Noise dominated (total time) | Noise dominated (detector-on time) | Marked lightcurve |
|---|---|---|---|---|---|---|---|
| A | 7571 | 6347 | 165 | 165 | 2.18% | 2.60% | 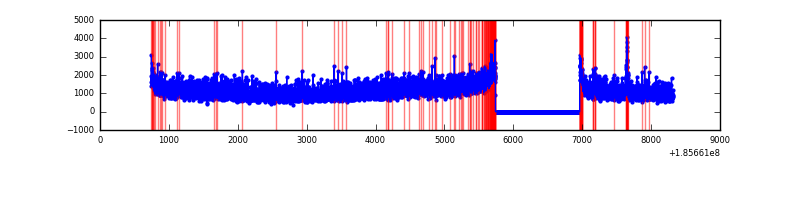 |
| B | 7570 | 6346 | 214 | 214 | 2.83% | 3.37% | 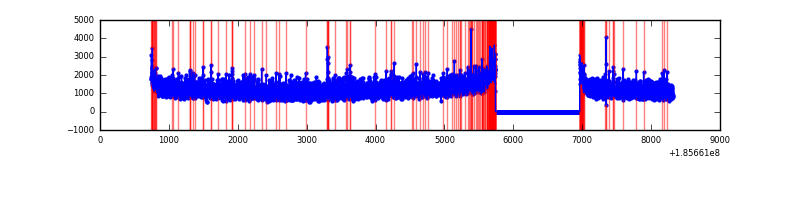 |
| C | 7570 | 6346 | 1165 | 1165 | 15.39% | 18.36% | 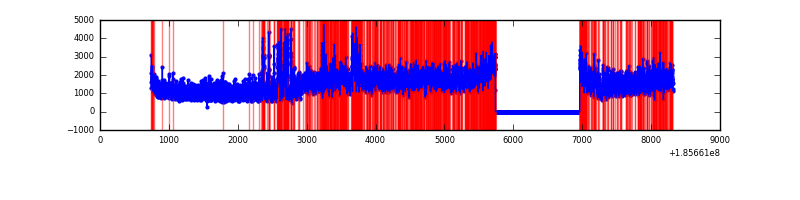 |
| D | 7570 | 6346 | 126 | 126 | 1.66% | 1.99% | 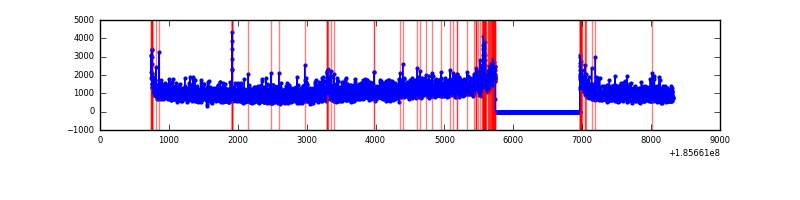 |
Top three noisy pixels from each quadrant. If the there are fewer than three noisy pixels in the level2.evt file, extra rows are filled as -1
| Pixel properties | Quadrant properties | ||||||
|---|---|---|---|---|---|---|---|
| Quadrant | DetID | PixID | Counts | Sigma | Mean | Median | Sigma |
| A | 12 | 243 | 41600 | 87.81 | 1884 | 1898 | 452.1 |
| A | 8 | 192 | 21884 | 44.2 | 1884 | 1898 | 452.1 |
| A | 15 | 233 | 15663 | 30.44 | 1884 | 1898 | 452.1 |
| B | 5 | 191 | 49428 | 102.21 | 2004 | 2011 | 463.9 |
| B | 15 | 85 | 18942 | 36.49 | 2004 | 2011 | 463.9 |
| B | 11 | 51 | 18236 | 34.97 | 2004 | 2011 | 463.9 |
| C | 9 | 83 | 2497085 | 5061.4 | 1782 | 1842 | 493.0 |
| C | 10 | 17 | 309255 | 623.56 | 1782 | 1842 | 493.0 |
| C | 15 | 241 | 55025 | 107.88 | 1782 | 1842 | 493.0 |
| D | 1 | 4 | 110377 | 208.19 | 1706 | 1766 | 521.7 |
| D | 13 | 25 | 95782 | 180.21 | 1706 | 1766 | 521.7 |
| D | 10 | 85 | 83103 | 155.91 | 1706 | 1766 | 521.7 |
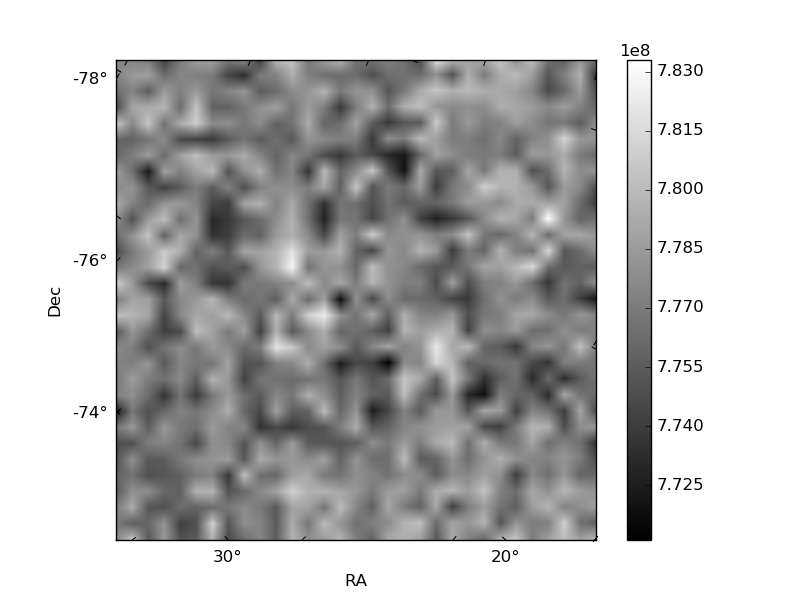
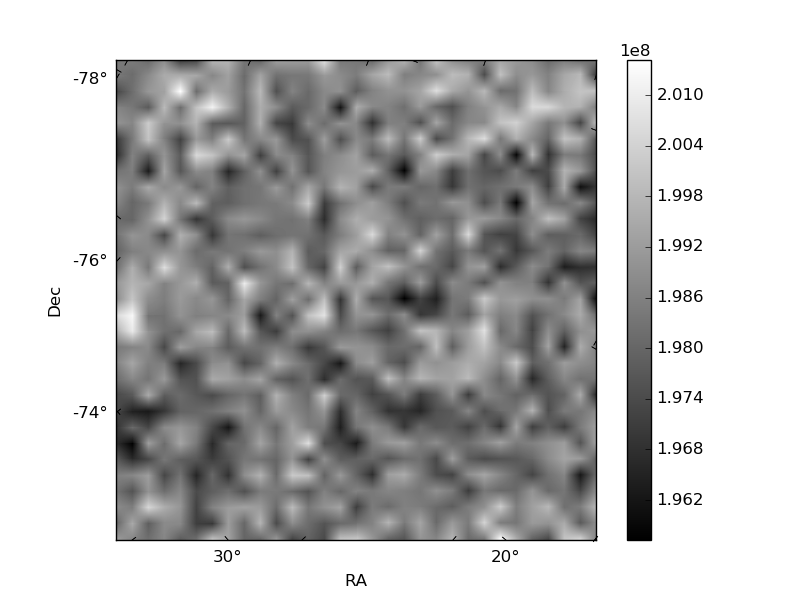
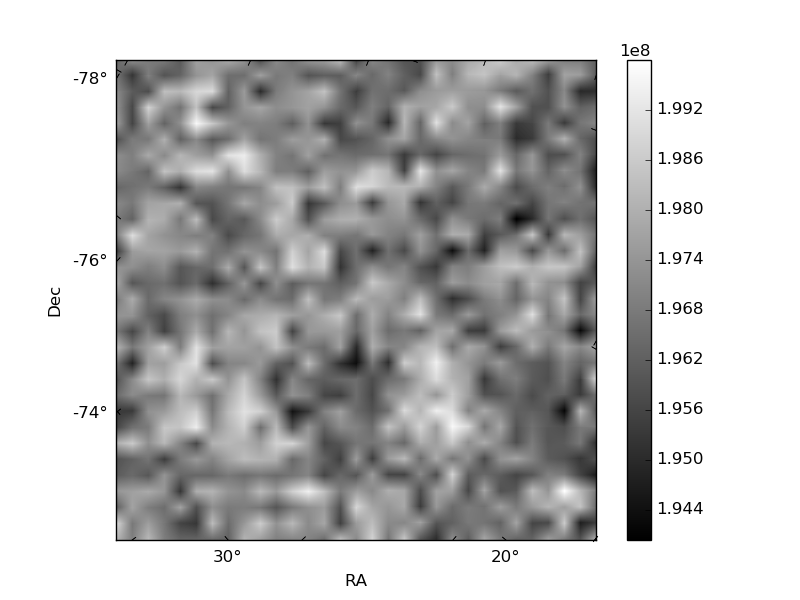
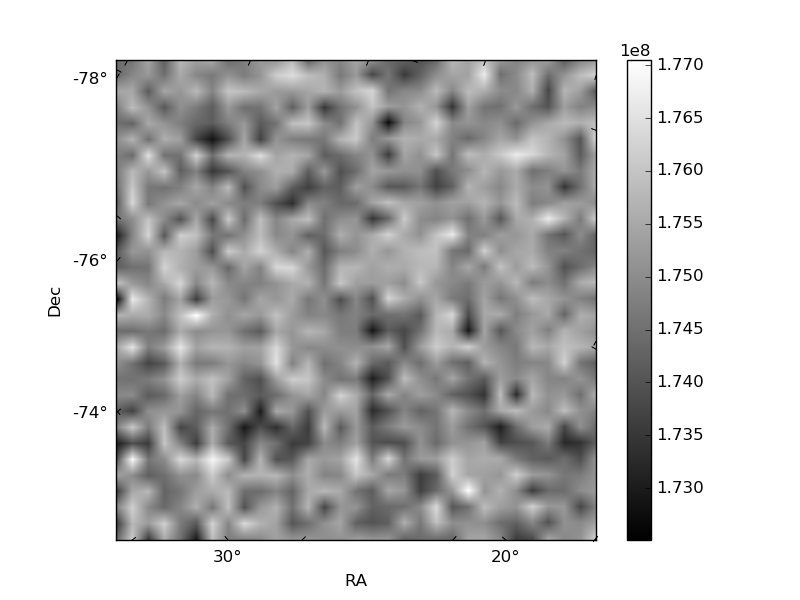
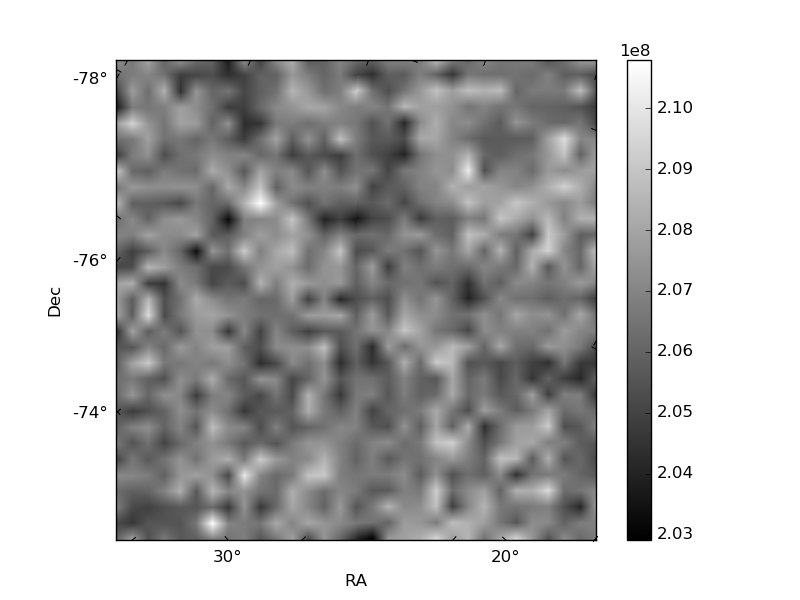
Histogram calculated using DETX and DETY for each event in the final _common_clean file
| Quadrant A | 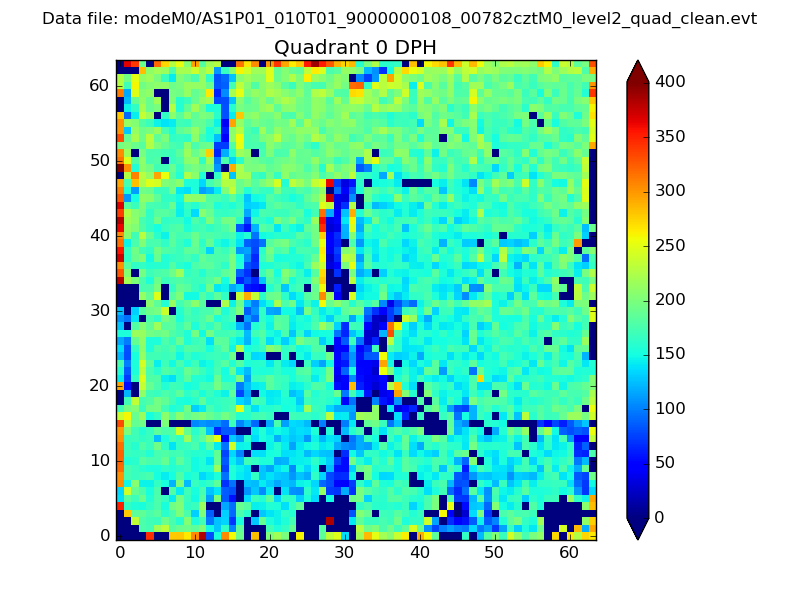 |
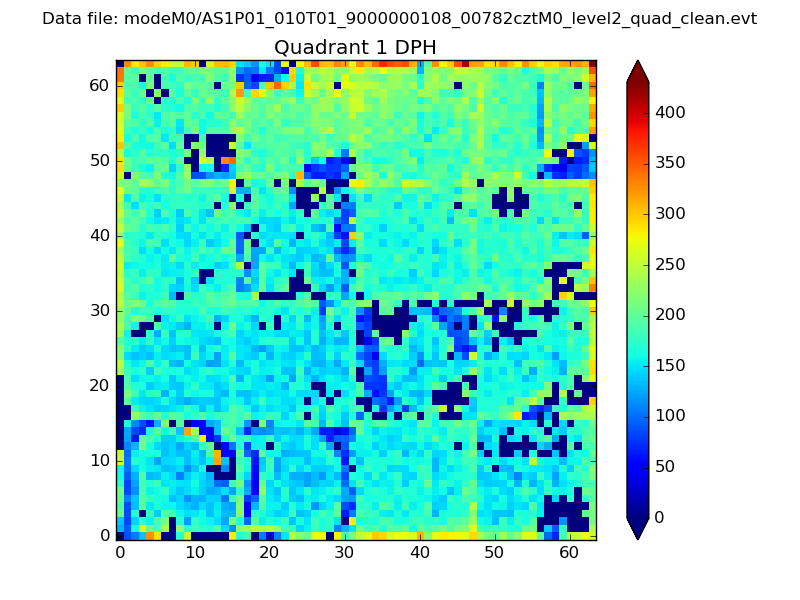 |
Quadrant B |
|---|---|---|---|
| Quadrant D | 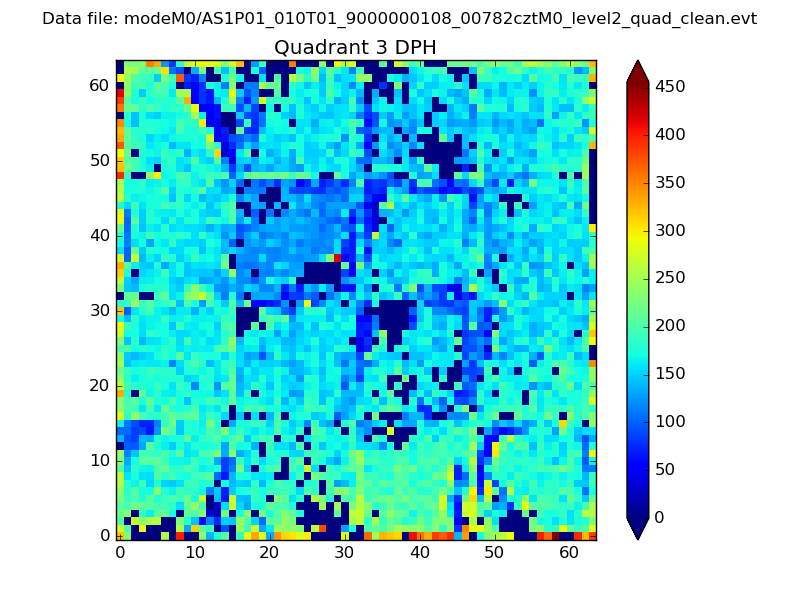 |
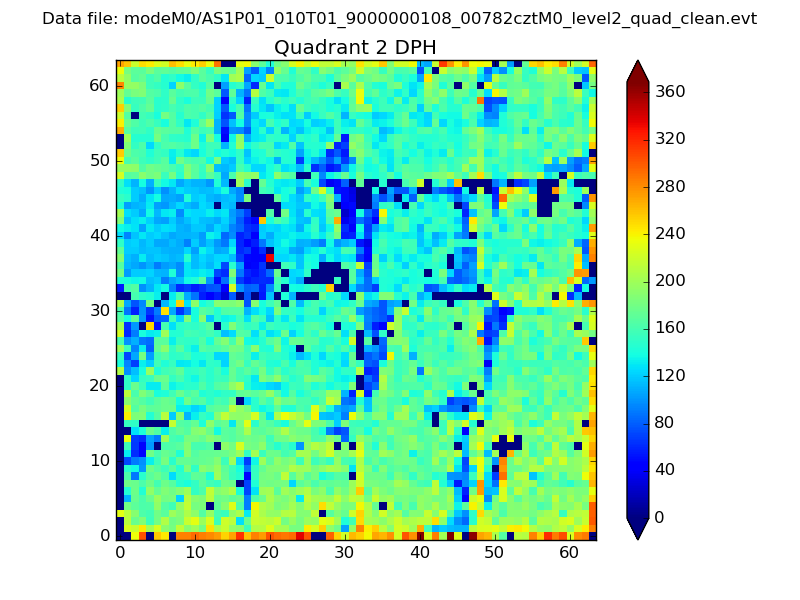 |
Quadrant C |
| Plot type | Count rate plots | Images |
|---|---|---|
| Comparison with Poisson distribution Blue bars denote a histogram of data divided into 1 sec bins. Red curve is a Poisson curve with rate = median count rate of data. |
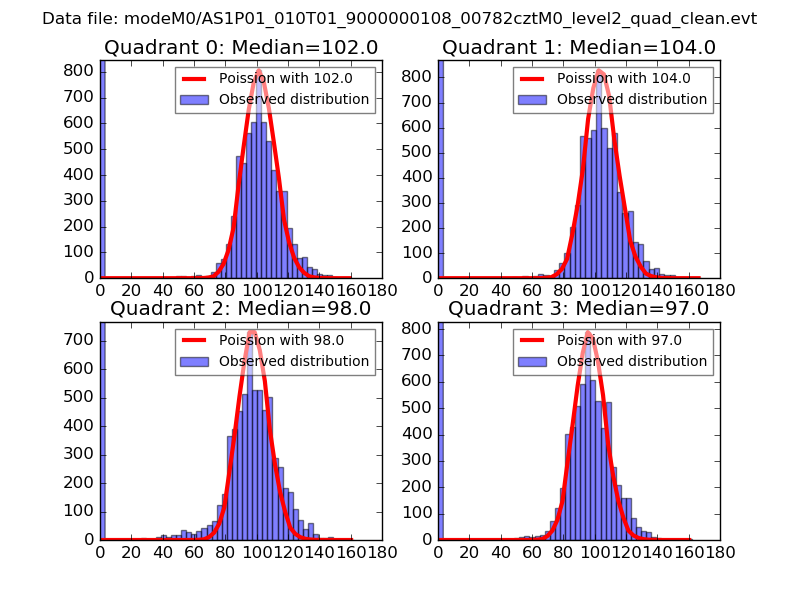 |
 |
| Quadrant-wise count rates Data is divided into 100 sec bins |
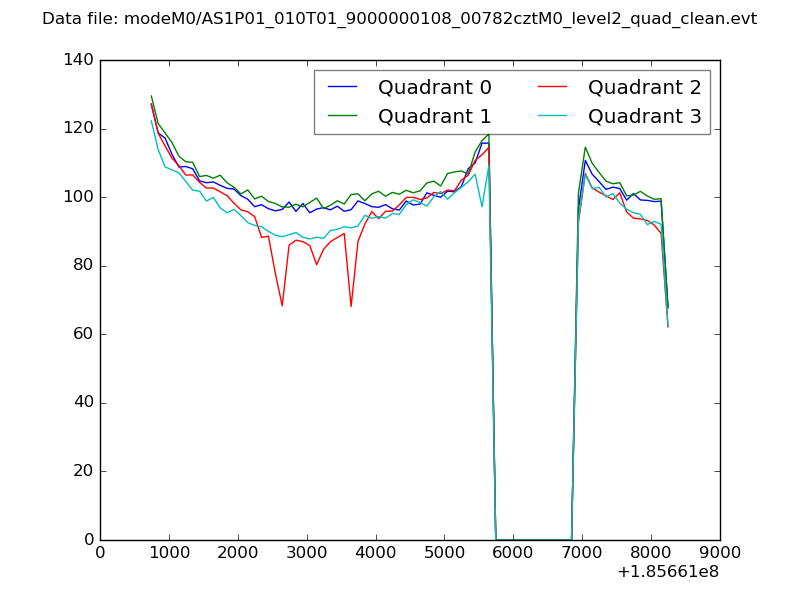 |
|
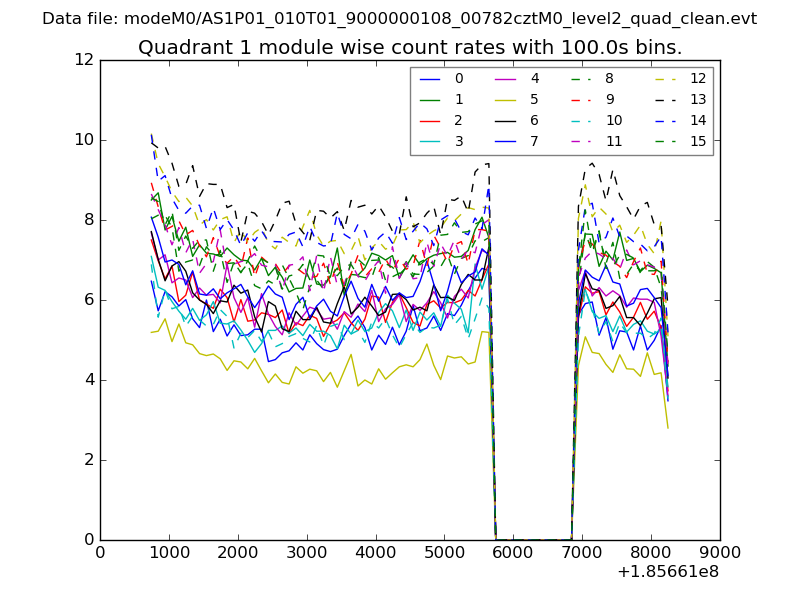
| Module-wise count rates for Quadrant A Data is divided into 100 sec bins |
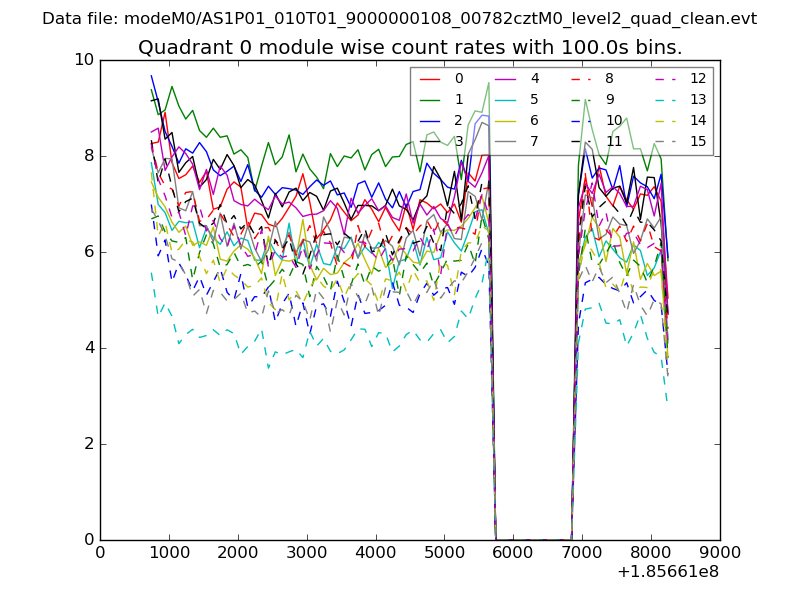 |
 |
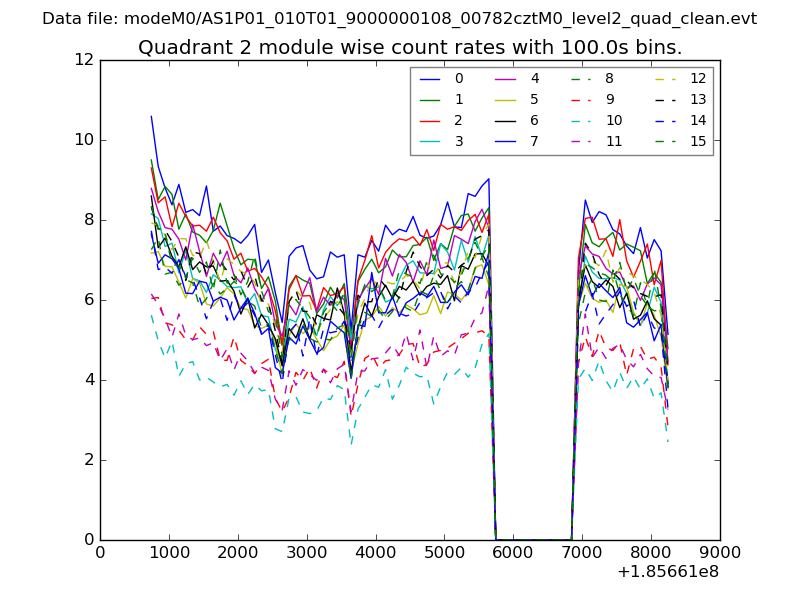
| Module-wise count rates for Quadrant B Data is divided into 100 sec bins |
 |
 |
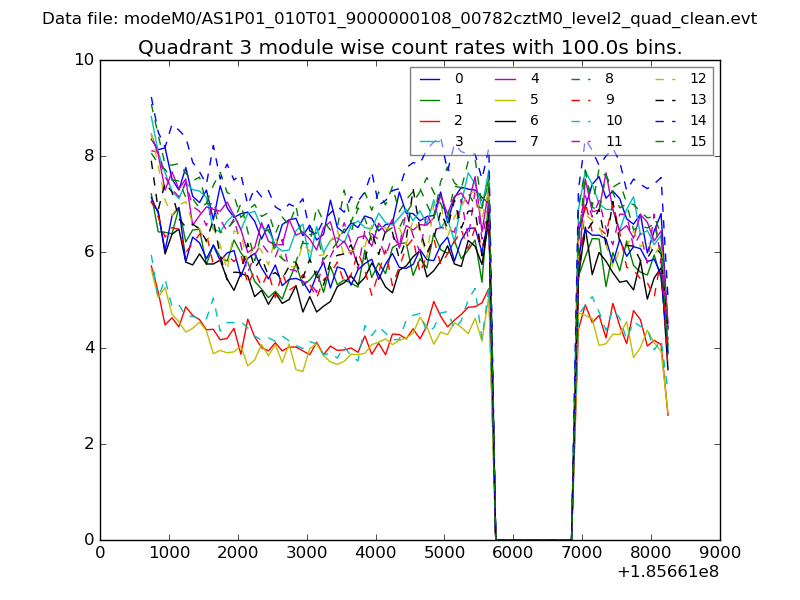
| Module-wise count rates for Quadrant C Data is divided into 100 sec bins |
 |
 |
| Module-wise count rates for Quadrant D Data is divided into 100 sec bins |
 |
 |
| Parameter | Plot |
|---|---|
| CZT HV Monitor | 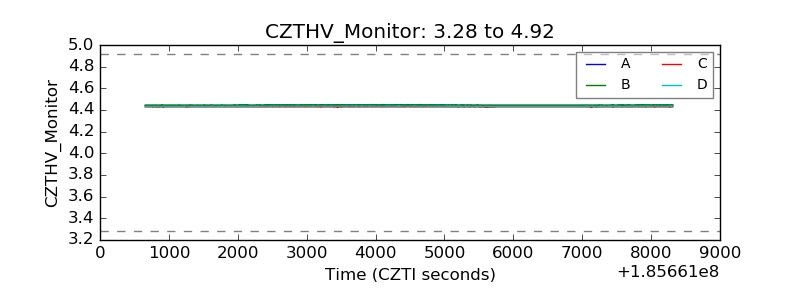 |
| D_VDD | 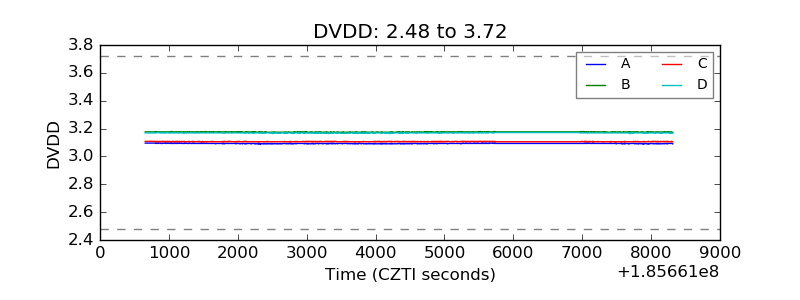 |
| Temperature 1 | 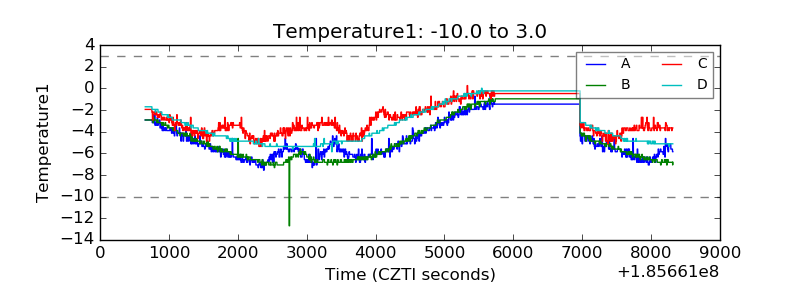 |
| Veto HV Monitor | 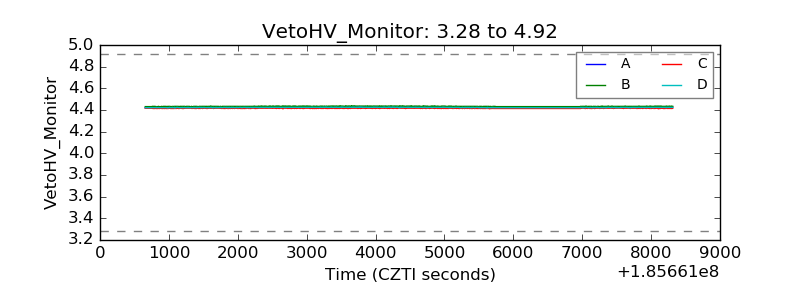 |
| Veto LLD | 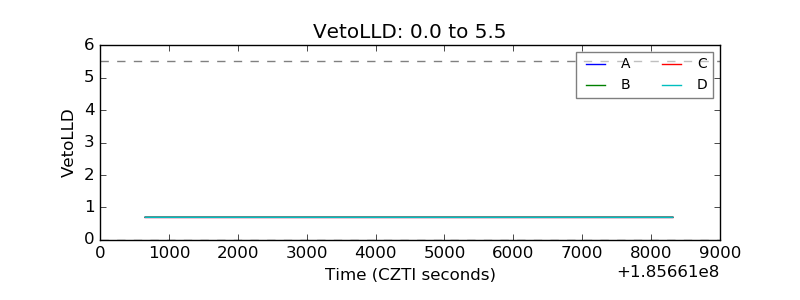 |
| Alpha Counter | 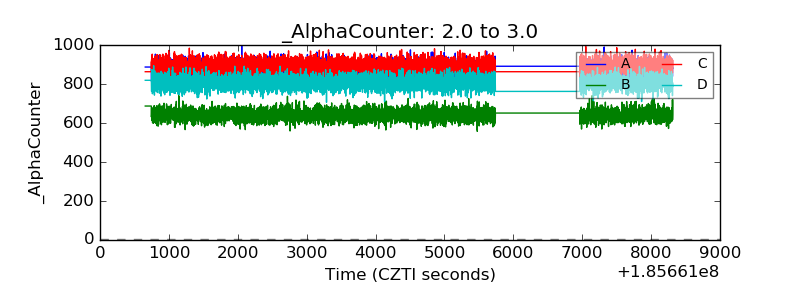 |
| _CPM_Rate | 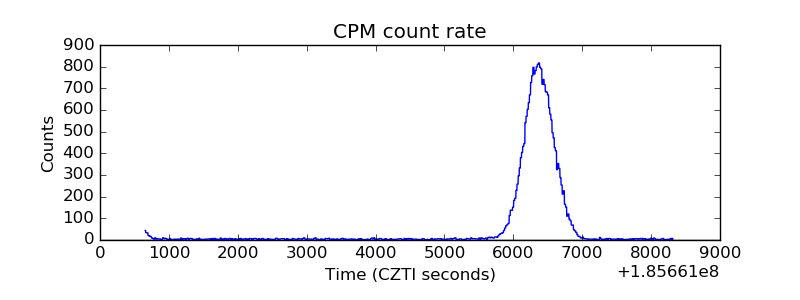 |
| CZT Counter | 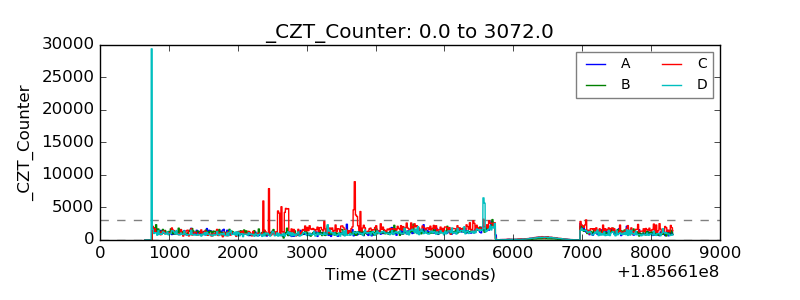 |
| +2.5 Volts monitor |  |
| +5 Volts monitor |  |
| _ROLL_ROT | 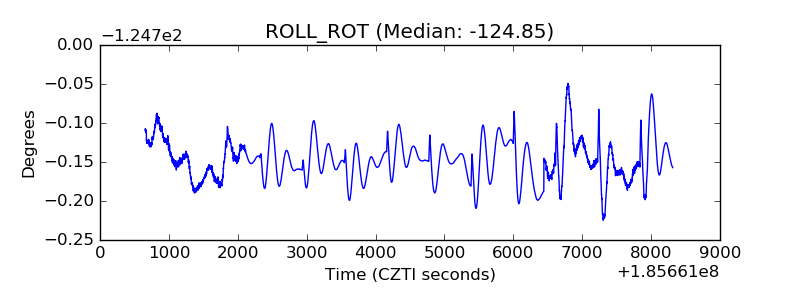 |
| _Roll_DEC | 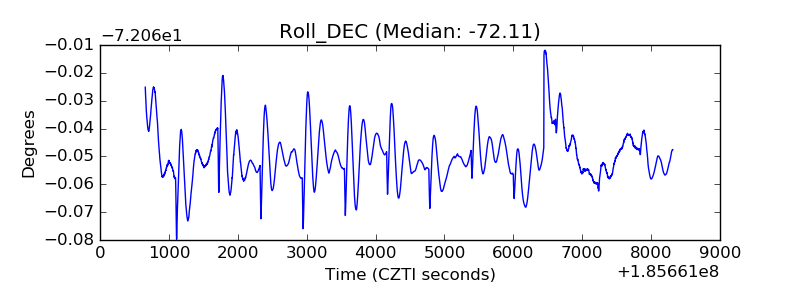 |
| _Roll_RA | 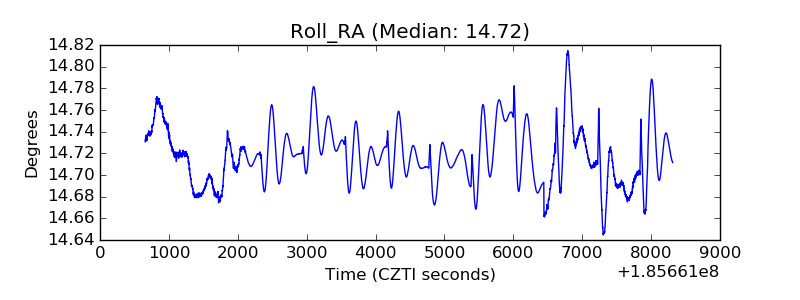 |
| Veto Counter | 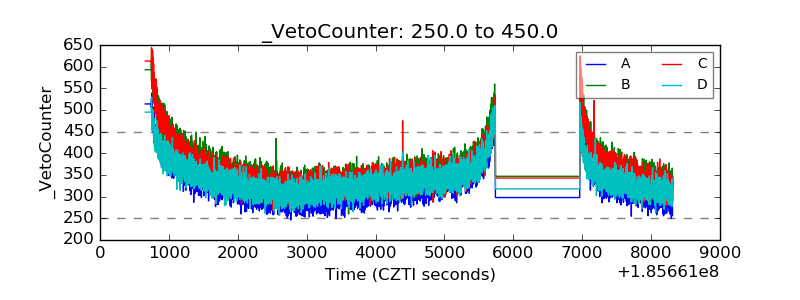 |