| Param | Original file | Final file |
|---|---|---|
| Filename | modeM0/AS1P01_010T01_9000000108_00783cztM0_level2.evt | modeM0/AS1P01_010T01_9000000108_00783cztM0_level2_quad_clean.evt |
| Size (bytes) | 1,140,140,160 | 104,385,600 |
| Size | 1.1 GB | 99.5 MB |
| Events in quadrant A | 7,964,124 | 684,084 |
| Events in quadrant B | 8,629,004 | 691,562 |
| Events in quadrant C | 10,107,231 | 651,001 |
| Events in quadrant D | 7,370,524 | 652,571 |
| Mode SS | |||
|---|---|---|---|
| Quadrant | BADHDUFLAG | Total packets | Discarded packets |
| A | 0 | 140 | 0 |
| B | 0 | 140 | 0 |
| C | 0 | 140 | 0 |
| D | 0 | 140 | 0 |
| Mode M0 | |||
|---|---|---|---|
| Quadrant | BADHDUFLAG | Total packets | Discarded packets |
| A | 0 | 28584 | 0 |
| B | 0 | 30560 | 0 |
| C | 0 | 34914 | 0 |
| D | 0 | 26844 | 0 |
| Mode M9 | |||
|---|---|---|---|
| Quadrant | BADHDUFLAG | Total packets | Discarded packets |
| A | 0 | 18 | 0 |
| B | 0 | 18 | 0 |
| C | 0 | 18 | 0 |
| D | 0 | 18 | 0 |
| Quadrant | Total seconds | Saturated seconds | Saturation percentage |
|---|---|---|---|
| A | 6920 | 15 | 0.216763% |
| B | 6920 | 102 | 1.473988% |
| C | 6919 | 347 | 5.015176% |
| D | 6919 | 35 | 0.505853% |
Noise dominated data is calculated using 1-second bins in cleaned event files. If a bin has >2000 counts, and if more than 50% of those come from <1% of pixels, then it is considered to be noise-dominated and hence unusable.
| Quadrant | # 1 sec bins | Bins with >0 counts | Bins with >2000 counts | High rate bins dominated by noise | Noise dominated (total time) | Noise dominated (detector-on time) | Marked lightcurve |
|---|---|---|---|---|---|---|---|
| A | 7925 | 6921 | 221 | 221 | 2.79% | 3.19% | 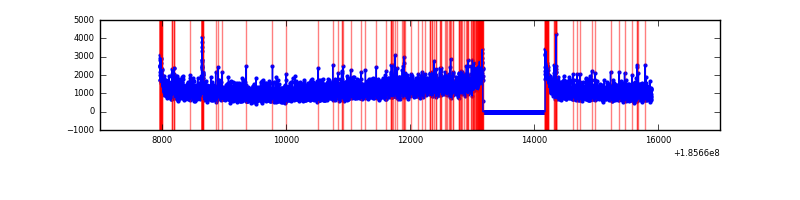 |
| B | 7925 | 6921 | 362 | 362 | 4.57% | 5.23% | 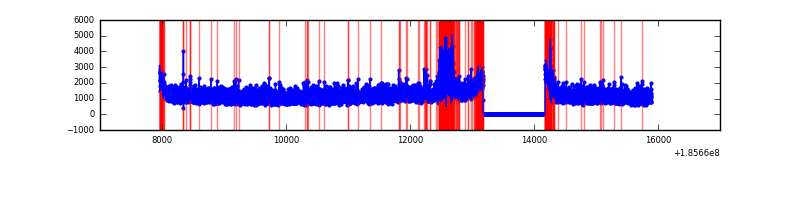 |
| C | 7924 | 6920 | 982 | 982 | 12.39% | 14.19% |  |
| D | 7924 | 6920 | 172 | 172 | 2.17% | 2.49% | 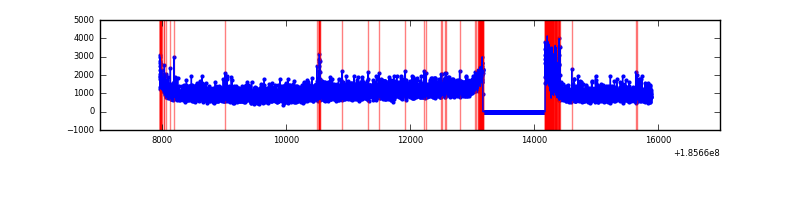 |
Top three noisy pixels from each quadrant. If the there are fewer than three noisy pixels in the level2.evt file, extra rows are filled as -1
| Pixel properties | Quadrant properties | ||||||
|---|---|---|---|---|---|---|---|
| Quadrant | DetID | PixID | Counts | Sigma | Mean | Median | Sigma |
| A | 12 | 243 | 50119 | 97.98 | 2046 | 2062 | 490.5 |
| A | 15 | 233 | 28597 | 54.1 | 2046 | 2062 | 490.5 |
| A | 15 | 17 | 16076 | 28.57 | 2046 | 2062 | 490.5 |
| B | 0 | 187 | 280145 | 554.47 | 2166 | 2173 | 501.3 |
| B | 5 | 191 | 48095 | 91.6 | 2166 | 2173 | 501.3 |
| B | 0 | 190 | 21052 | 37.66 | 2166 | 2173 | 501.3 |
| C | 9 | 83 | 1274436 | 2363.7 | 1949 | 2017 | 538.3 |
| C | 10 | 17 | 1071995 | 1987.64 | 1949 | 2017 | 538.3 |
| C | 9 | 52 | 62501 | 112.36 | 1949 | 2017 | 538.3 |
| D | 13 | 25 | 122363 | 208.4 | 1881 | 1948 | 577.8 |
| D | 1 | 4 | 105808 | 179.75 | 1881 | 1948 | 577.8 |
| D | 13 | 37 | 27378 | 44.01 | 1881 | 1948 | 577.8 |
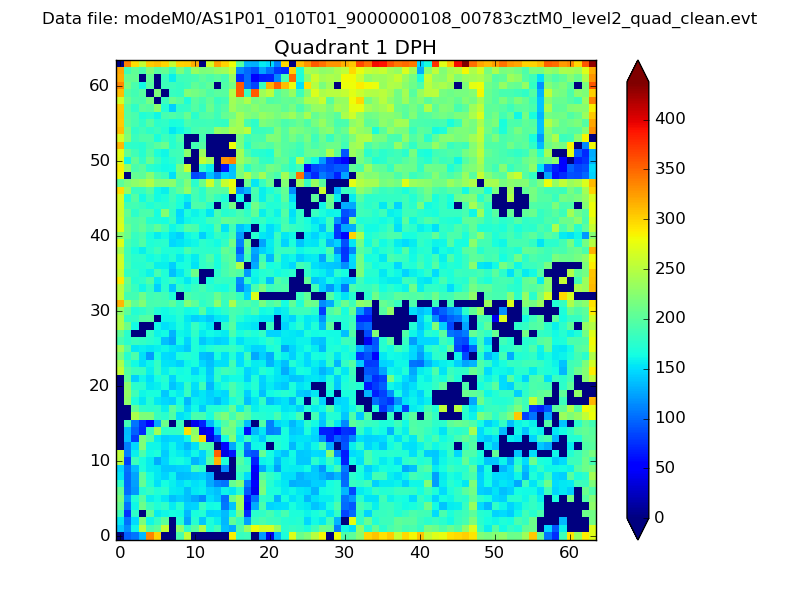
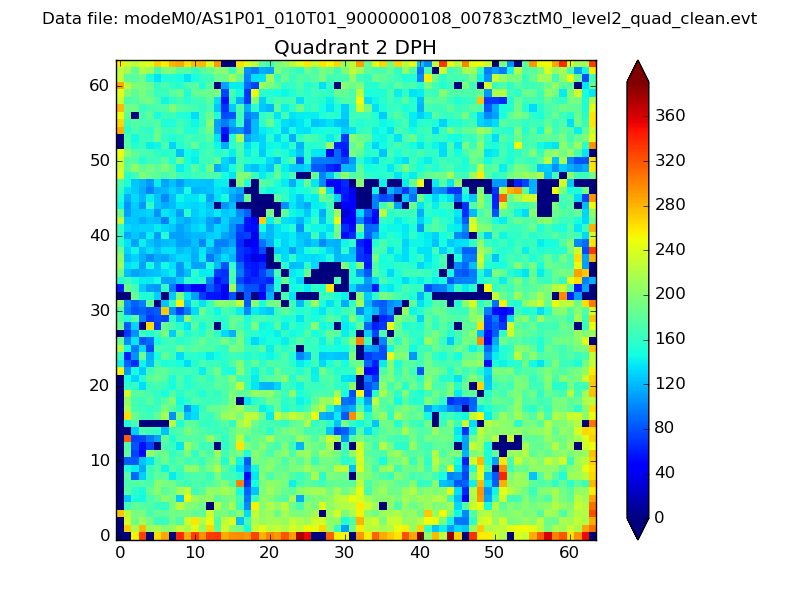
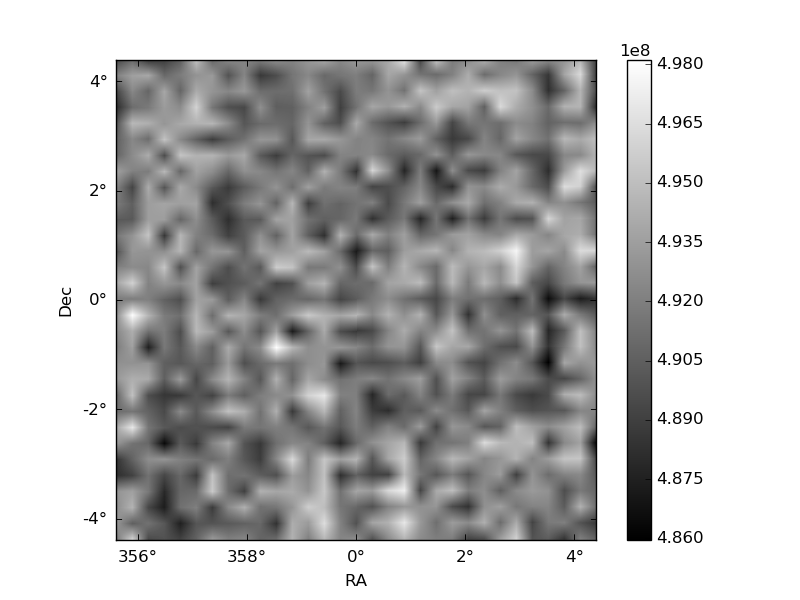
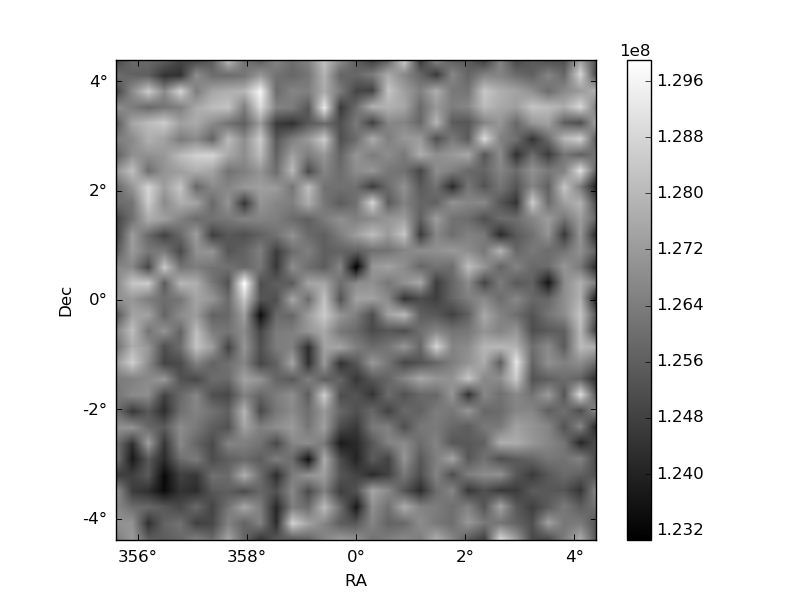
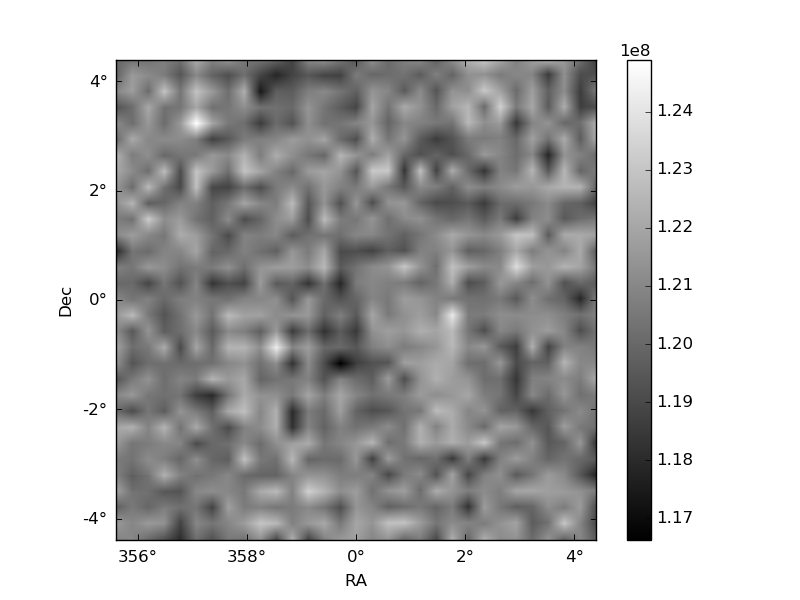
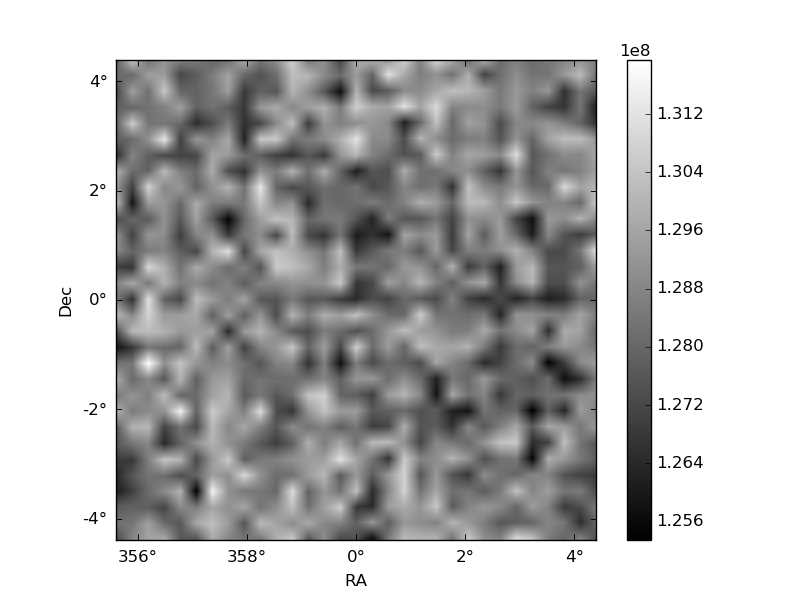
Histogram calculated using DETX and DETY for each event in the final _common_clean file
| Quadrant A | 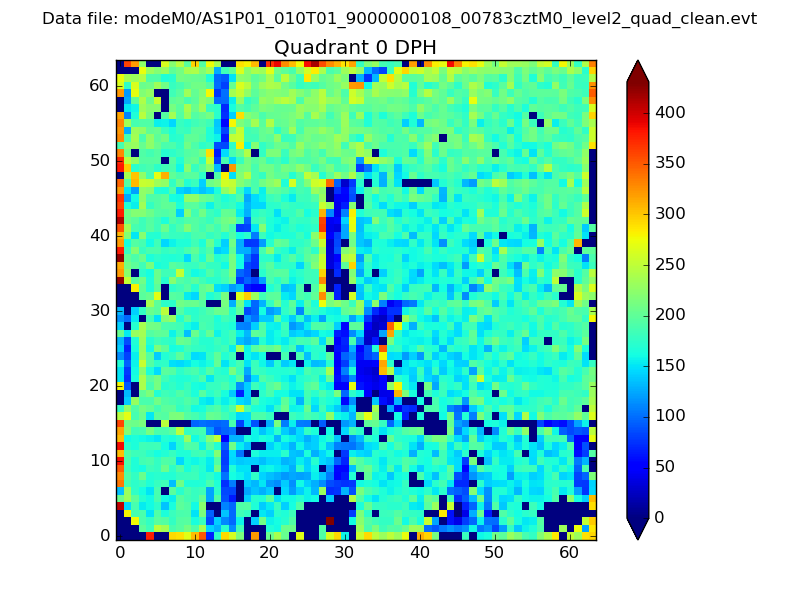 |
 |
Quadrant B |
|---|---|---|---|
| Quadrant D | 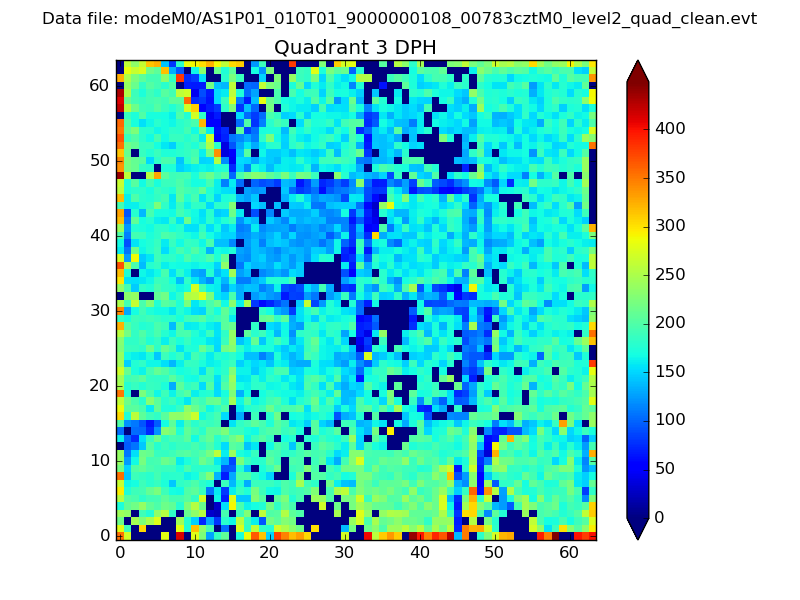 |
 |
Quadrant C |
| Plot type | Count rate plots | Images |
|---|---|---|
| Comparison with Poisson distribution Blue bars denote a histogram of data divided into 1 sec bins. Red curve is a Poisson curve with rate = median count rate of data. |
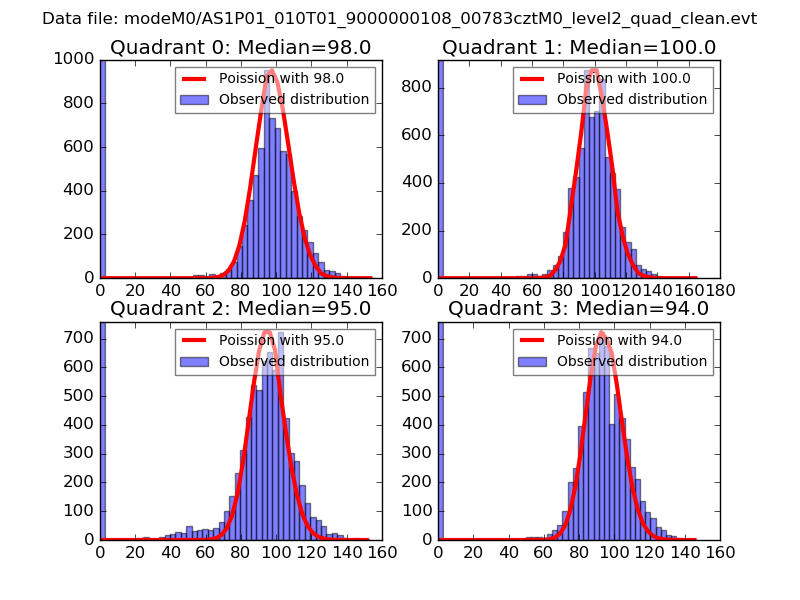 |
 |
| Quadrant-wise count rates Data is divided into 100 sec bins |
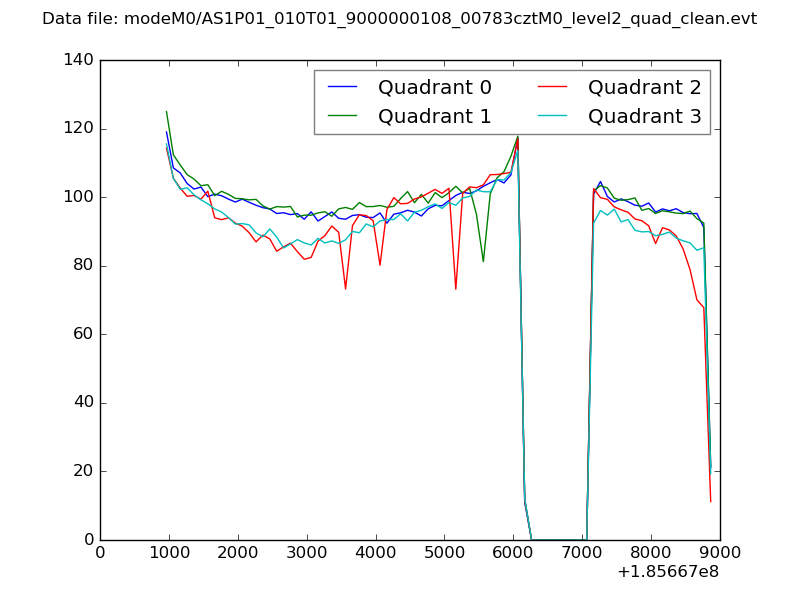 |
|
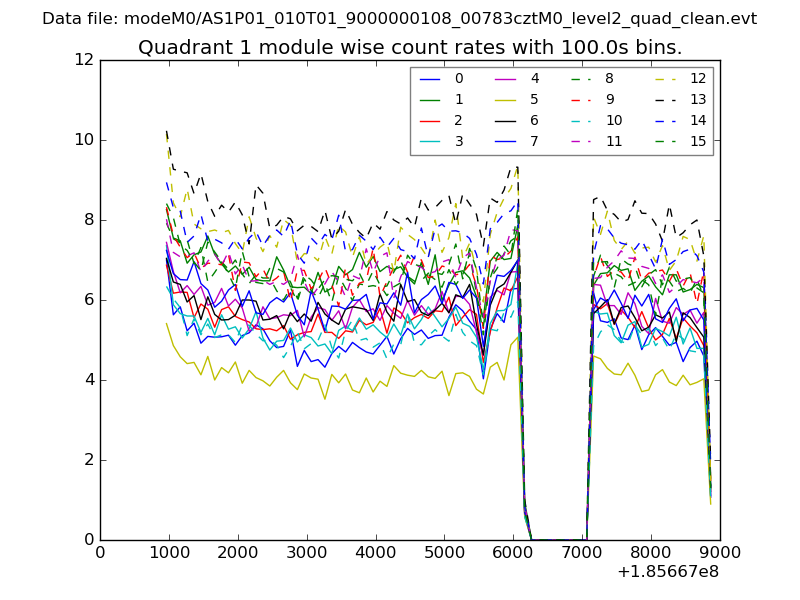
| Module-wise count rates for Quadrant A Data is divided into 100 sec bins |
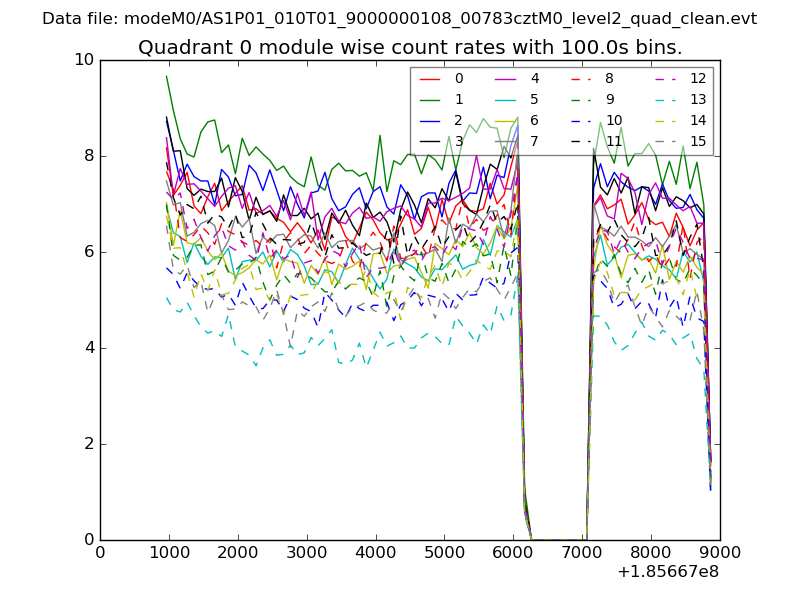 |
 |
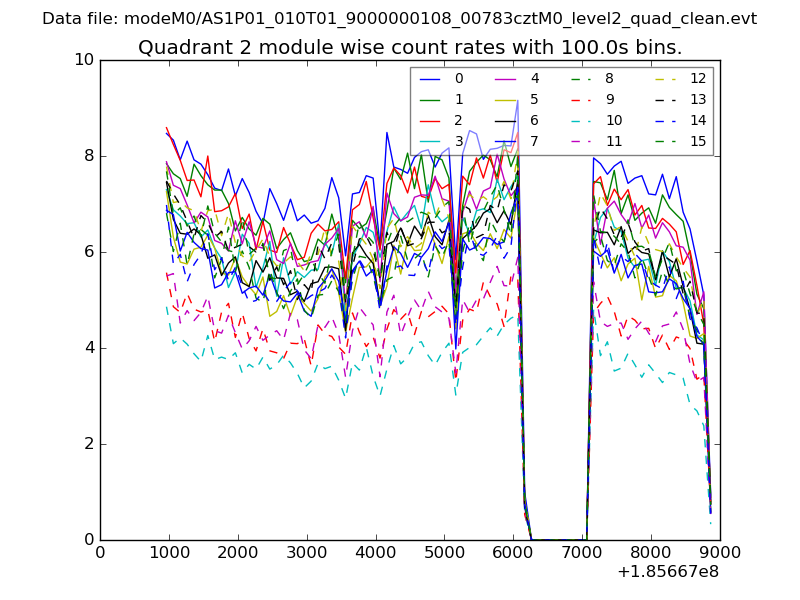
| Module-wise count rates for Quadrant B Data is divided into 100 sec bins |
 |
 |
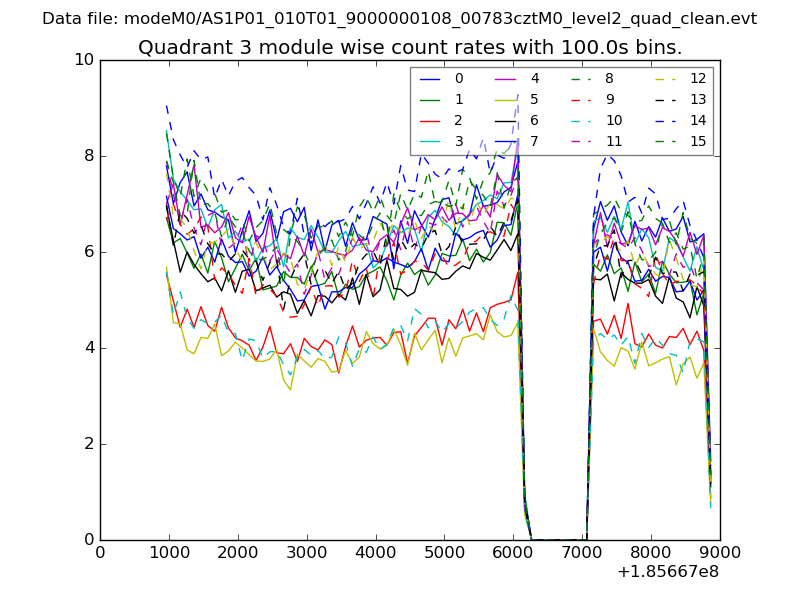
| Module-wise count rates for Quadrant C Data is divided into 100 sec bins |
 |
 |
| Module-wise count rates for Quadrant D Data is divided into 100 sec bins |
 |
 |
| Parameter | Plot |
|---|---|
| CZT HV Monitor | 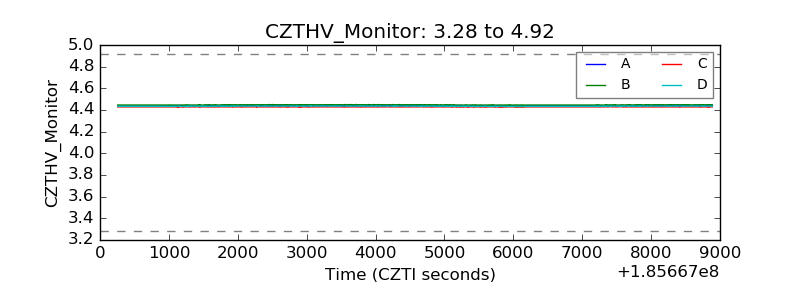 |
| D_VDD | 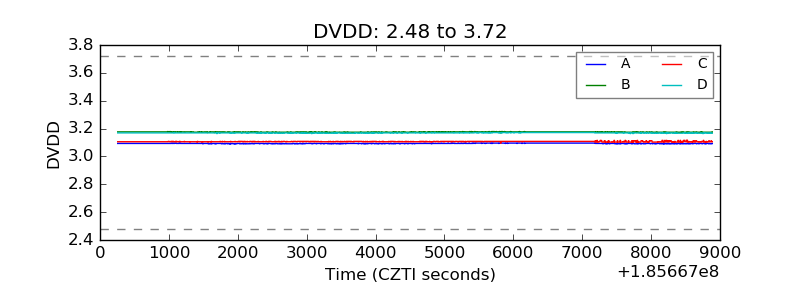 |
| Temperature 1 | 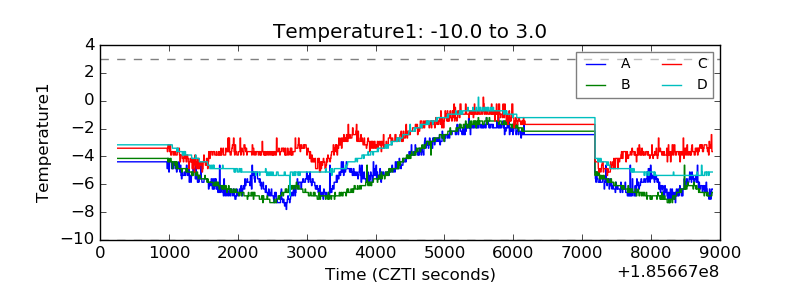 |
| Veto HV Monitor | 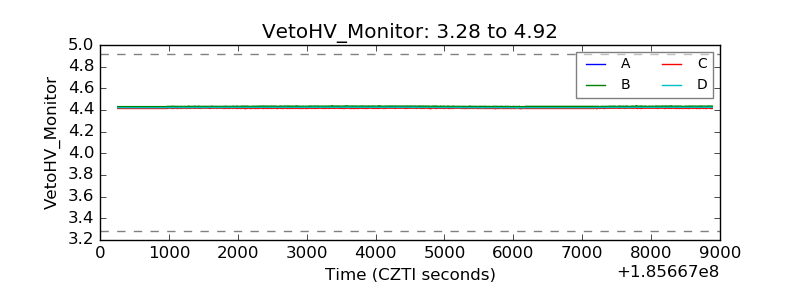 |
| Veto LLD | 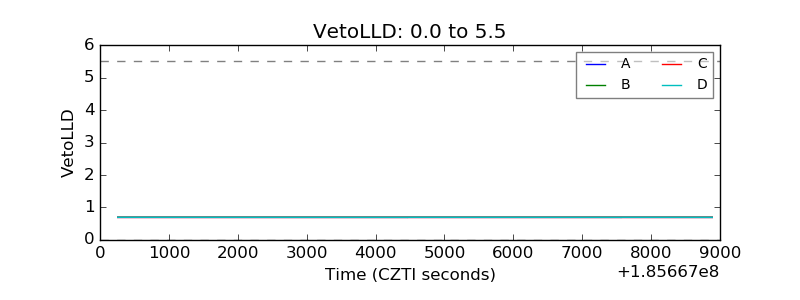 |
| Alpha Counter | 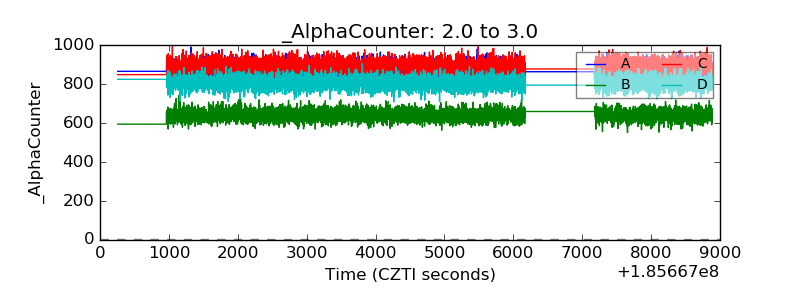 |
| _CPM_Rate | 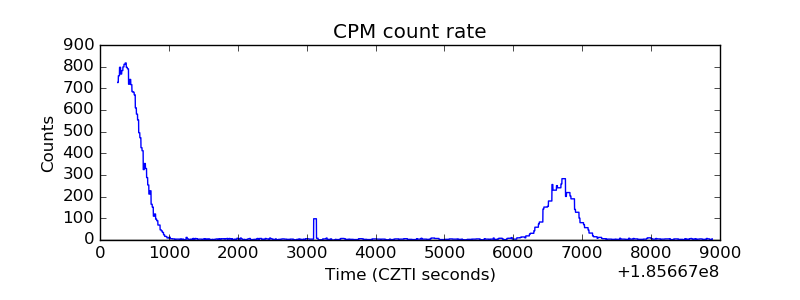 |
| CZT Counter | 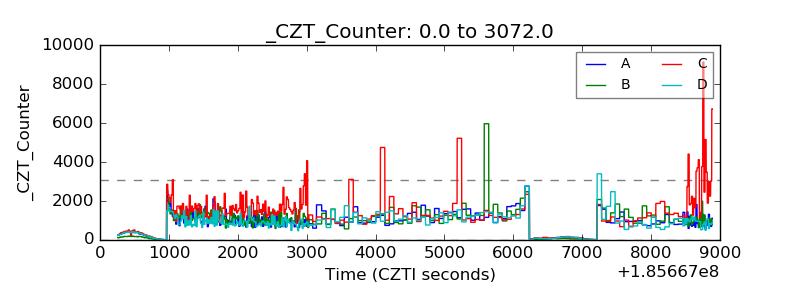 |
| +2.5 Volts monitor |  |
| +5 Volts monitor |  |
| _ROLL_ROT | 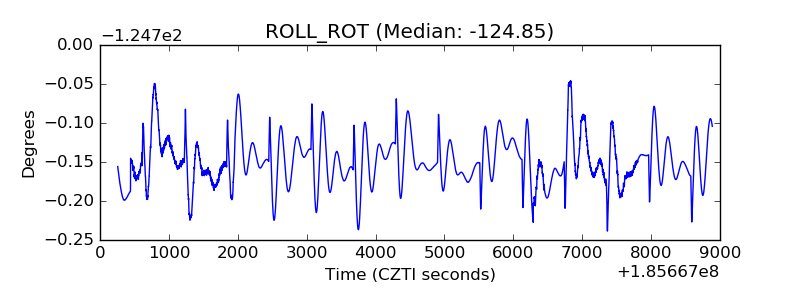 |
| _Roll_DEC | 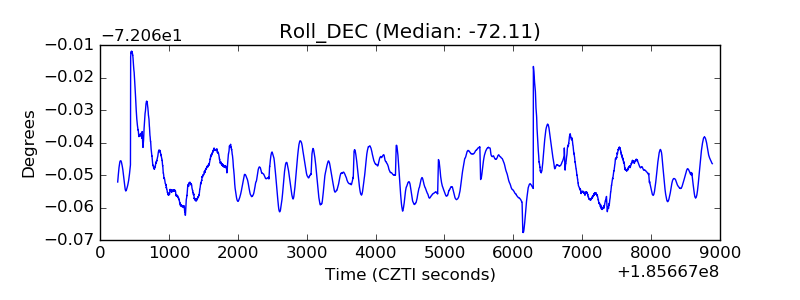 |
| _Roll_RA | 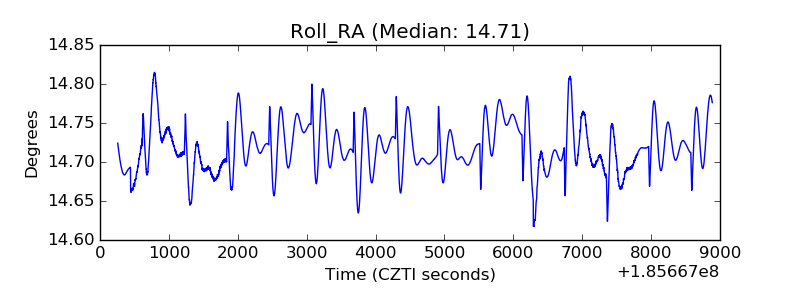 |
| Veto Counter | 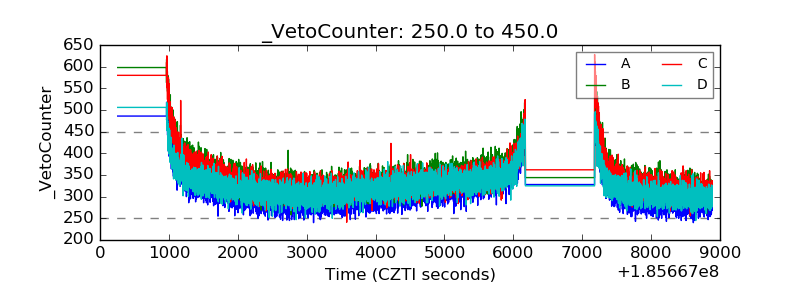 |