| Param | Original file | Final file |
|---|---|---|
| Filename | modeM0/AS1P01_010T01_9000000108_00785cztM0_level2.evt | modeM0/AS1P01_010T01_9000000108_00785cztM0_level2_quad_clean.evt |
| Size (bytes) | 1,216,319,040 | 109,454,400 |
| Size | 1.1 GB | 104.4 MB |
| Events in quadrant A | 9,018,125 | 709,620 |
| Events in quadrant B | 9,459,439 | 715,971 |
| Events in quadrant C | 9,293,097 | 692,339 |
| Events in quadrant D | 8,575,062 | 681,054 |
| Mode SS | |||
|---|---|---|---|
| Quadrant | BADHDUFLAG | Total packets | Discarded packets |
| A | 0 | 150 | 0 |
| B | 0 | 150 | 0 |
| C | 0 | 150 | 0 |
| D | 0 | 150 | 0 |
| Mode M0 | |||
|---|---|---|---|
| Quadrant | BADHDUFLAG | Total packets | Discarded packets |
| A | 0 | 32088 | 0 |
| B | 0 | 33377 | 0 |
| C | 0 | 32887 | 0 |
| D | 0 | 30736 | 0 |
| Quadrant | Total seconds | Saturated seconds | Saturation percentage |
|---|---|---|---|
| A | 7405 | 83 | 1.120864% |
| B | 7405 | 139 | 1.877110% |
| C | 7405 | 124 | 1.674544% |
| D | 7406 | 49 | 0.661626% |
Noise dominated data is calculated using 1-second bins in cleaned event files. If a bin has >2000 counts, and if more than 50% of those come from <1% of pixels, then it is considered to be noise-dominated and hence unusable.
| Quadrant | # 1 sec bins | Bins with >0 counts | Bins with >2000 counts | High rate bins dominated by noise | Noise dominated (total time) | Noise dominated (detector-on time) | Marked lightcurve |
|---|---|---|---|---|---|---|---|
| A | 7435 | 7406 | 446 | 446 | 6.00% | 6.02% |  |
| B | 7435 | 7406 | 531 | 531 | 7.14% | 7.17% |  |
| C | 7435 | 7406 | 543 | 543 | 7.30% | 7.33% | 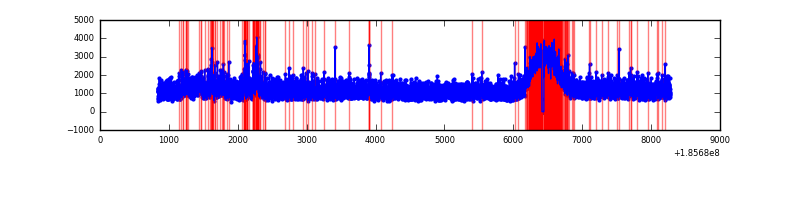 |
| D | 7436 | 7407 | 405 | 405 | 5.45% | 5.47% |  |
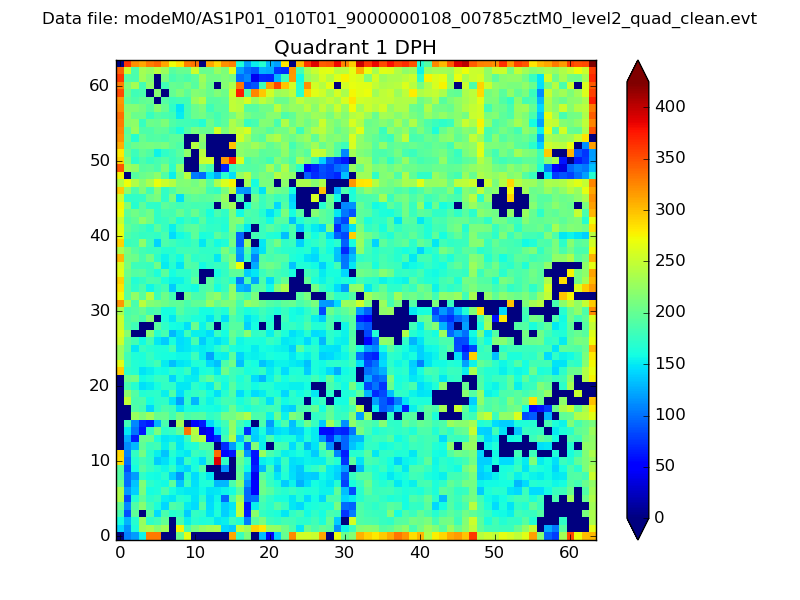
Top three noisy pixels from each quadrant. If the there are fewer than three noisy pixels in the level2.evt file, extra rows are filled as -1
| Pixel properties | Quadrant properties | ||||||
|---|---|---|---|---|---|---|---|
| Quadrant | DetID | PixID | Counts | Sigma | Mean | Median | Sigma |
| A | 15 | 171 | 33478 | 55.11 | 2329 | 2347 | 564.9 |
| A | 12 | 243 | 28611 | 46.49 | 2329 | 2347 | 564.9 |
| A | 0 | 117 | 10923 | 15.18 | 2329 | 2347 | 564.9 |
| B | 5 | 191 | 70043 | 117.76 | 2437 | 2448 | 574.0 |
| B | 15 | 22 | 48646 | 80.48 | 2437 | 2448 | 574.0 |
| B | 0 | 23 | 33744 | 54.52 | 2437 | 2448 | 574.0 |
| C | 10 | 17 | 318813 | 497.25 | 2256 | 2336 | 636.5 |
| C | 9 | 83 | 61520 | 92.99 | 2256 | 2336 | 636.5 |
| C | 3 | 111 | 38505 | 56.83 | 2256 | 2336 | 636.5 |
| D | 1 | 4 | 292086 | 425.51 | 2170 | 2252 | 681.1 |
| D | 2 | 170 | 64781 | 91.8 | 2170 | 2252 | 681.1 |
| D | 12 | 188 | 28548 | 38.61 | 2170 | 2252 | 681.1 |
Histogram calculated using DETX and DETY for each event in the final _common_clean file
| Quadrant A | 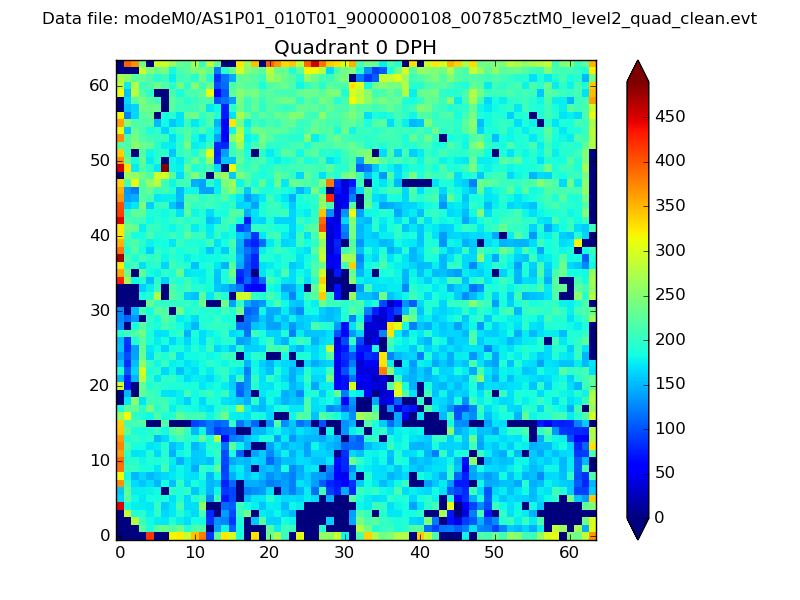 |
 |
Quadrant B |
|---|---|---|---|
| Quadrant D | 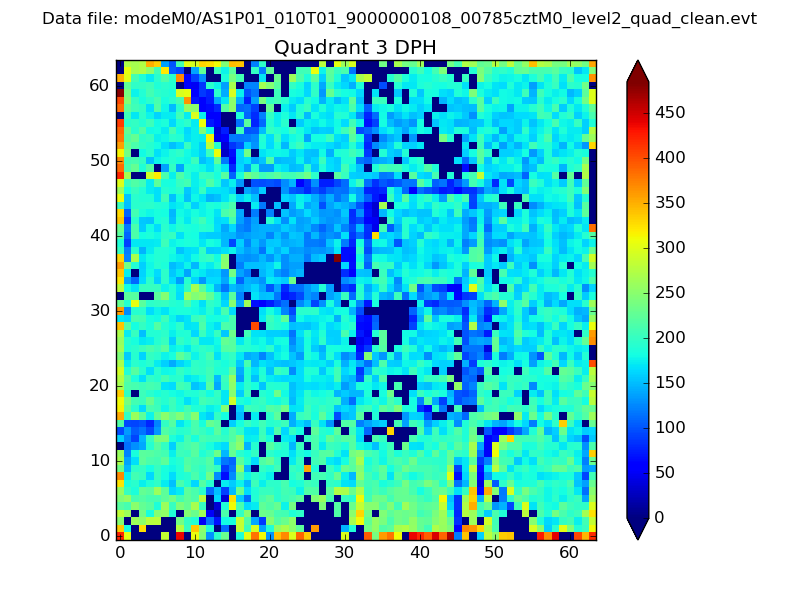 |
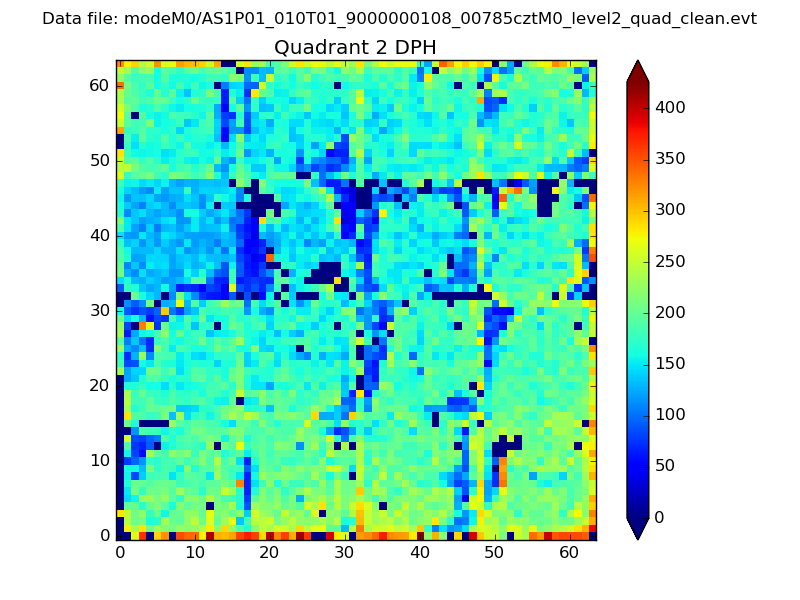 |
Quadrant C |
| Plot type | Count rate plots | Images |
|---|---|---|
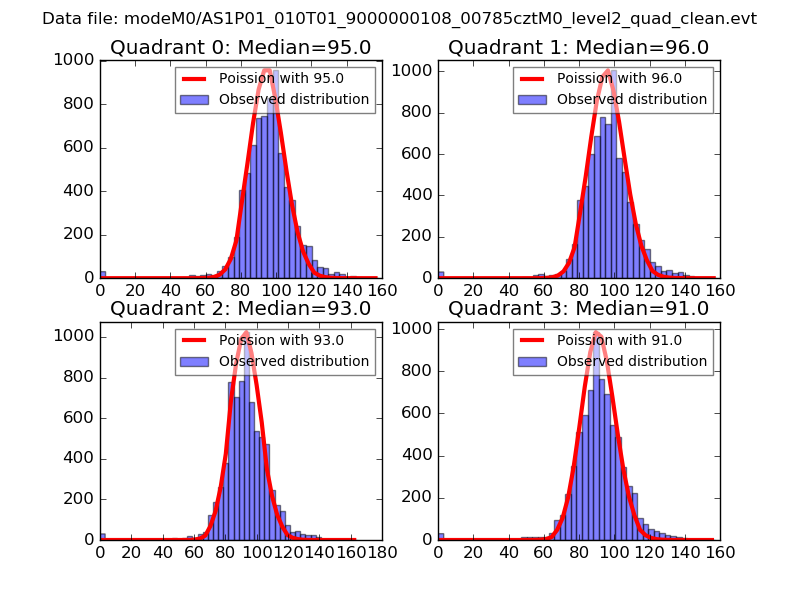
| Comparison with Poisson distribution Blue bars denote a histogram of data divided into 1 sec bins. Red curve is a Poisson curve with rate = median count rate of data. |
 |
 |
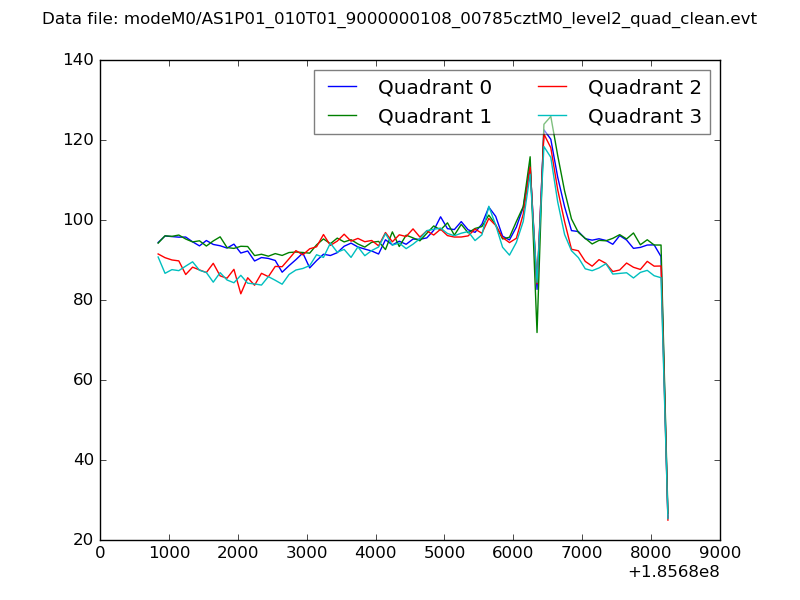
| Quadrant-wise count rates Data is divided into 100 sec bins |
 |
|
| Module-wise count rates for Quadrant A Data is divided into 100 sec bins |
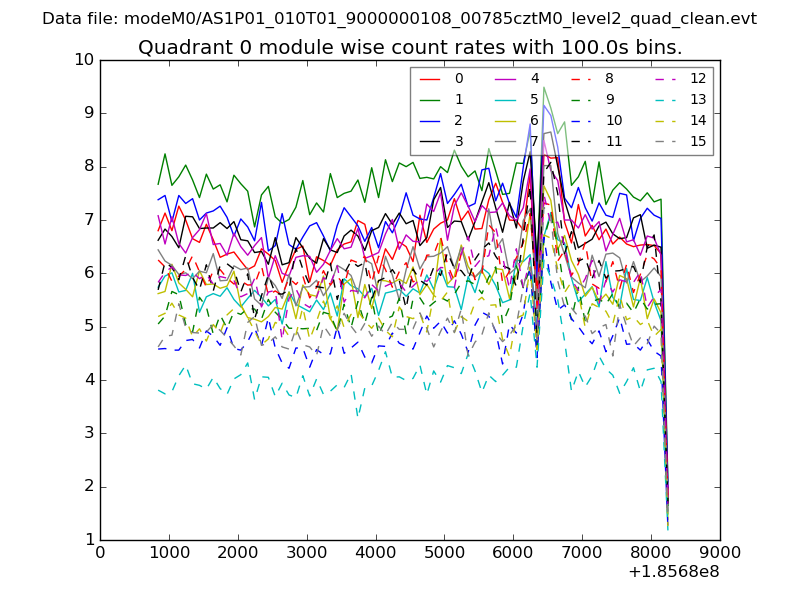 |
 |
| Module-wise count rates for Quadrant B Data is divided into 100 sec bins |
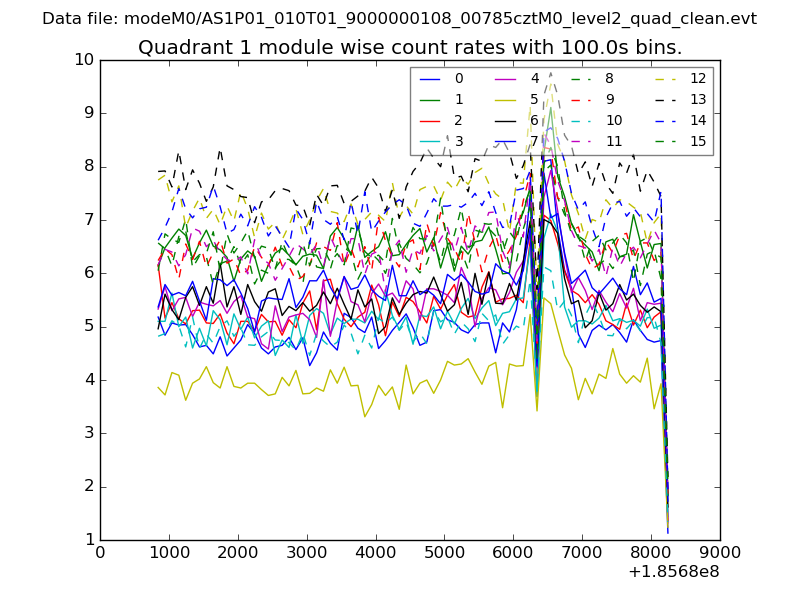 |
 |
| Module-wise count rates for Quadrant C Data is divided into 100 sec bins |
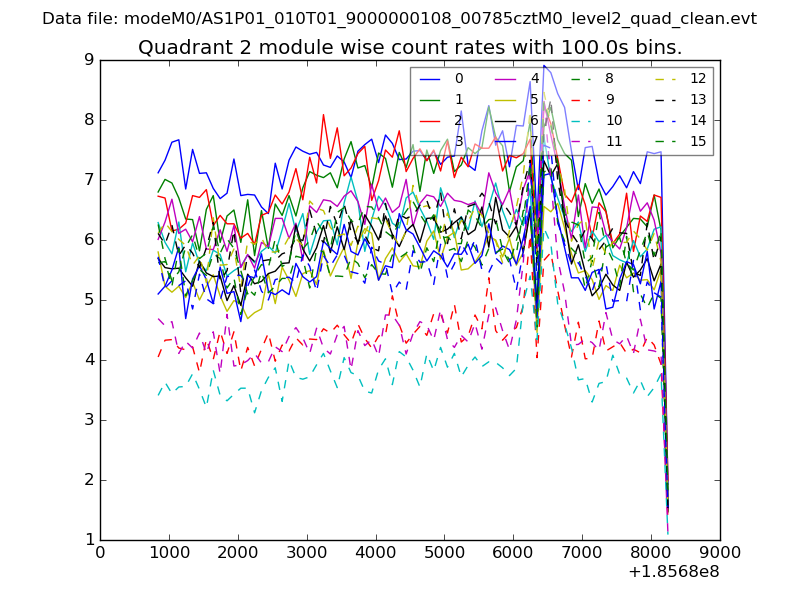 |
 |
| Module-wise count rates for Quadrant D Data is divided into 100 sec bins |
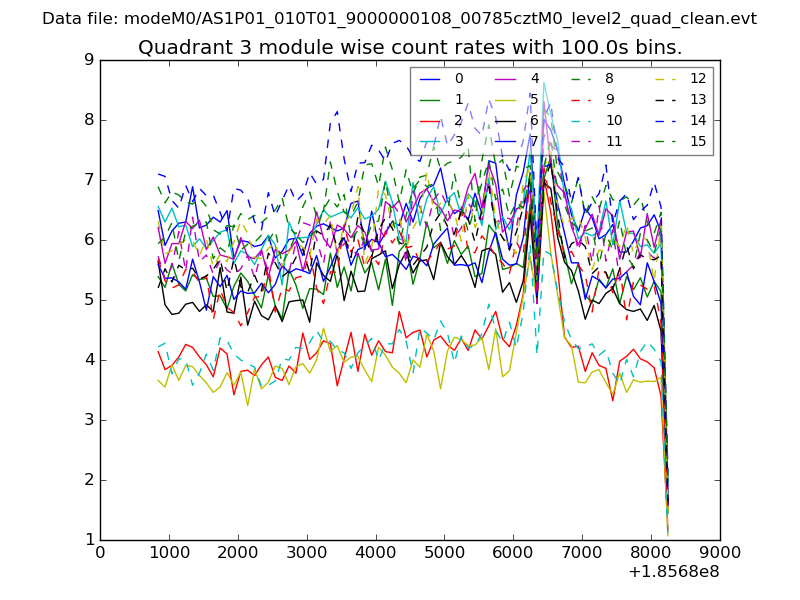 |
 |
| Parameter | Plot |
|---|---|
| CZT HV Monitor | 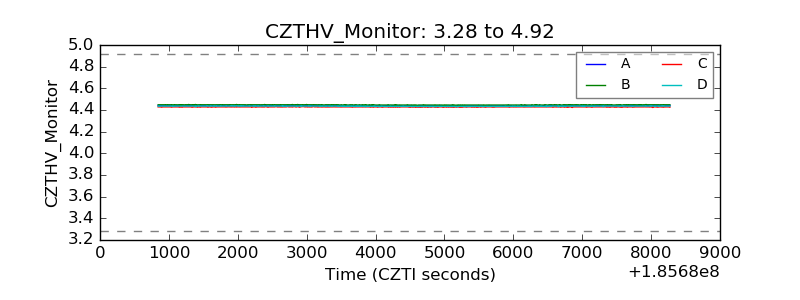 |
| D_VDD | 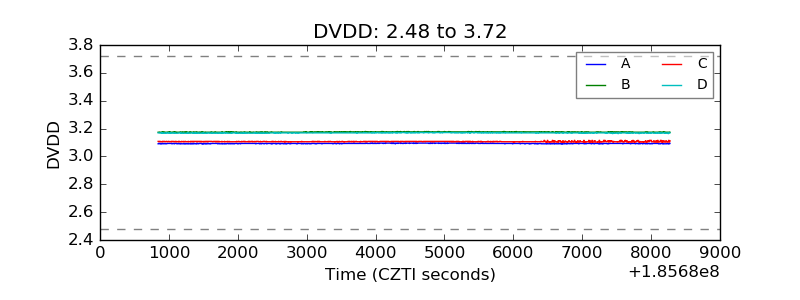 |
| Temperature 1 | 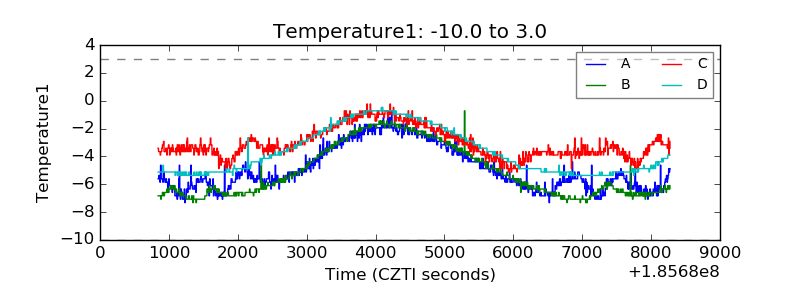 |
| Veto HV Monitor | 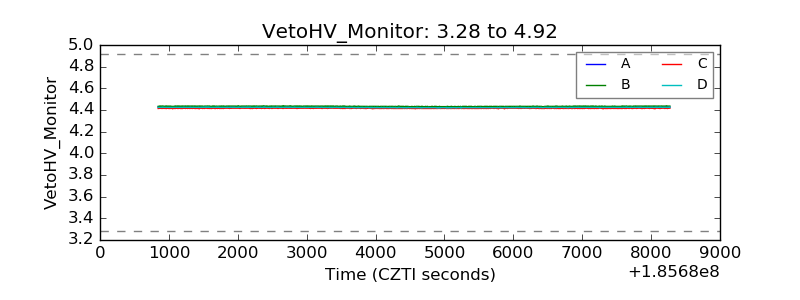 |
| Veto LLD | 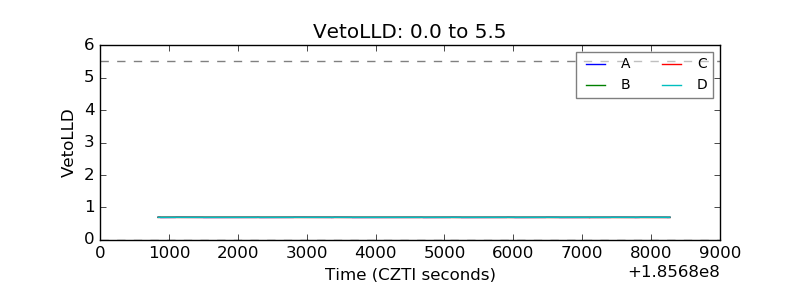 |
| Alpha Counter | 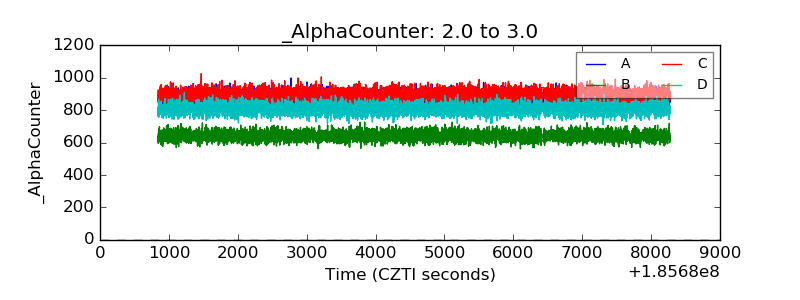 |
| _CPM_Rate | 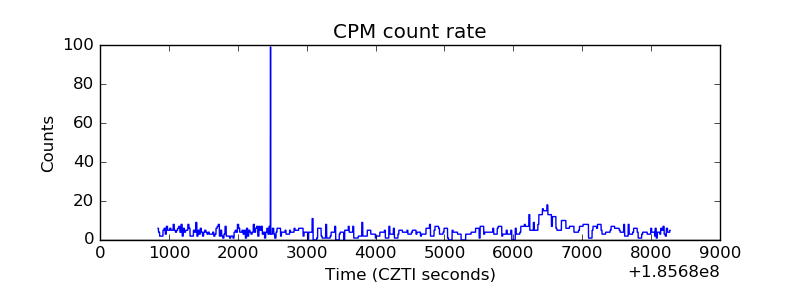 |
| CZT Counter | 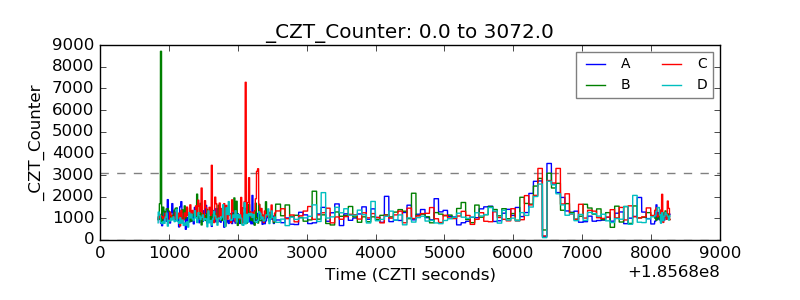 |
| +2.5 Volts monitor |  |
| +5 Volts monitor |  |
| _ROLL_ROT | 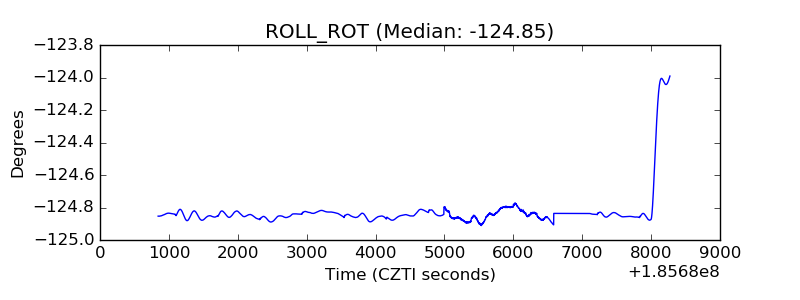 |
| _Roll_DEC | 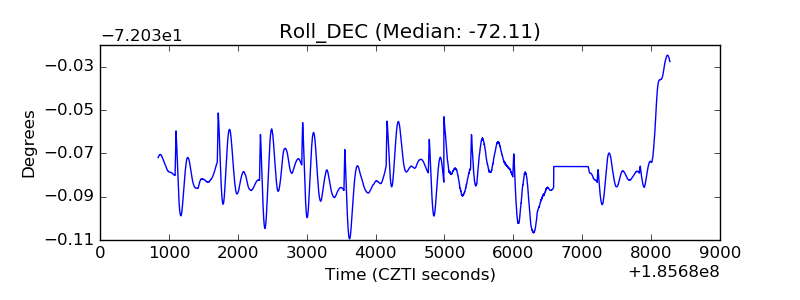 |
| _Roll_RA | 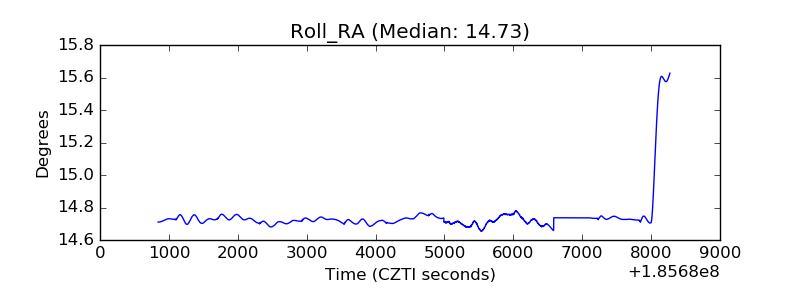 |
| Veto Counter | 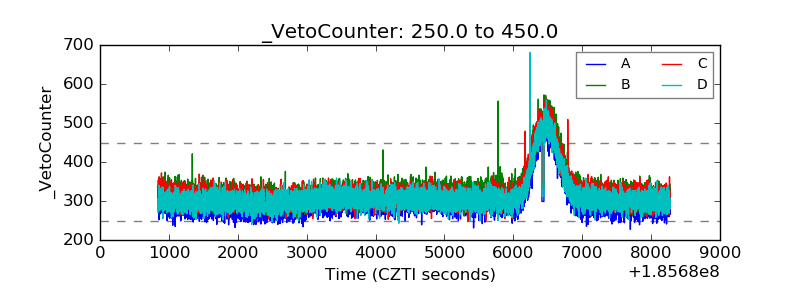 |