| Param | Original file | Final file |
|---|---|---|
| Filename | modeM0/AS1P01_010T01_9000000108_00786cztM0_level2.evt | modeM0/AS1P01_010T01_9000000108_00786cztM0_level2_quad_clean.evt |
| Size (bytes) | 638,161,920 | 60,940,800 |
| Size | 608.6 MB | 58.1 MB |
| Events in quadrant A | 4,822,726 | 387,928 |
| Events in quadrant B | 4,981,328 | 394,014 |
| Events in quadrant C | 4,688,040 | 387,586 |
| Events in quadrant D | 4,553,237 | 378,766 |
| Mode SS | |||
|---|---|---|---|
| Quadrant | BADHDUFLAG | Total packets | Discarded packets |
| A | 0 | 84 | 0 |
| B | 0 | 84 | 0 |
| C | 0 | 84 | 0 |
| D | 0 | 84 | 0 |
| Mode M0 | |||
|---|---|---|---|
| Quadrant | BADHDUFLAG | Total packets | Discarded packets |
| A | 0 | 17327 | 0 |
| B | 0 | 17796 | 0 |
| C | 0 | 16928 | 0 |
| D | 0 | 16524 | 0 |
| Quadrant | Total seconds | Saturated seconds | Saturation percentage |
|---|---|---|---|
| A | 4215 | 1 | 0.023725% |
| B | 4215 | 2 | 0.047450% |
| C | 4215 | 1 | 0.023725% |
| D | 4215 | 2 | 0.047450% |
Noise dominated data is calculated using 1-second bins in cleaned event files. If a bin has >2000 counts, and if more than 50% of those come from <1% of pixels, then it is considered to be noise-dominated and hence unusable.
| Quadrant | # 1 sec bins | Bins with >0 counts | Bins with >2000 counts | High rate bins dominated by noise | Noise dominated (total time) | Noise dominated (detector-on time) | Marked lightcurve |
|---|---|---|---|---|---|---|---|
| A | 4215 | 4215 | 34 | 34 | 0.81% | 0.81% |  |
| B | 4215 | 4215 | 50 | 50 | 1.19% | 1.19% |  |
| C | 4215 | 4215 | 37 | 37 | 0.88% | 0.88% | 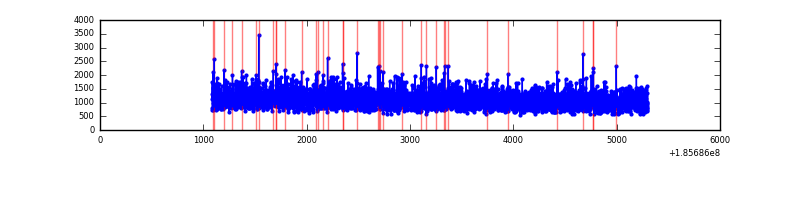 |
| D | 4215 | 4215 | 33 | 33 | 0.78% | 0.78% | 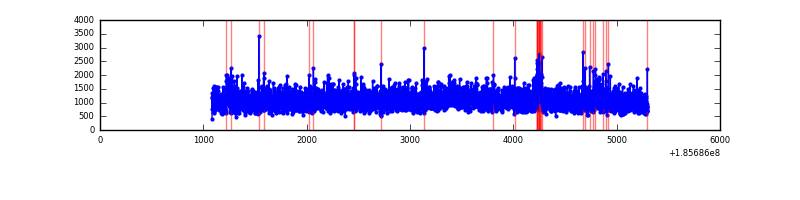 |
Top three noisy pixels from each quadrant. If the there are fewer than three noisy pixels in the level2.evt file, extra rows are filled as -1
| Pixel properties | Quadrant properties | ||||||
|---|---|---|---|---|---|---|---|
| Quadrant | DetID | PixID | Counts | Sigma | Mean | Median | Sigma |
| A | 12 | 243 | 19603 | 60.86 | 1245 | 1255 | 301.5 |
| A | 12 | 236 | 11610 | 34.35 | 1245 | 1255 | 301.5 |
| A | 15 | 233 | 9471 | 27.25 | 1245 | 1255 | 301.5 |
| B | 0 | 23 | 43162 | 137.05 | 1280 | 1285 | 305.6 |
| B | 15 | 22 | 32174 | 101.09 | 1280 | 1285 | 305.6 |
| B | 0 | 220 | 20746 | 63.69 | 1280 | 1285 | 305.6 |
| C | 9 | 83 | 30138 | 88.91 | 1170 | 1213 | 325.3 |
| C | 3 | 111 | 28307 | 83.28 | 1170 | 1213 | 325.3 |
| C | 3 | 79 | 25986 | 76.15 | 1170 | 1213 | 325.3 |
| D | 1 | 4 | 84057 | 232.85 | 1153 | 1193 | 355.9 |
| D | 2 | 170 | 60260 | 165.98 | 1153 | 1193 | 355.9 |
| D | 13 | 25 | 23554 | 62.84 | 1153 | 1193 | 355.9 |
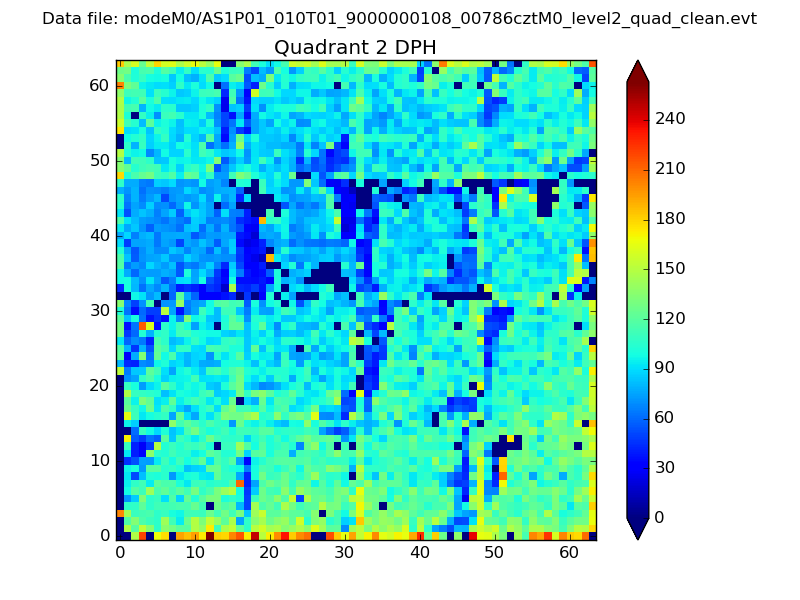
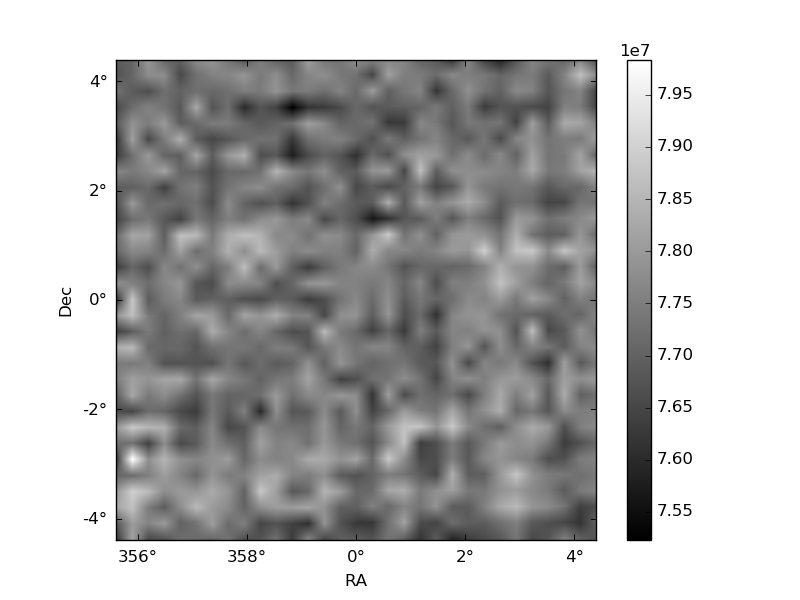
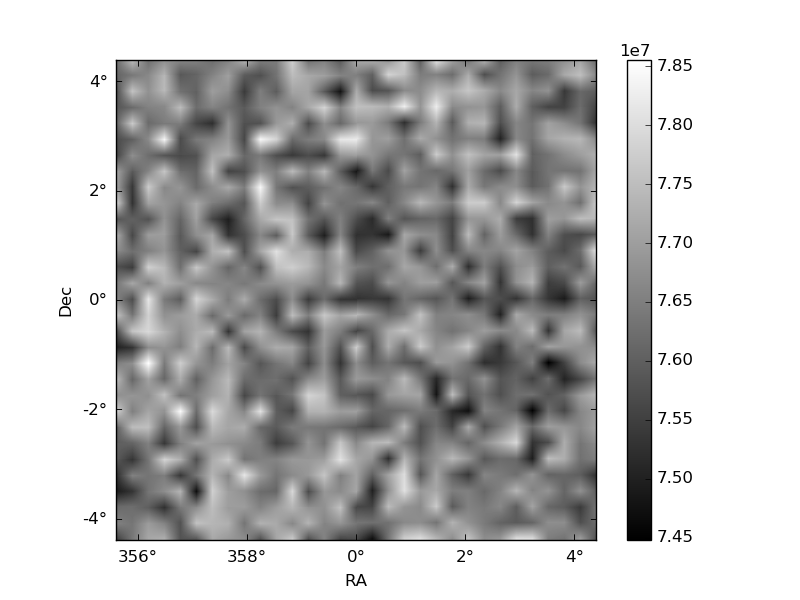
Histogram calculated using DETX and DETY for each event in the final _common_clean file
| Quadrant A | 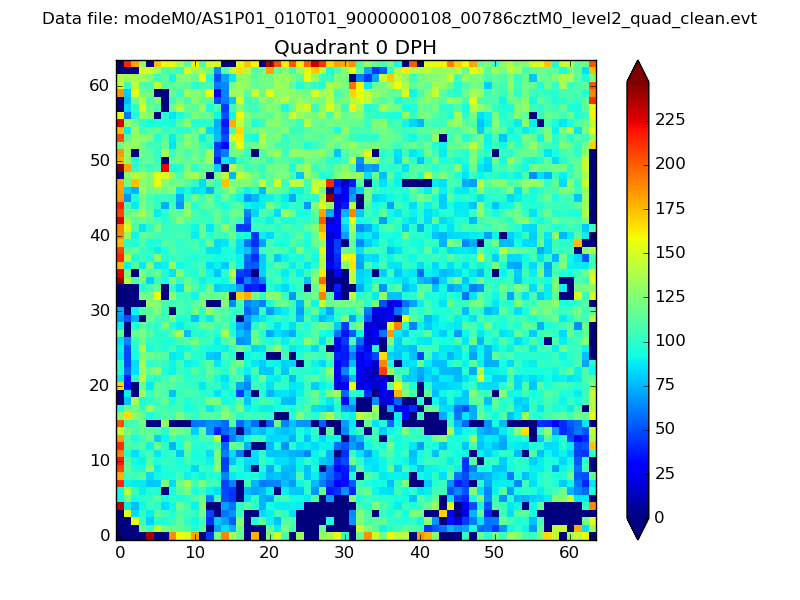 |
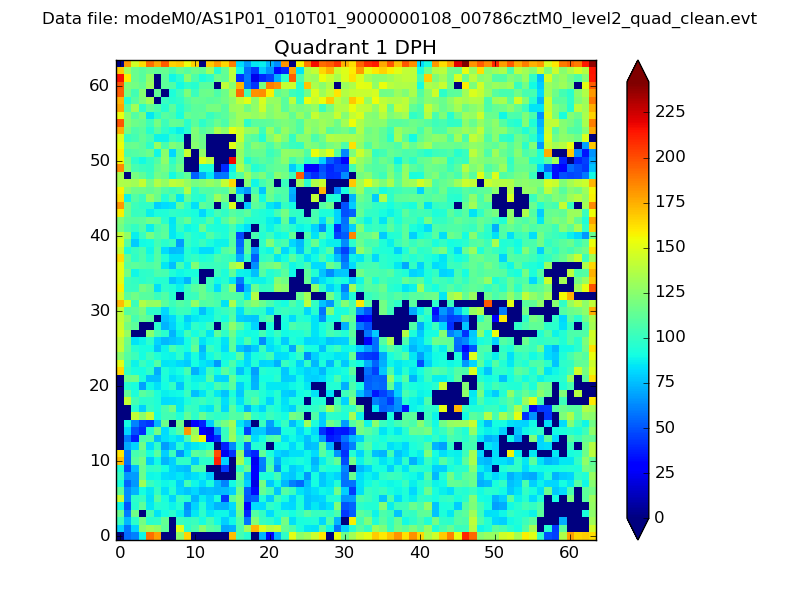 |
Quadrant B |
|---|---|---|---|
| Quadrant D | 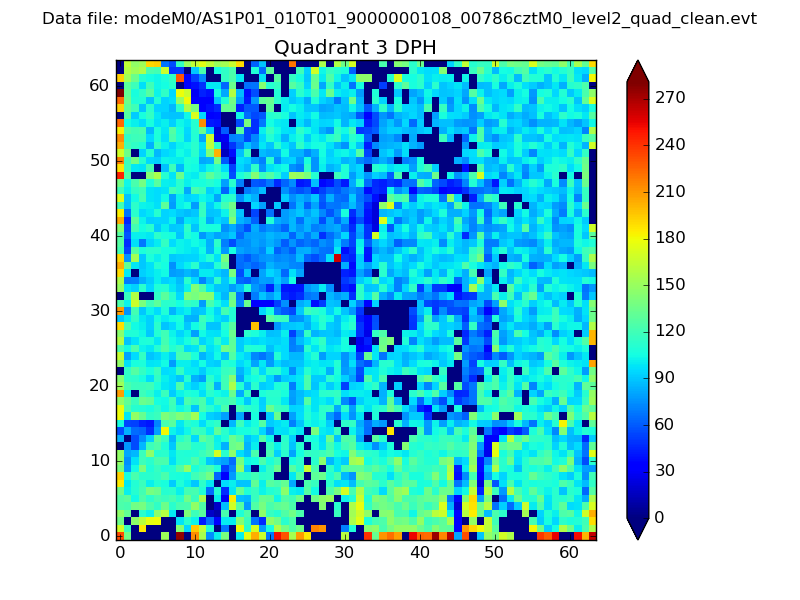 |
 |
Quadrant C |
| Plot type | Count rate plots | Images |
|---|---|---|
| Comparison with Poisson distribution Blue bars denote a histogram of data divided into 1 sec bins. Red curve is a Poisson curve with rate = median count rate of data. |
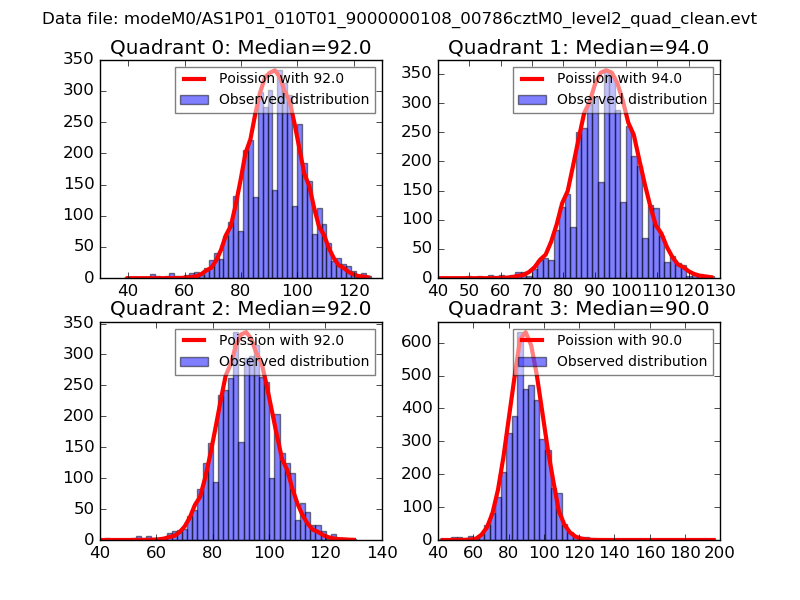 |
 |
| Quadrant-wise count rates Data is divided into 100 sec bins |
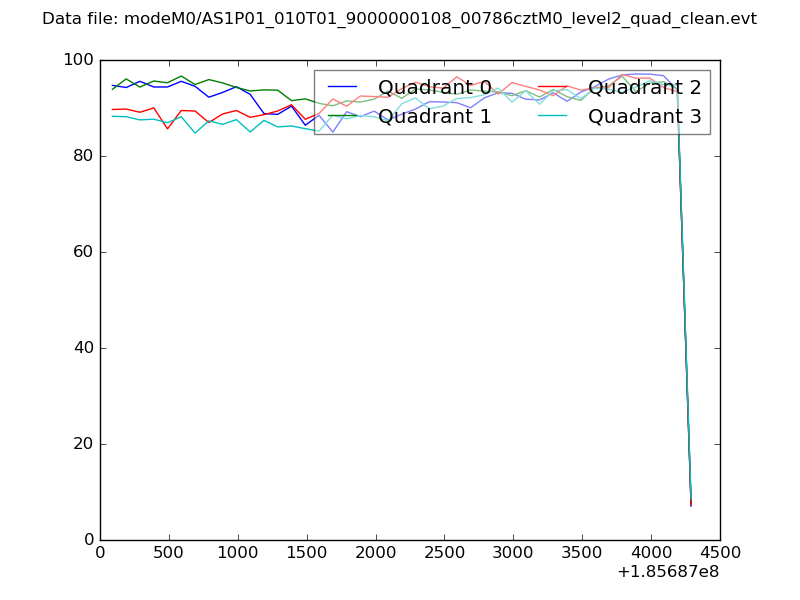 |
|
| Module-wise count rates for Quadrant A Data is divided into 100 sec bins |
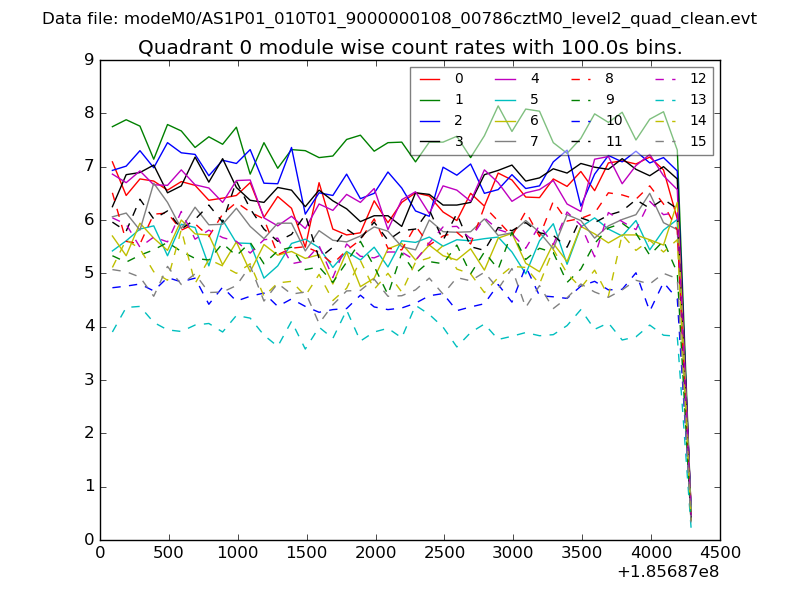 |
 |
| Module-wise count rates for Quadrant B Data is divided into 100 sec bins |
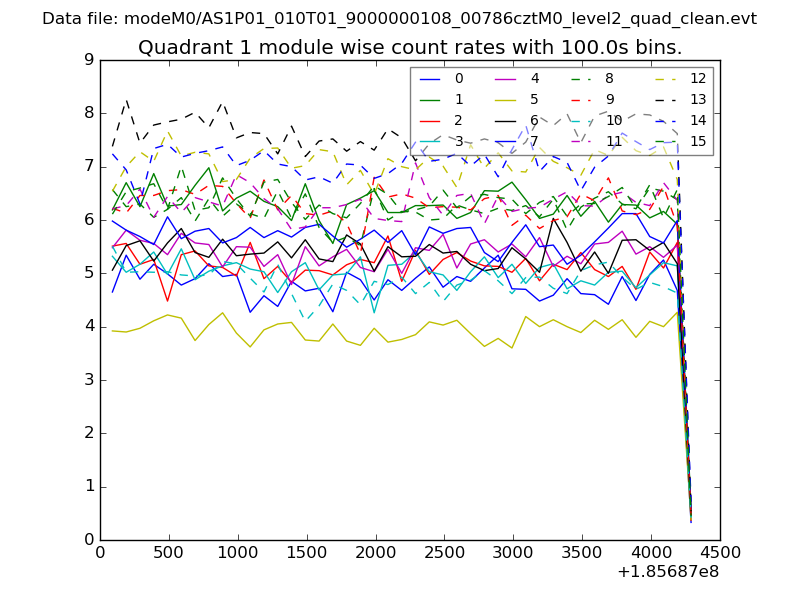 |
 |
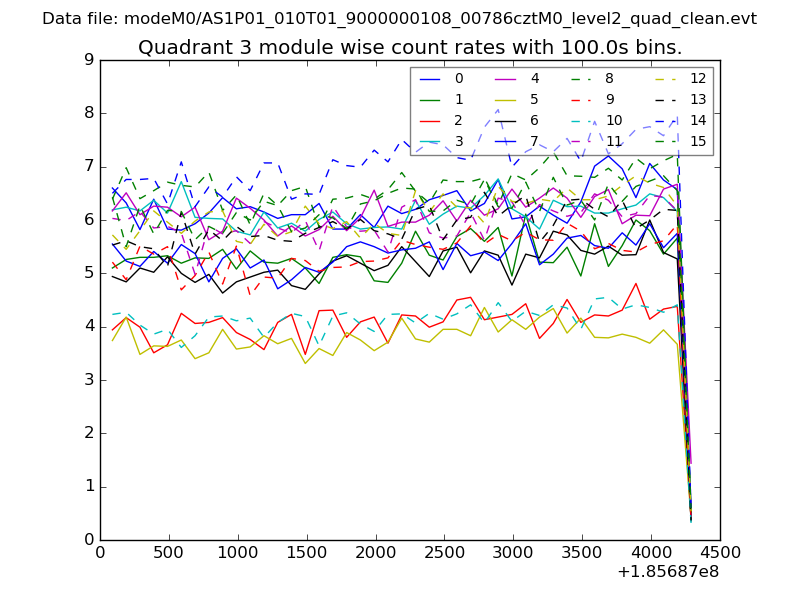
| Module-wise count rates for Quadrant C Data is divided into 100 sec bins |
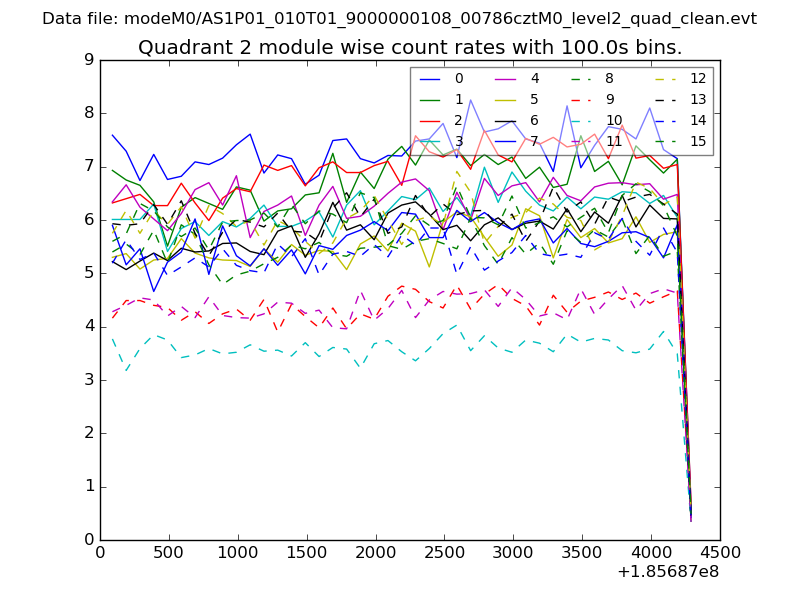 |
 |
| Module-wise count rates for Quadrant D Data is divided into 100 sec bins |
 |
 |
| Parameter | Plot |
|---|---|
| CZT HV Monitor | 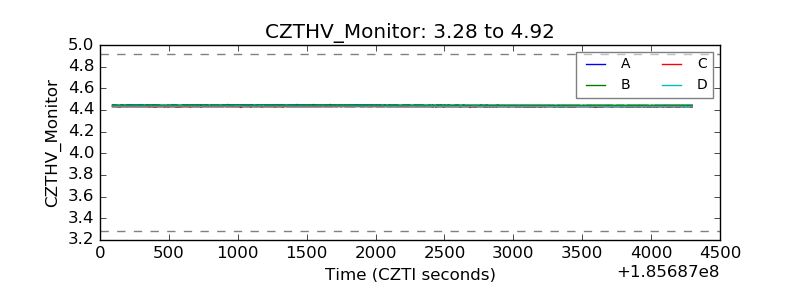 |
| D_VDD | 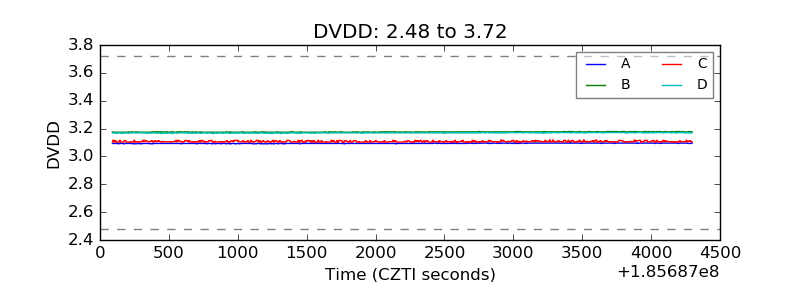 |
| Temperature 1 | 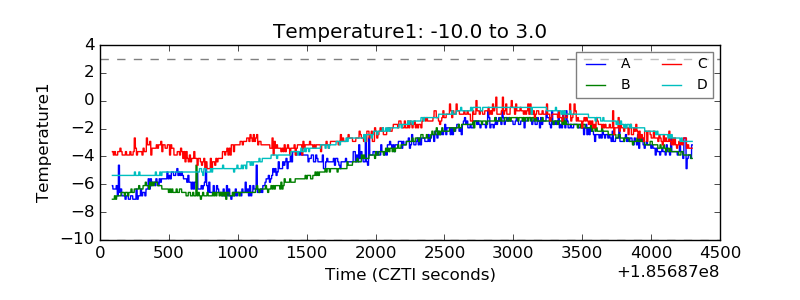 |
| Veto HV Monitor | 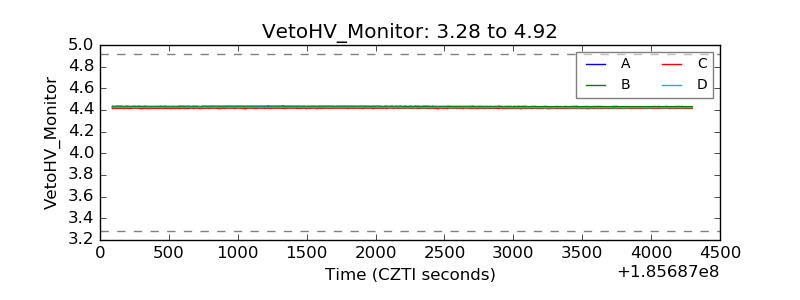 |
| Veto LLD | 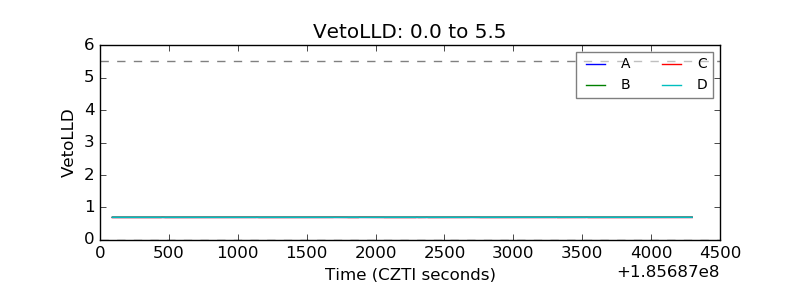 |
| Alpha Counter | 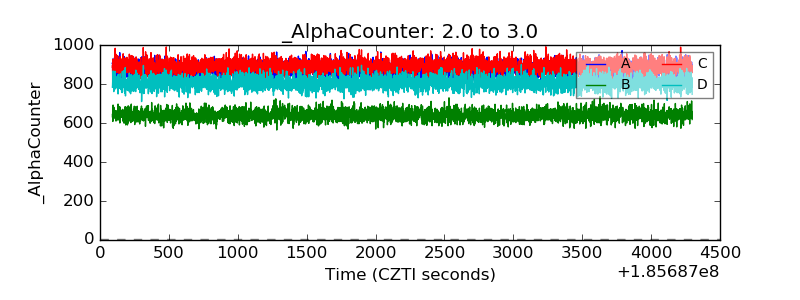 |
| _CPM_Rate | 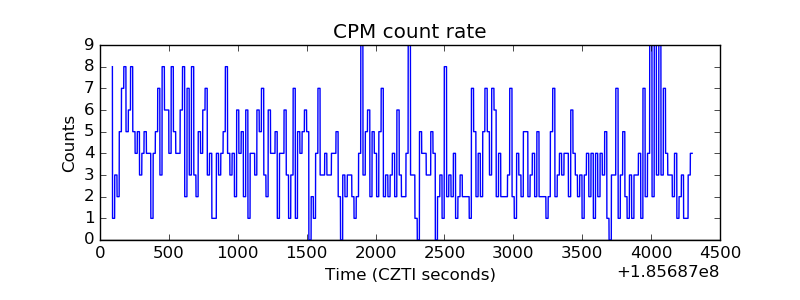 |
| CZT Counter | 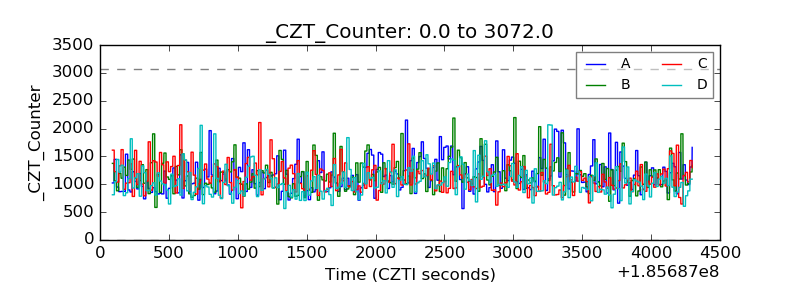 |
| +2.5 Volts monitor |  |
| +5 Volts monitor |  |
| _ROLL_ROT | 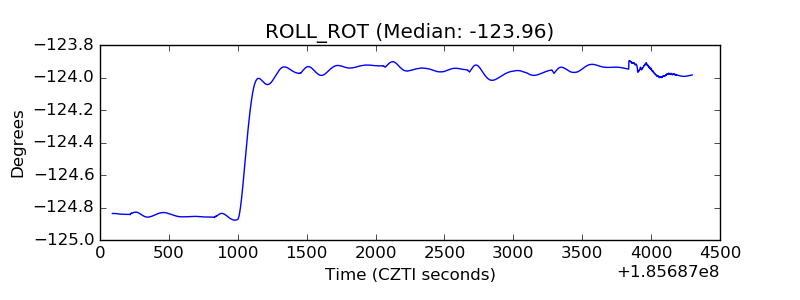 |
| _Roll_DEC | 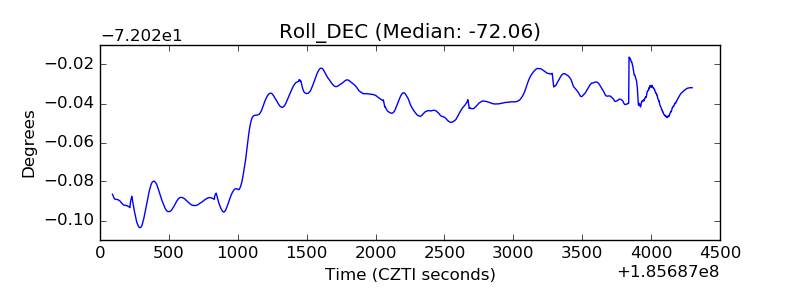 |
| _Roll_RA | 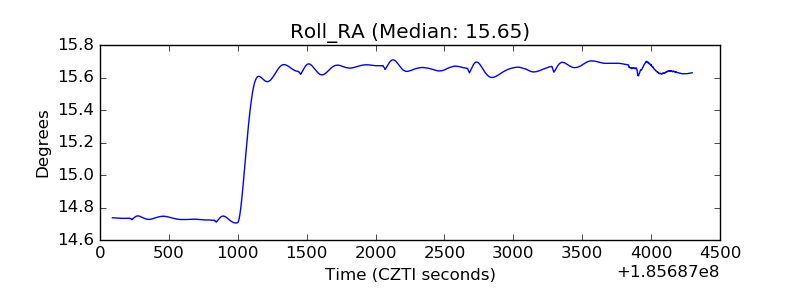 |
| Veto Counter | 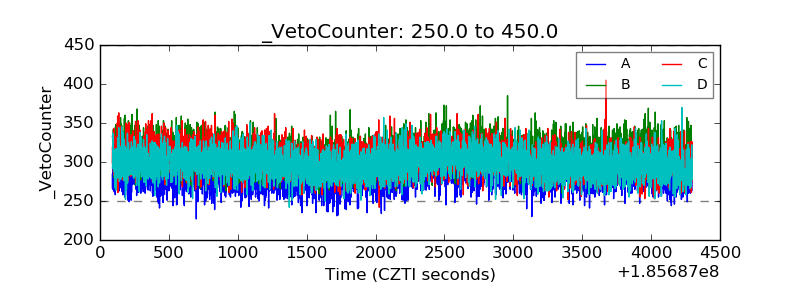 |