| Param | Original file | Final file |
|---|---|---|
| Filename | modeM0/AS1P01_010T01_9000000112_00790cztM0_level2.evt | modeM0/AS1P01_010T01_9000000112_00790cztM0_level2_quad_clean.evt |
| Size (bytes) | 1,911,781,440 | 175,743,360 |
| Size | 1.8 GB | 167.6 MB |
| Events in quadrant A | 14,248,569 | 1,135,659 |
| Events in quadrant B | 14,901,201 | 1,136,652 |
| Events in quadrant C | 13,640,554 | 1,128,859 |
| Events in quadrant D | 14,323,471 | 1,100,202 |
| Mode M9 | |||
|---|---|---|---|
| Quadrant | BADHDUFLAG | Total packets | Discarded packets |
| A | 0 | 15 | 0 |
| B | 0 | 15 | 0 |
| C | 0 | 15 | 0 |
| D | 0 | 15 | 0 |
| Mode M0 | |||
|---|---|---|---|
| Quadrant | BADHDUFLAG | Total packets | Discarded packets |
| A | 0 | 50803 | 0 |
| B | 0 | 52728 | 0 |
| C | 0 | 49013 | 0 |
| D | 0 | 51127 | 0 |
| Mode SS | |||
|---|---|---|---|
| Quadrant | BADHDUFLAG | Total packets | Discarded packets |
| A | 0 | 240 | 0 |
| B | 0 | 240 | 0 |
| C | 0 | 240 | 0 |
| D | 0 | 240 | 0 |
| Quadrant | Total seconds | Saturated seconds | Saturation percentage |
|---|---|---|---|
| A | 11881 | 123 | 1.035266% |
| B | 11881 | 134 | 1.127851% |
| C | 11880 | 87 | 0.732323% |
| D | 11880 | 331 | 2.786195% |
Noise dominated data is calculated using 1-second bins in cleaned event files. If a bin has >2000 counts, and if more than 50% of those come from <1% of pixels, then it is considered to be noise-dominated and hence unusable.
| Quadrant | # 1 sec bins | Bins with >0 counts | Bins with >2000 counts | High rate bins dominated by noise | Noise dominated (total time) | Noise dominated (detector-on time) | Marked lightcurve |
|---|---|---|---|---|---|---|---|
| A | 13346 | 11881 | 408 | 408 | 3.06% | 3.43% | 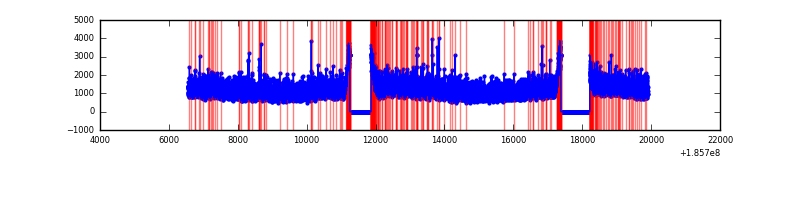 |
| B | 13346 | 11881 | 467 | 467 | 3.50% | 3.93% | 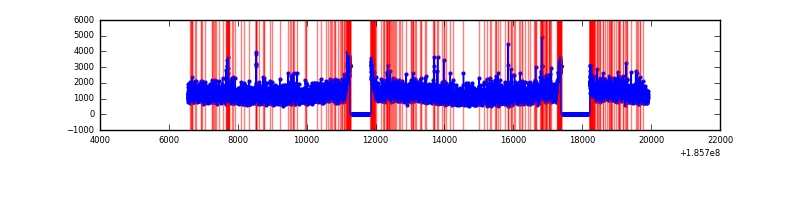 |
| C | 13345 | 11882 | 330 | 330 | 2.47% | 2.78% | 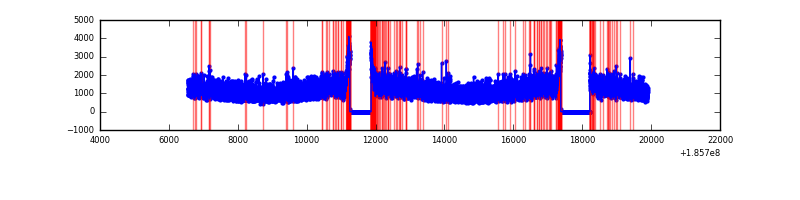 |
| D | 13345 | 11880 | 769 | 769 | 5.76% | 6.47% | 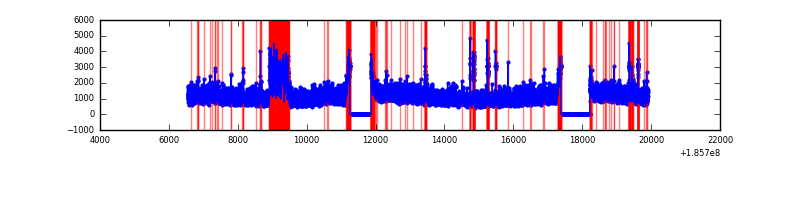 |
Top three noisy pixels from each quadrant. If the there are fewer than three noisy pixels in the level2.evt file, extra rows are filled as -1
| Pixel properties | Quadrant properties | ||||||
|---|---|---|---|---|---|---|---|
| Quadrant | DetID | PixID | Counts | Sigma | Mean | Median | Sigma |
| A | 15 | 233 | 65761 | 70.04 | 3669 | 3698 | 886.1 |
| A | 15 | 17 | 32663 | 32.69 | 3669 | 3698 | 886.1 |
| A | 12 | 243 | 25713 | 24.85 | 3669 | 3698 | 886.1 |
| B | 0 | 23 | 154178 | 167.51 | 3808 | 3827 | 897.5 |
| B | 15 | 22 | 97162 | 103.99 | 3808 | 3827 | 897.5 |
| B | 5 | 191 | 85385 | 90.87 | 3808 | 3827 | 897.5 |
| C | 15 | 241 | 86825 | 87.03 | 3426 | 3537 | 957.0 |
| C | 3 | 111 | 60983 | 60.03 | 3426 | 3537 | 957.0 |
| C | 3 | 79 | 51346 | 49.96 | 3426 | 3537 | 957.0 |
| D | 13 | 25 | 1196923 | 1154.05 | 3349 | 3471 | 1034.1 |
| D | 1 | 4 | 392979 | 376.65 | 3349 | 3471 | 1034.1 |
| D | 10 | 85 | 67611 | 62.02 | 3349 | 3471 | 1034.1 |
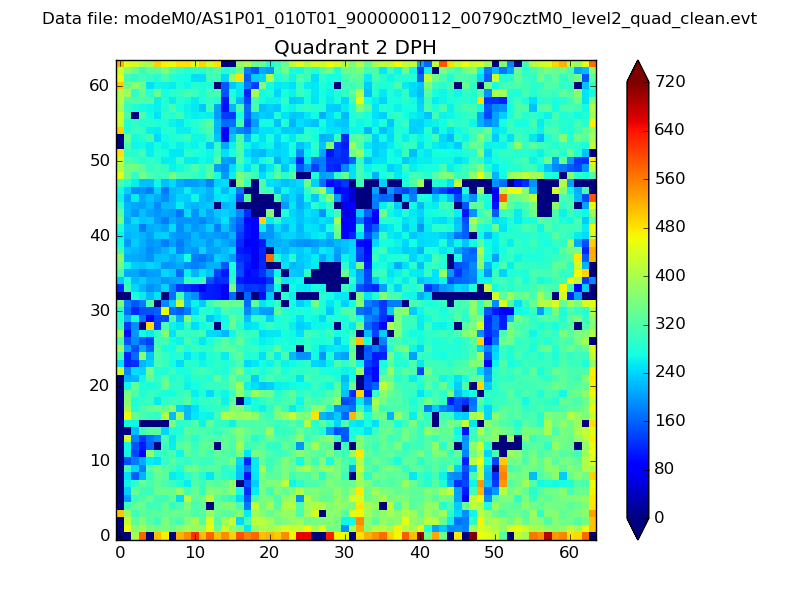
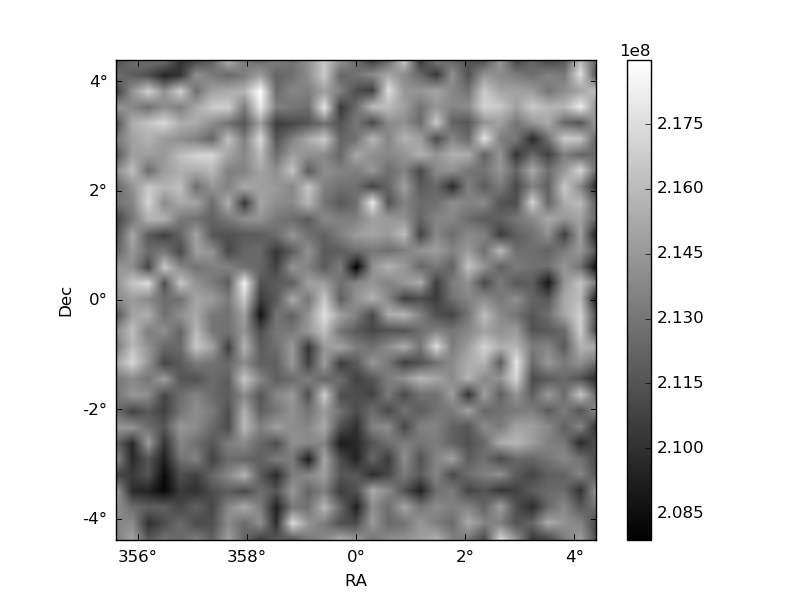
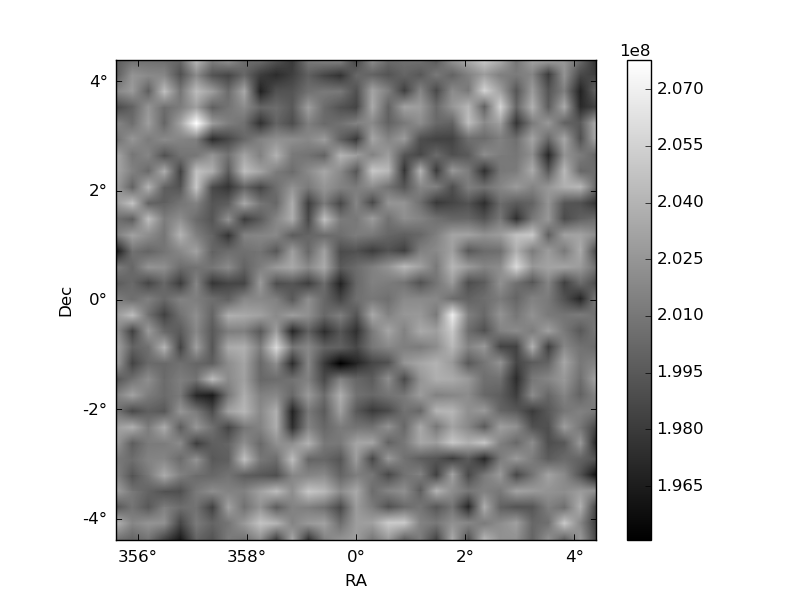
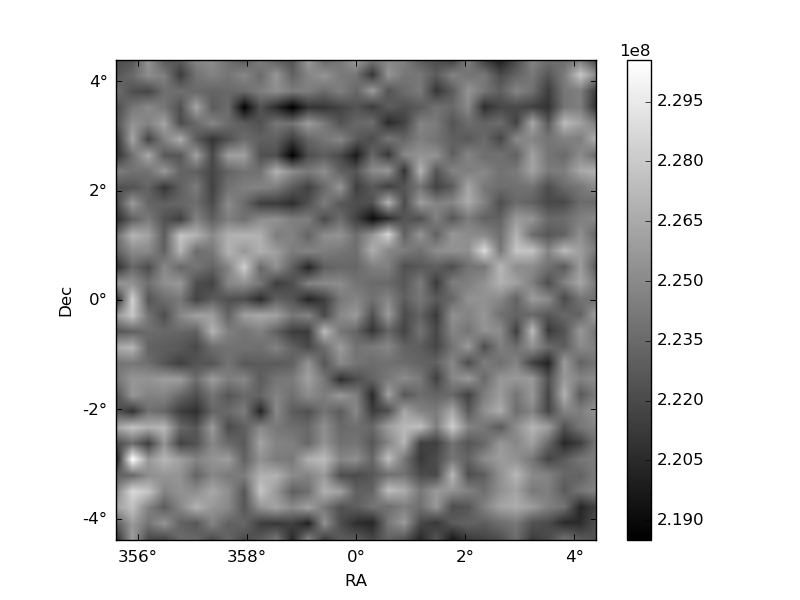
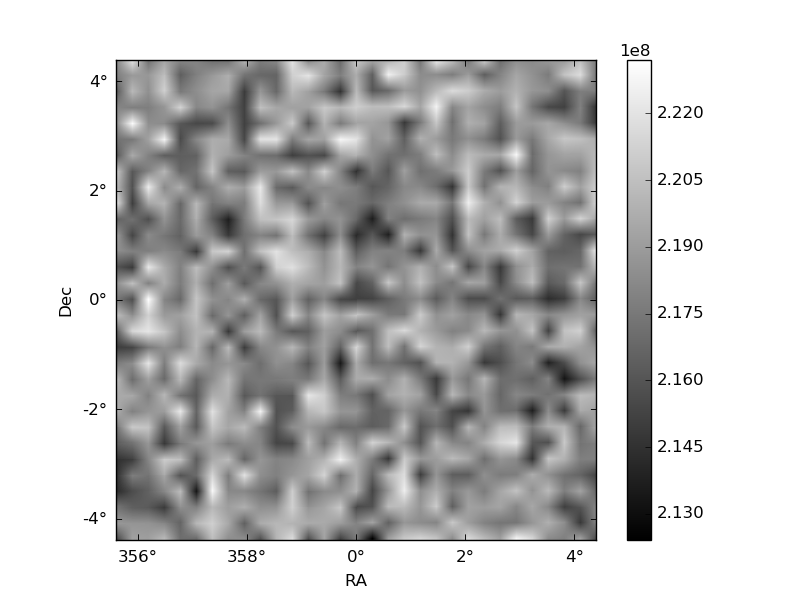
Histogram calculated using DETX and DETY for each event in the final _common_clean file
| Quadrant A |  |
 |
Quadrant B |
|---|---|---|---|
| Quadrant D | 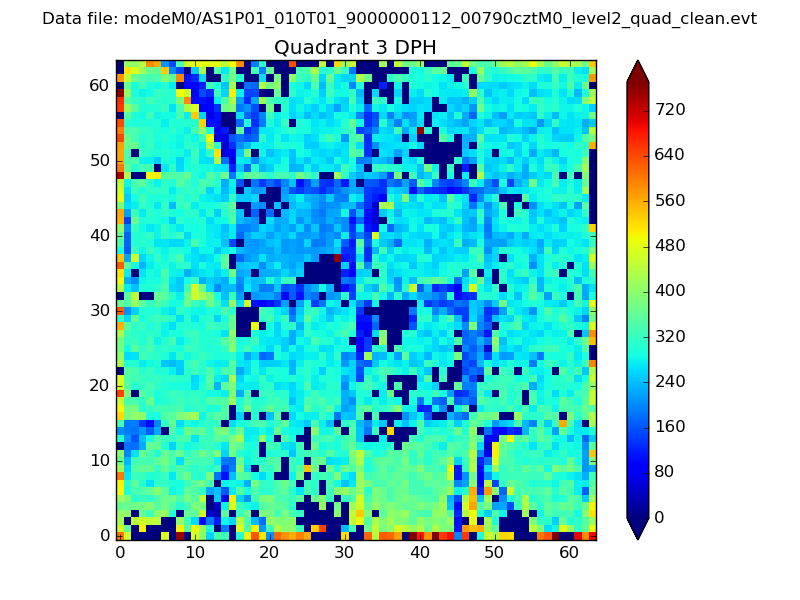 |
 |
Quadrant C |
| Plot type | Count rate plots | Images |
|---|---|---|
| Comparison with Poisson distribution Blue bars denote a histogram of data divided into 1 sec bins. Red curve is a Poisson curve with rate = median count rate of data. |
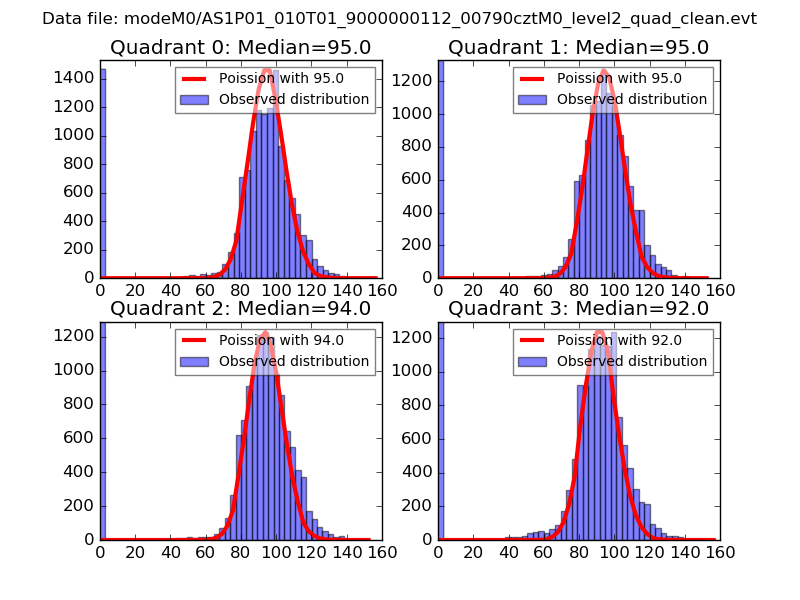 |
 |
| Quadrant-wise count rates Data is divided into 100 sec bins |
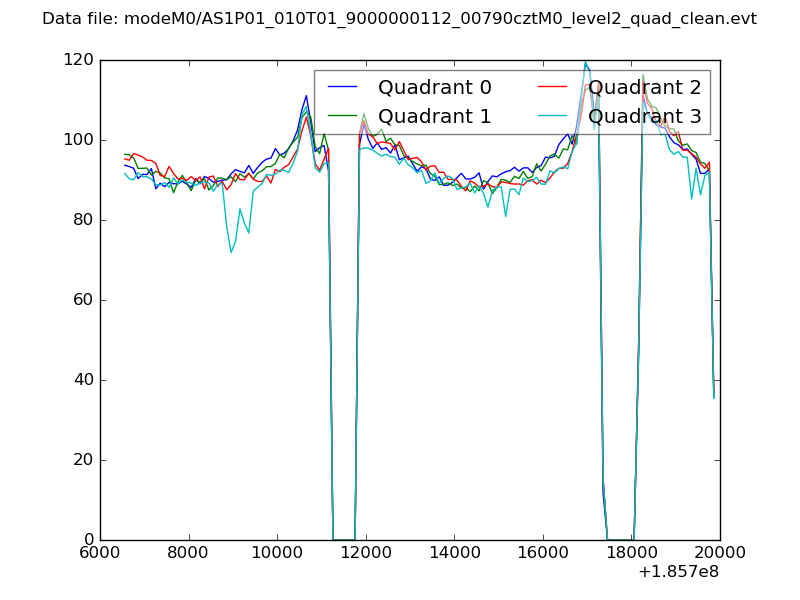 |
|
| Module-wise count rates for Quadrant A Data is divided into 100 sec bins |
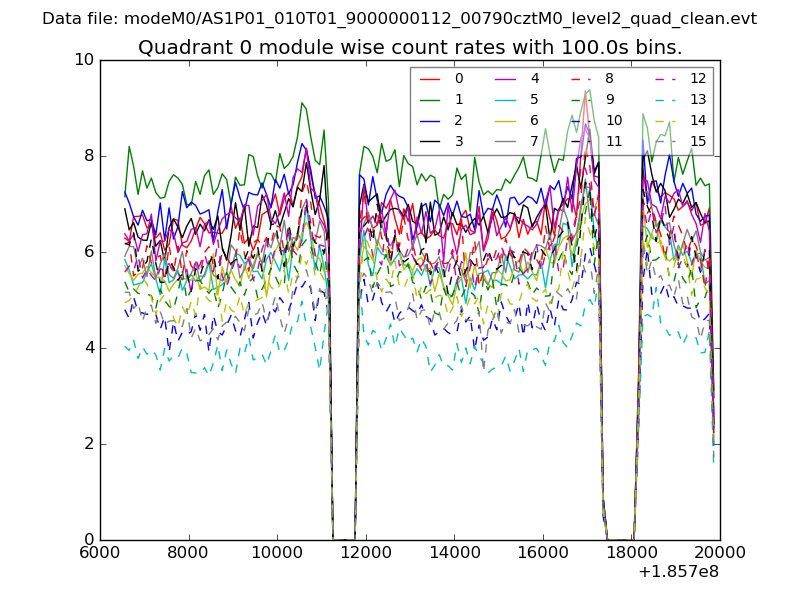 |
 |
| Module-wise count rates for Quadrant B Data is divided into 100 sec bins |
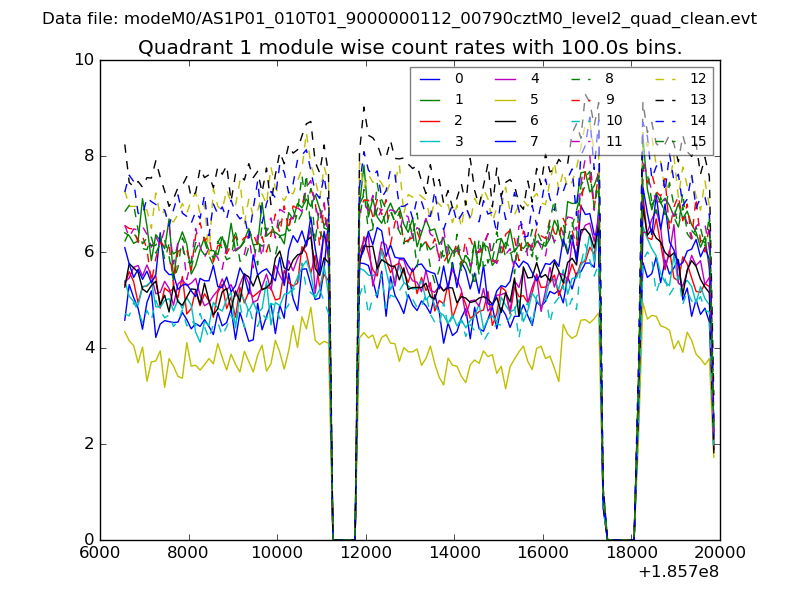 |
 |
| Module-wise count rates for Quadrant C Data is divided into 100 sec bins |
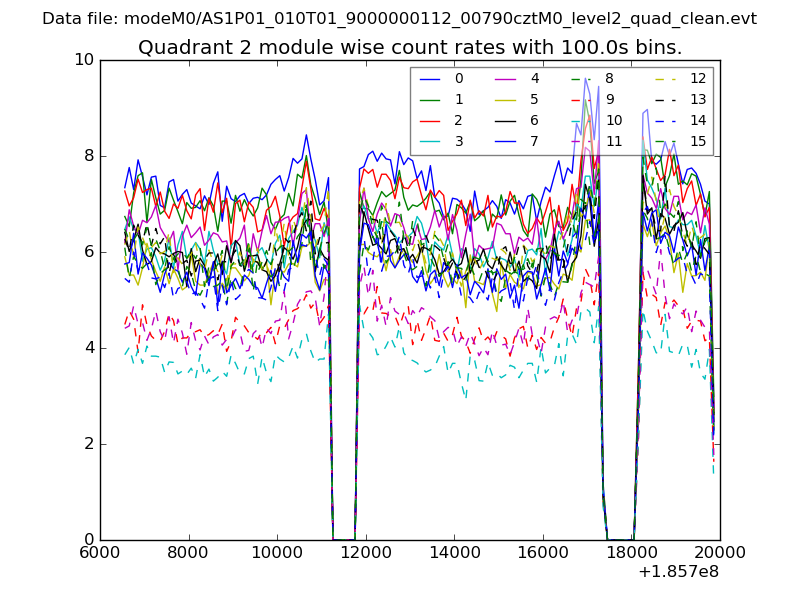 |
 |
| Module-wise count rates for Quadrant D Data is divided into 100 sec bins |
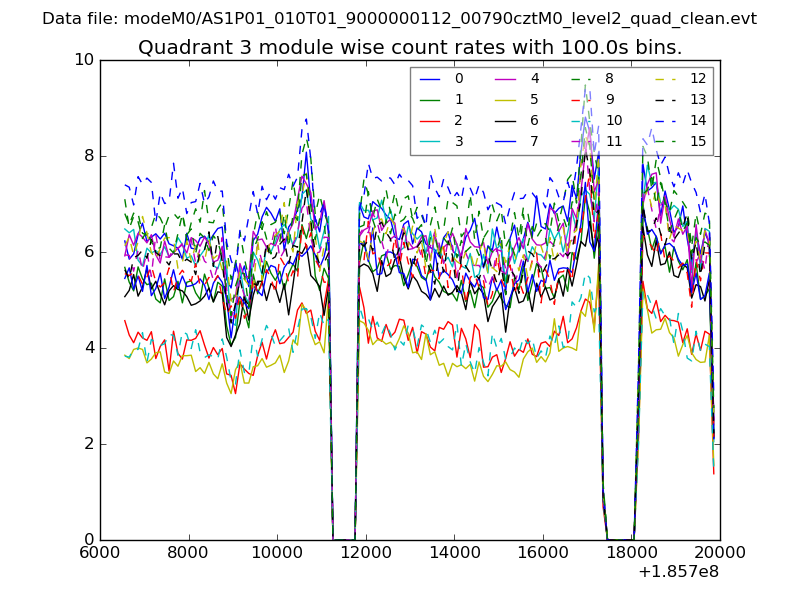 |
 |
| Parameter | Plot |
|---|---|
| CZT HV Monitor | 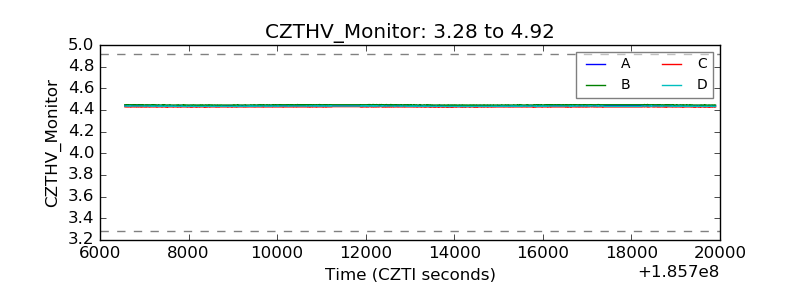 |
| D_VDD | 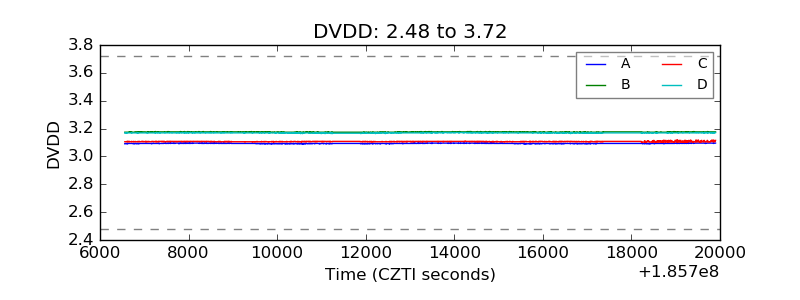 |
| Temperature 1 | 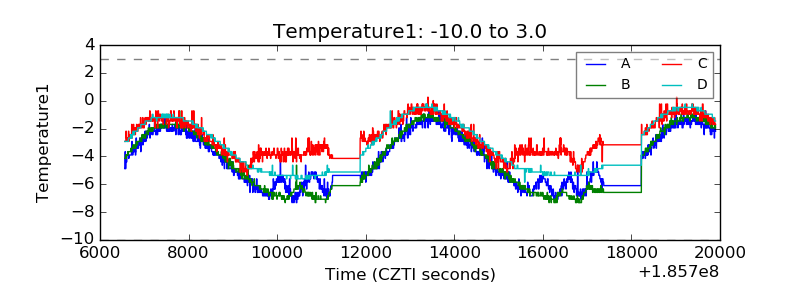 |
| Veto HV Monitor | 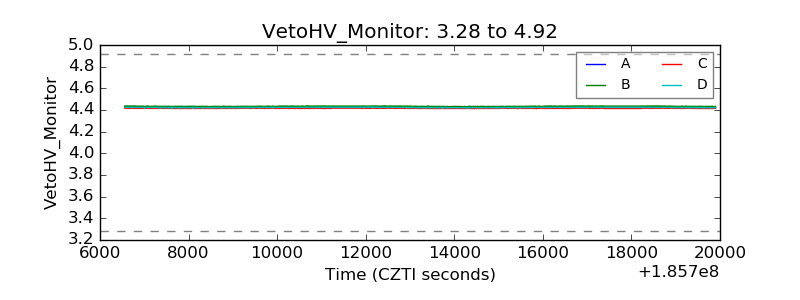 |
| Veto LLD | 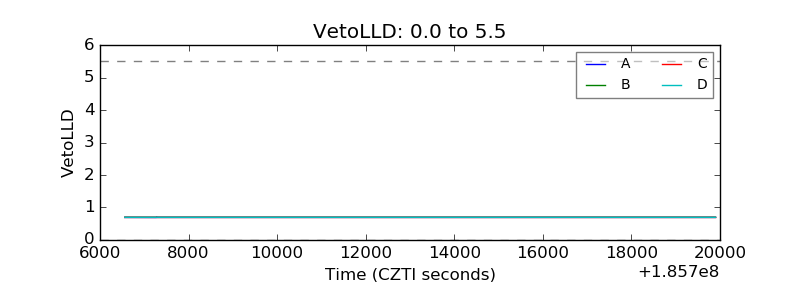 |
| Alpha Counter | 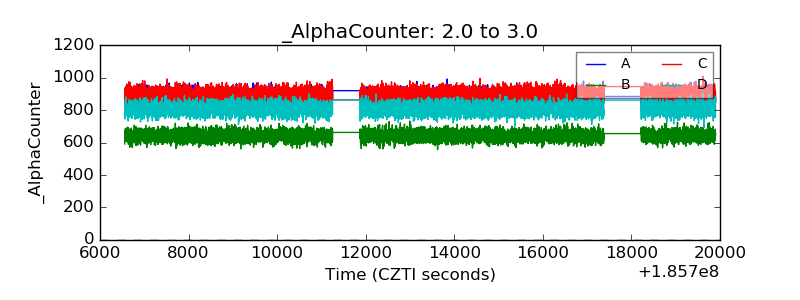 |
| _CPM_Rate | 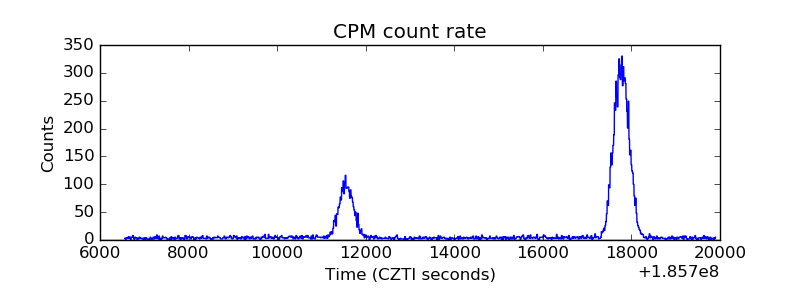 |
| CZT Counter | 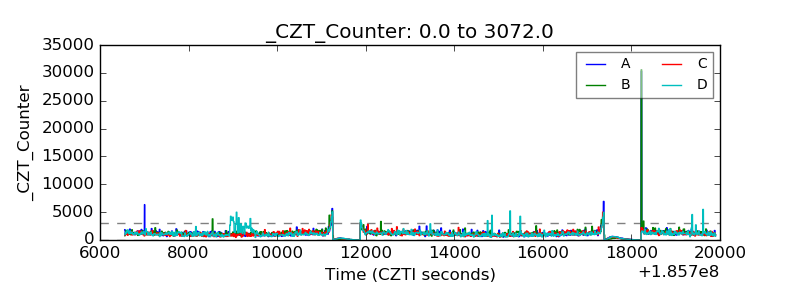 |
| +2.5 Volts monitor |  |
| +5 Volts monitor |  |
| _ROLL_ROT | 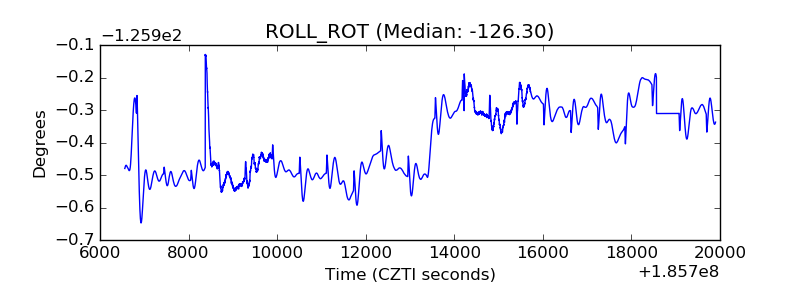 |
| _Roll_DEC | 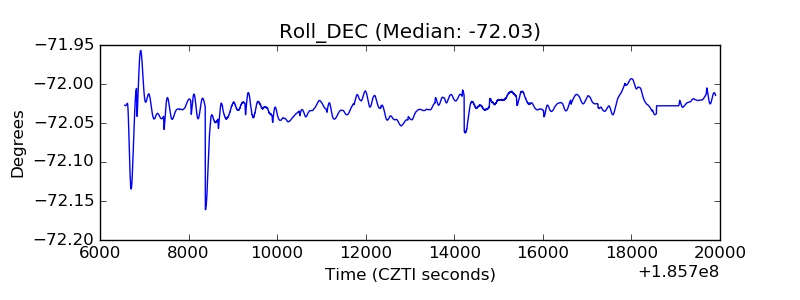 |
| _Roll_RA | 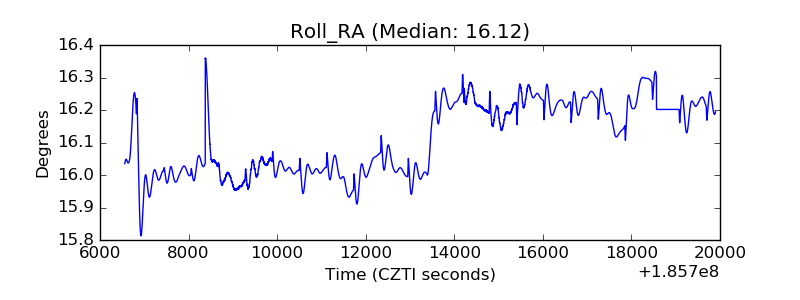 |
| Veto Counter | 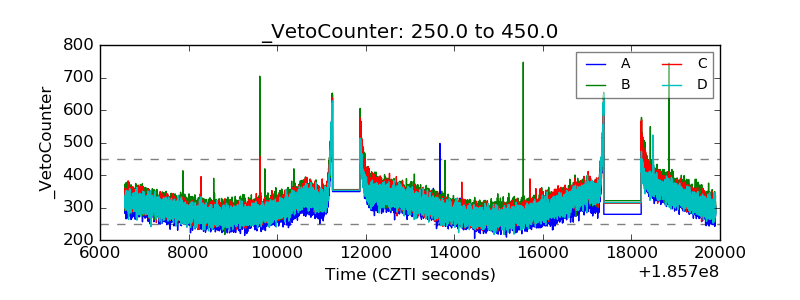 |