| Param | Original file | Final file |
|---|---|---|
| Filename | modeM0/AS1P01_010T01_9000000112_00794cztM0_level2.evt | modeM0/AS1P01_010T01_9000000112_00794cztM0_level2_quad_clean.evt |
| Size (bytes) | 973,411,200 | 97,588,800 |
| Size | 928.3 MB | 93.1 MB |
| Events in quadrant A | 7,494,438 | 644,132 |
| Events in quadrant B | 7,755,222 | 651,583 |
| Events in quadrant C | 6,923,197 | 627,063 |
| Events in quadrant D | 6,899,252 | 603,825 |
| Mode M9 | |||
|---|---|---|---|
| Quadrant | BADHDUFLAG | Total packets | Discarded packets |
| A | 0 | 12 | 0 |
| B | 0 | 12 | 0 |
| C | 0 | 12 | 0 |
| D | 0 | 12 | 0 |
| Mode M0 | |||
|---|---|---|---|
| Quadrant | BADHDUFLAG | Total packets | Discarded packets |
| A | 0 | 26595 | 0 |
| B | 0 | 27431 | 0 |
| C | 0 | 24976 | 0 |
| D | 0 | 24943 | 0 |
| Mode SS | |||
|---|---|---|---|
| Quadrant | BADHDUFLAG | Total packets | Discarded packets |
| A | 0 | 124 | 0 |
| B | 0 | 124 | 0 |
| C | 0 | 124 | 0 |
| D | 0 | 124 | 0 |
| Quadrant | Total seconds | Saturated seconds | Saturation percentage |
|---|---|---|---|
| A | 6144 | 43 | 0.699870% |
| B | 6144 | 18 | 0.292969% |
| C | 6144 | 10 | 0.162760% |
| D | 6144 | 127 | 2.067057% |
Noise dominated data is calculated using 1-second bins in cleaned event files. If a bin has >2000 counts, and if more than 50% of those come from <1% of pixels, then it is considered to be noise-dominated and hence unusable.
| Quadrant | # 1 sec bins | Bins with >0 counts | Bins with >2000 counts | High rate bins dominated by noise | Noise dominated (total time) | Noise dominated (detector-on time) | Marked lightcurve |
|---|---|---|---|---|---|---|---|
| A | 7384 | 6145 | 274 | 274 | 3.71% | 4.46% | 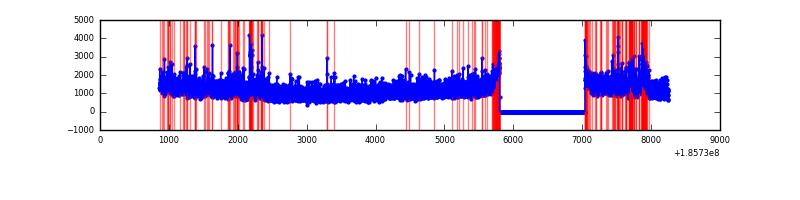 |
| B | 7384 | 6145 | 223 | 223 | 3.02% | 3.63% | 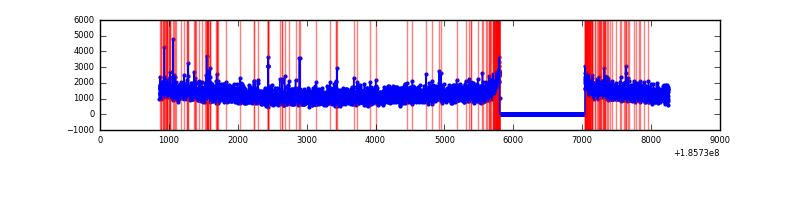 |
| C | 7384 | 6145 | 122 | 122 | 1.65% | 1.99% | 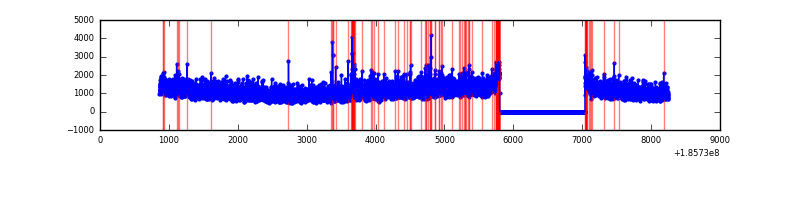 |
| D | 7384 | 6145 | 220 | 220 | 2.98% | 3.58% | 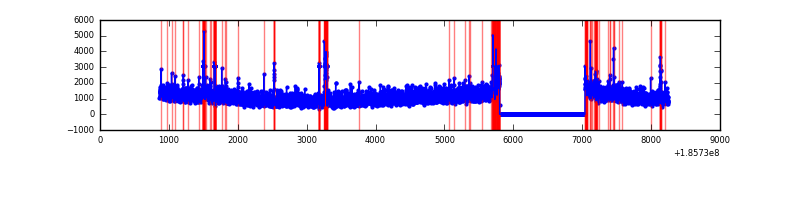 |
Top three noisy pixels from each quadrant. If the there are fewer than three noisy pixels in the level2.evt file, extra rows are filled as -1
| Pixel properties | Quadrant properties | ||||||
|---|---|---|---|---|---|---|---|
| Quadrant | DetID | PixID | Counts | Sigma | Mean | Median | Sigma |
| A | 12 | 243 | 206293 | 462.53 | 1846 | 1865 | 442.0 |
| A | 15 | 233 | 175022 | 391.78 | 1846 | 1865 | 442.0 |
| A | 15 | 171 | 18472 | 37.57 | 1846 | 1865 | 442.0 |
| B | 0 | 220 | 155372 | 337.03 | 1942 | 1950 | 455.2 |
| B | 0 | 23 | 84222 | 180.73 | 1942 | 1950 | 455.2 |
| B | 0 | 230 | 33457 | 69.21 | 1942 | 1950 | 455.2 |
| C | 9 | 52 | 95477 | 197.75 | 1720 | 1779 | 473.8 |
| C | 15 | 241 | 48031 | 97.61 | 1720 | 1779 | 473.8 |
| C | 3 | 111 | 28740 | 56.9 | 1720 | 1779 | 473.8 |
| D | 13 | 25 | 293969 | 584.49 | 1629 | 1683 | 500.1 |
| D | 1 | 4 | 269528 | 535.62 | 1629 | 1683 | 500.1 |
| D | 2 | 16 | 91399 | 179.41 | 1629 | 1683 | 500.1 |
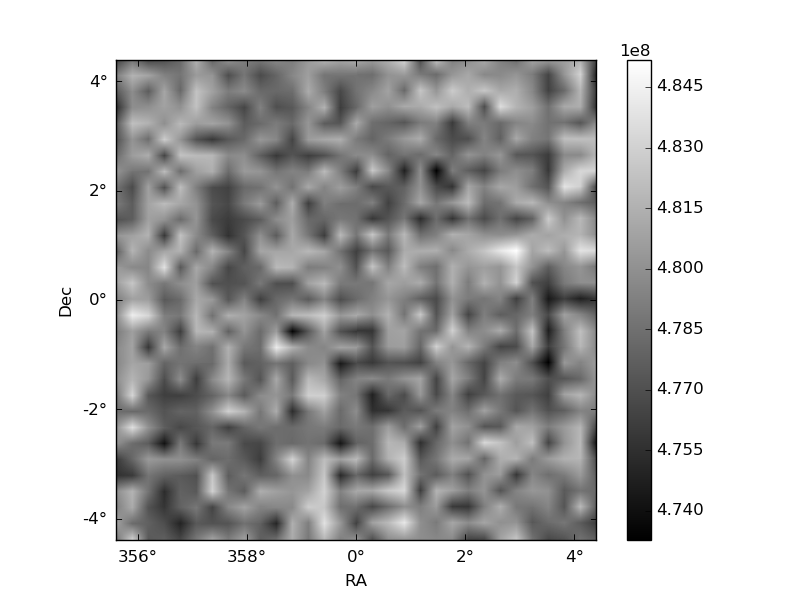
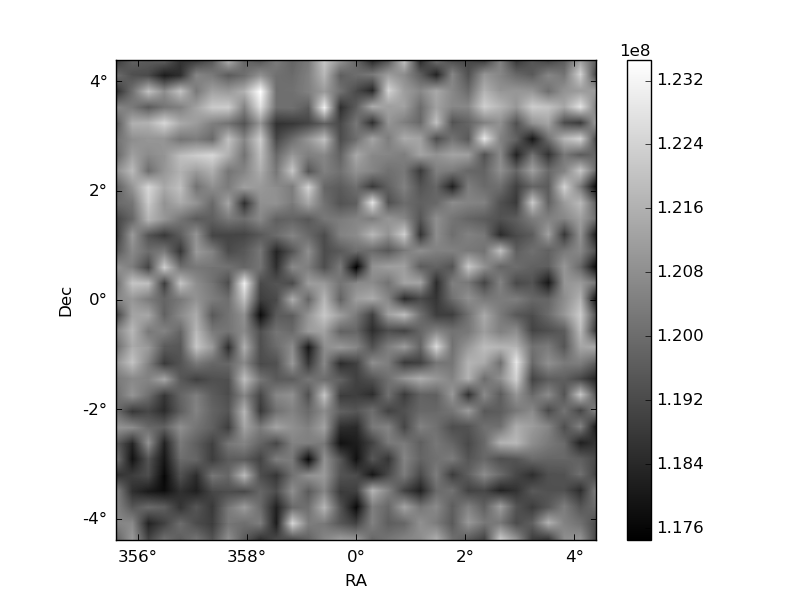
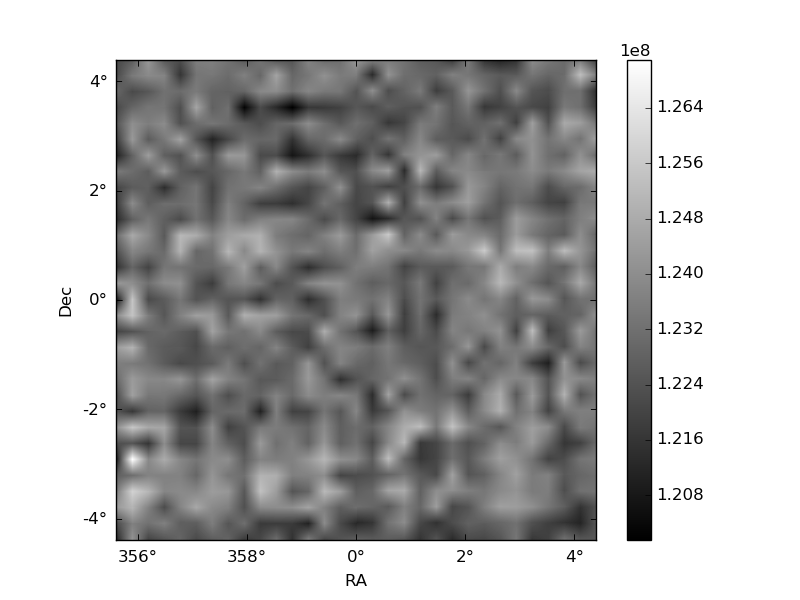
Histogram calculated using DETX and DETY for each event in the final _common_clean file
| Quadrant A | 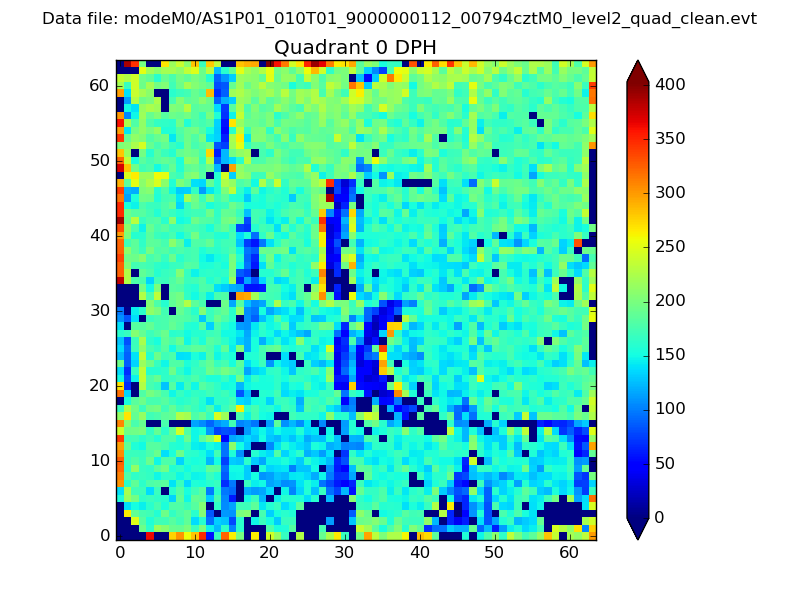 |
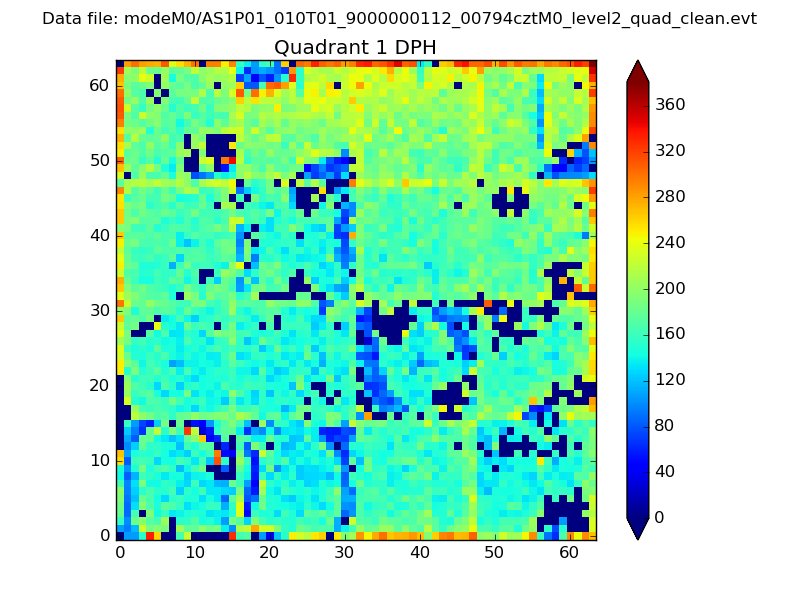 |
Quadrant B |
|---|---|---|---|
| Quadrant D | 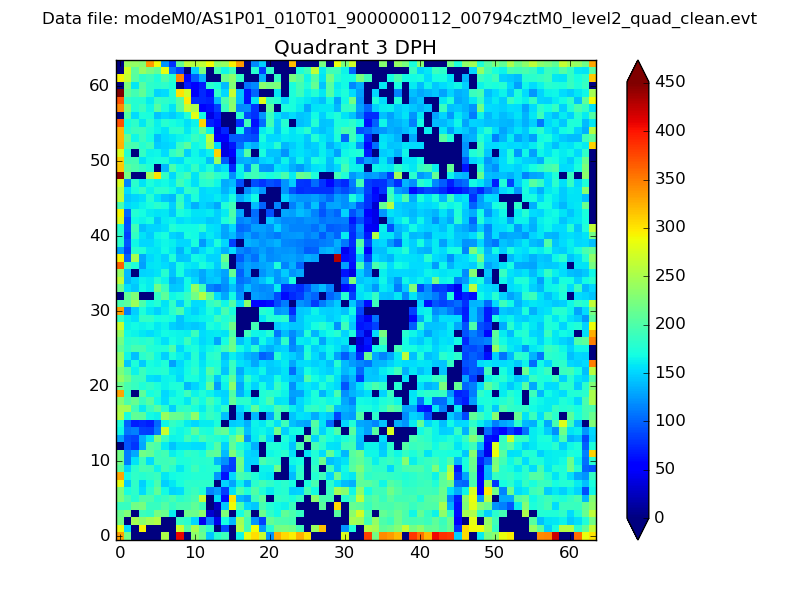 |
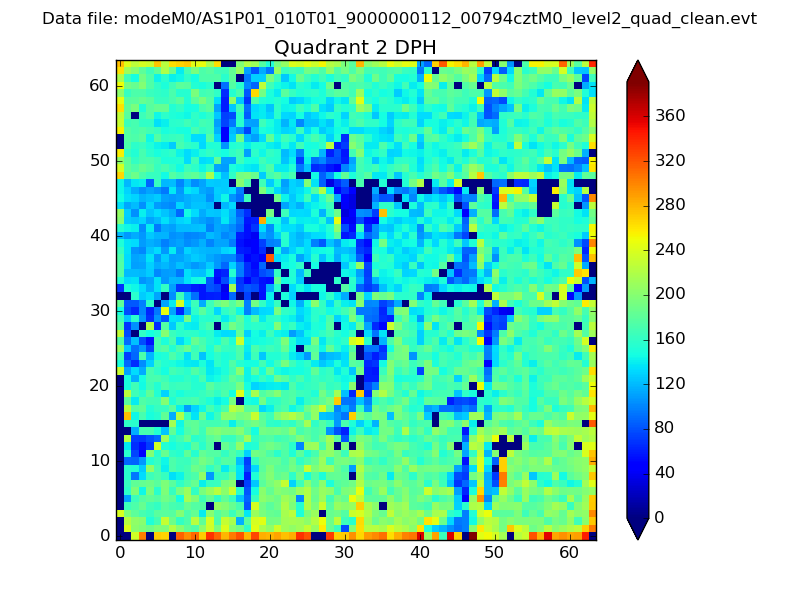 |
Quadrant C |
| Plot type | Count rate plots | Images |
|---|---|---|
| Comparison with Poisson distribution Blue bars denote a histogram of data divided into 1 sec bins. Red curve is a Poisson curve with rate = median count rate of data. |
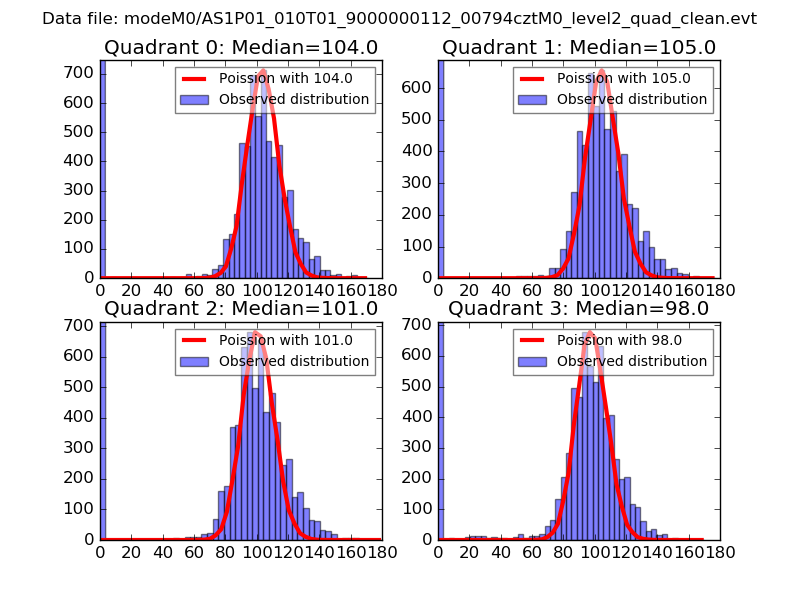 |
 |
| Quadrant-wise count rates Data is divided into 100 sec bins |
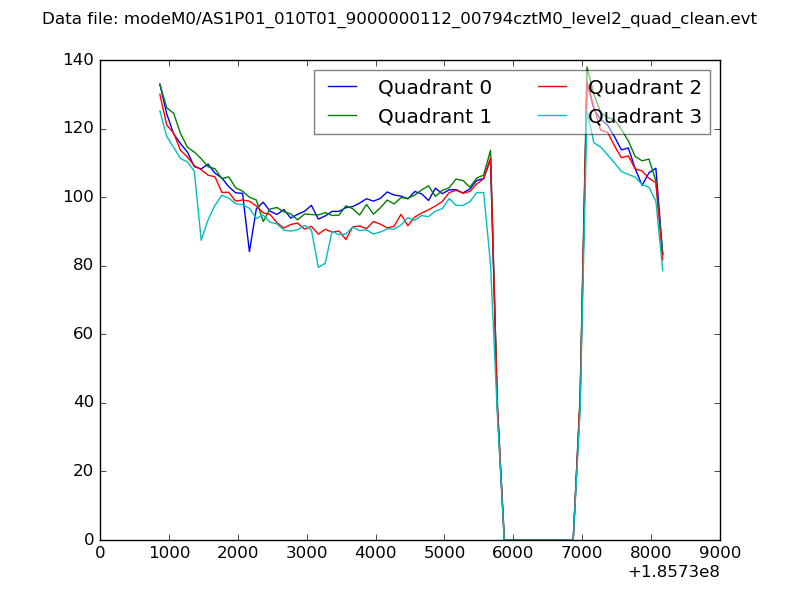 |
|
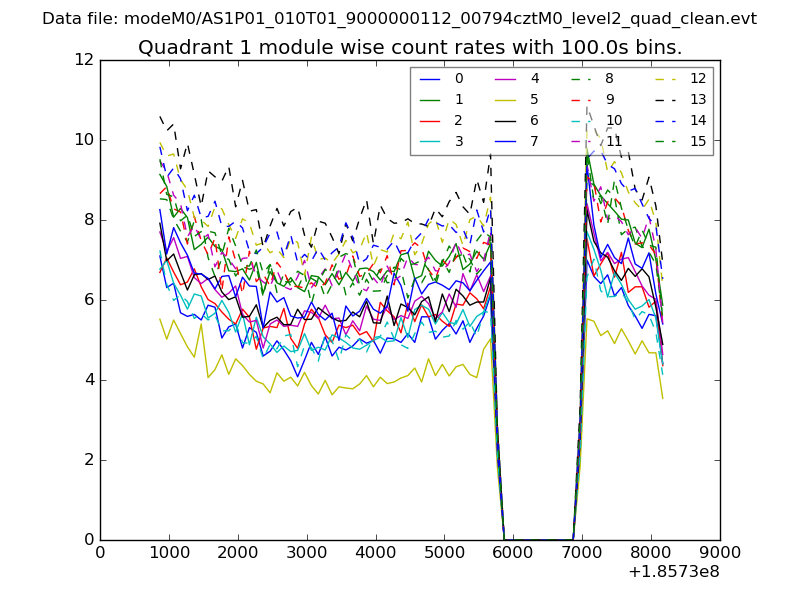
| Module-wise count rates for Quadrant A Data is divided into 100 sec bins |
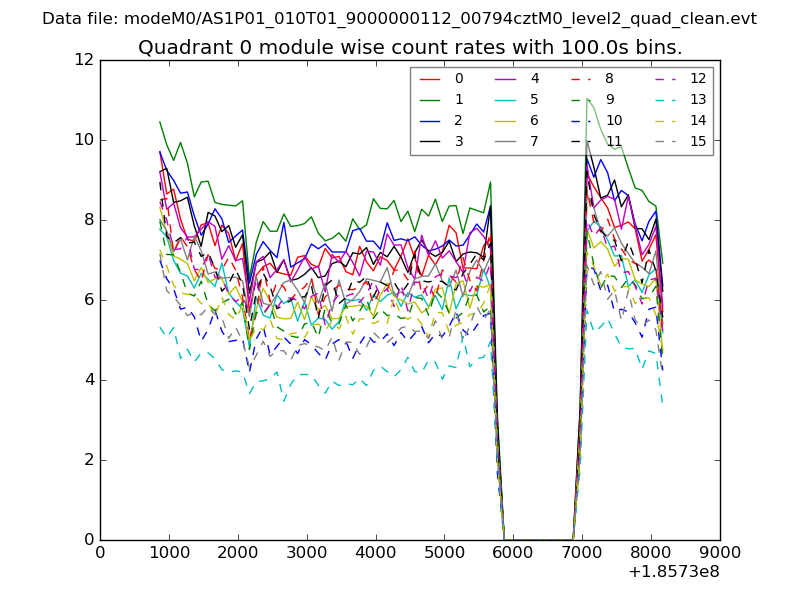 |
 |
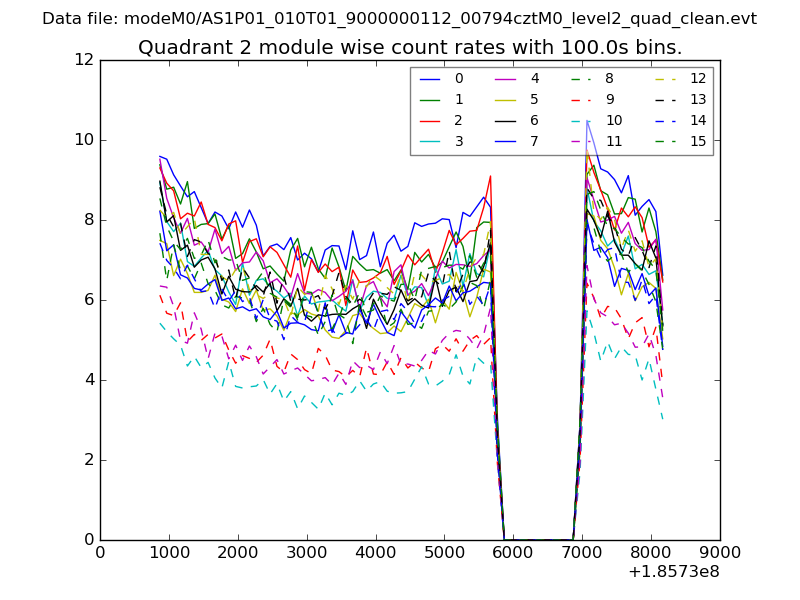
| Module-wise count rates for Quadrant B Data is divided into 100 sec bins |
 |
 |
| Module-wise count rates for Quadrant C Data is divided into 100 sec bins |
 |
 |
| Module-wise count rates for Quadrant D Data is divided into 100 sec bins |
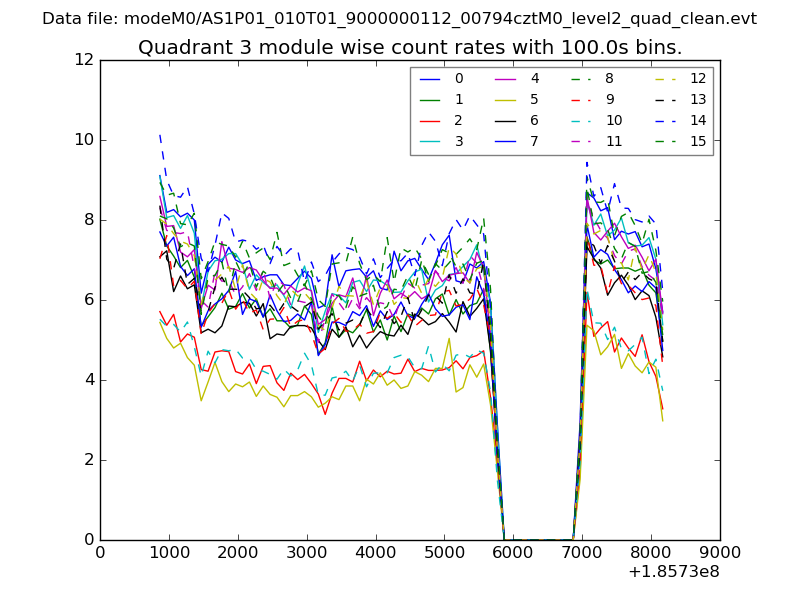 |
 |
| Parameter | Plot |
|---|---|
| CZT HV Monitor | 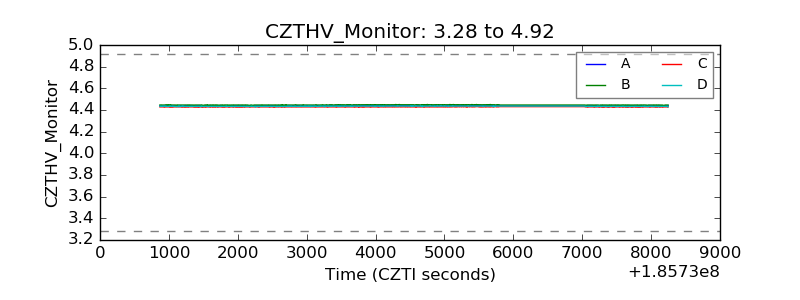 |
| D_VDD | 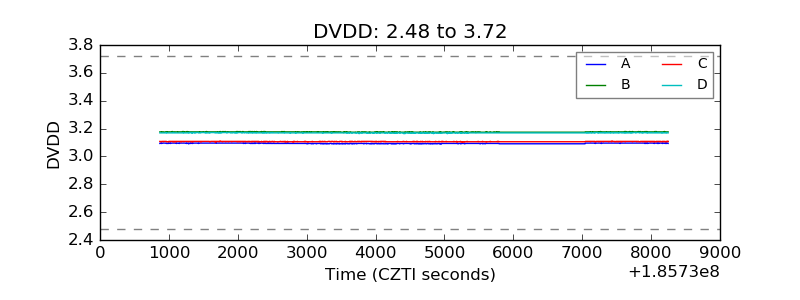 |
| Temperature 1 |  |
| Veto HV Monitor | 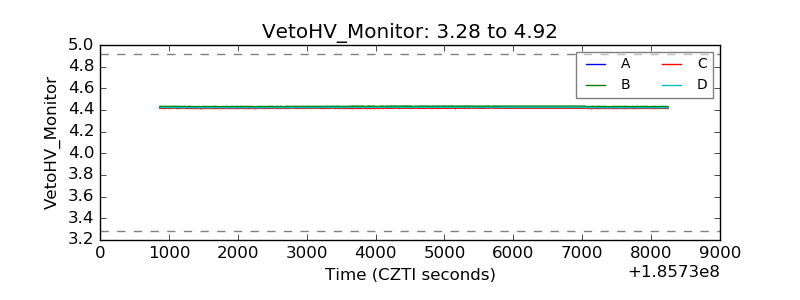 |
| Veto LLD | 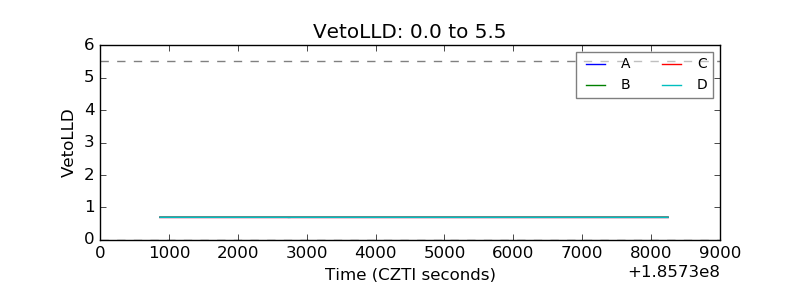 |
| Alpha Counter | 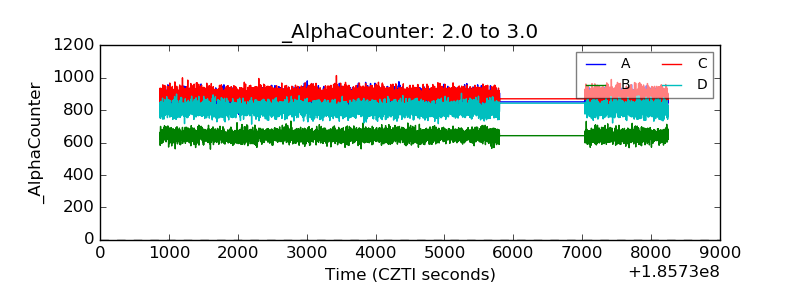 |
| _CPM_Rate | 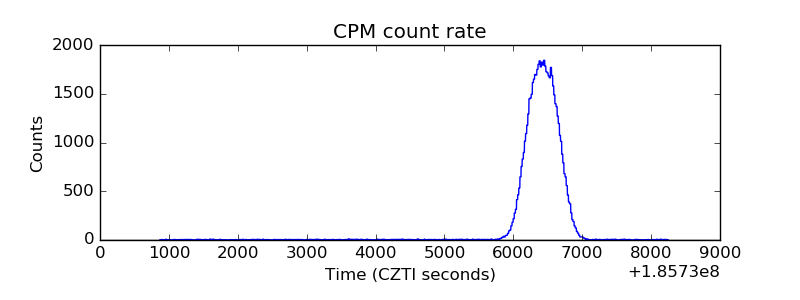 |
| CZT Counter | 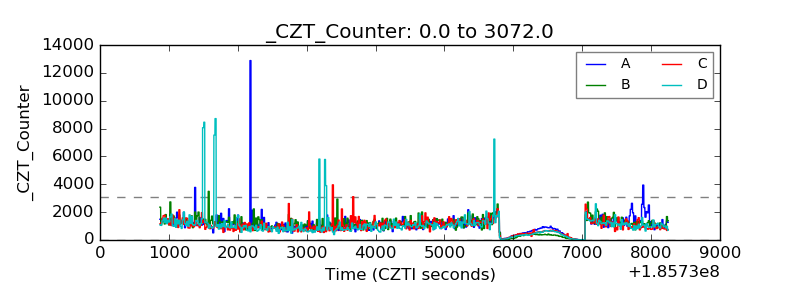 |
| +2.5 Volts monitor |  |
| +5 Volts monitor |  |
| _ROLL_ROT | 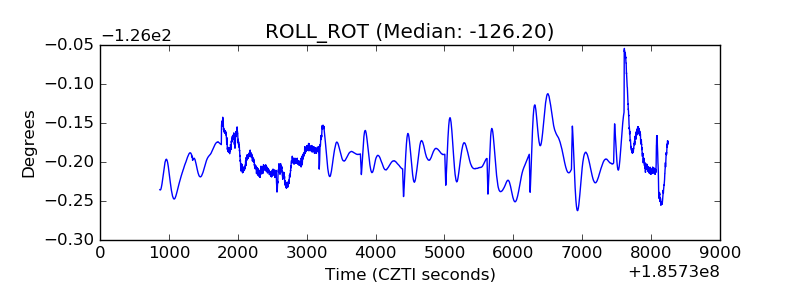 |
| _Roll_DEC | 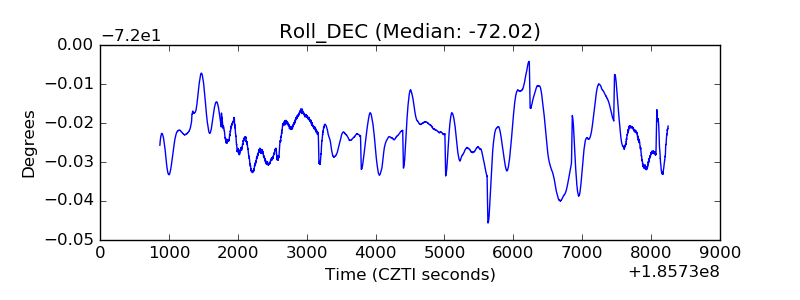 |
| _Roll_RA | 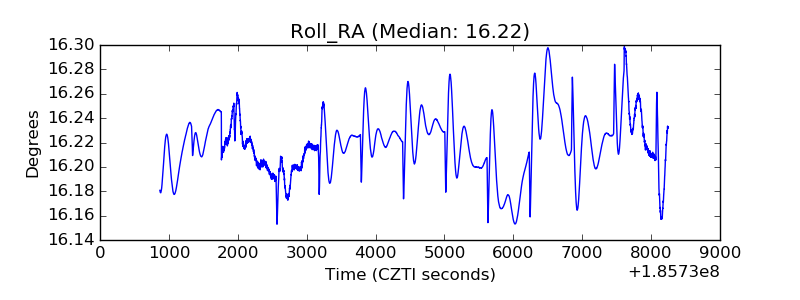 |
| Veto Counter | 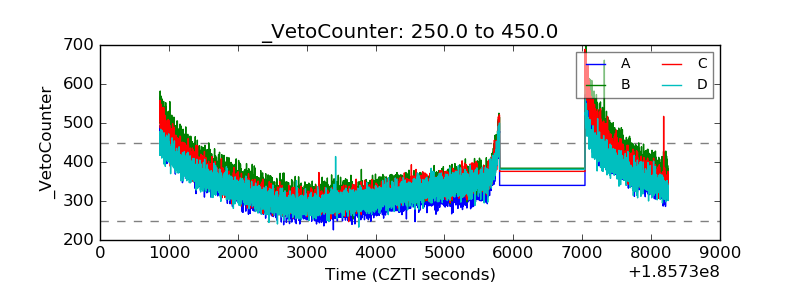 |