| Param | Original file | Final file |
|---|---|---|
| Filename | modeM0/AS1P01_010T01_9000000112_00795cztM0_level2.evt | modeM0/AS1P01_010T01_9000000112_00795cztM0_level2_quad_clean.evt |
| Size (bytes) | 973,457,280 | 99,973,440 |
| Size | 928.4 MB | 95.3 MB |
| Events in quadrant A | 7,381,199 | 660,835 |
| Events in quadrant B | 7,746,185 | 672,026 |
| Events in quadrant C | 6,989,094 | 642,171 |
| Events in quadrant D | 6,953,251 | 619,992 |
| Mode M9 | |||
|---|---|---|---|
| Quadrant | BADHDUFLAG | Total packets | Discarded packets |
| A | 0 | 16 | 0 |
| B | 0 | 16 | 0 |
| C | 0 | 16 | 0 |
| D | 0 | 16 | 0 |
| Mode M0 | |||
|---|---|---|---|
| Quadrant | BADHDUFLAG | Total packets | Discarded packets |
| A | 0 | 26309 | 0 |
| B | 0 | 27427 | 0 |
| C | 0 | 25210 | 0 |
| D | 0 | 25113 | 0 |
| Mode SS | |||
|---|---|---|---|
| Quadrant | BADHDUFLAG | Total packets | Discarded packets |
| A | 0 | 126 | 0 |
| B | 0 | 126 | 0 |
| C | 0 | 126 | 0 |
| D | 0 | 126 | 0 |
| Quadrant | Total seconds | Saturated seconds | Saturation percentage |
|---|---|---|---|
| A | 6198 | 19 | 0.306551% |
| B | 6197 | 20 | 0.322737% |
| C | 6197 | 22 | 0.355010% |
| D | 6197 | 38 | 0.613200% |
Noise dominated data is calculated using 1-second bins in cleaned event files. If a bin has >2000 counts, and if more than 50% of those come from <1% of pixels, then it is considered to be noise-dominated and hence unusable.
| Quadrant | # 1 sec bins | Bins with >0 counts | Bins with >2000 counts | High rate bins dominated by noise | Noise dominated (total time) | Noise dominated (detector-on time) | Marked lightcurve |
|---|---|---|---|---|---|---|---|
| A | 7493 | 6199 | 254 | 254 | 3.39% | 4.10% | 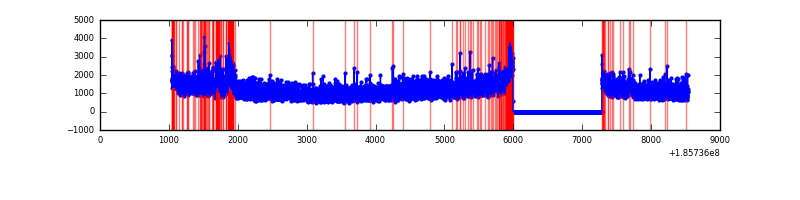 |
| B | 7492 | 6198 | 233 | 233 | 3.11% | 3.76% | 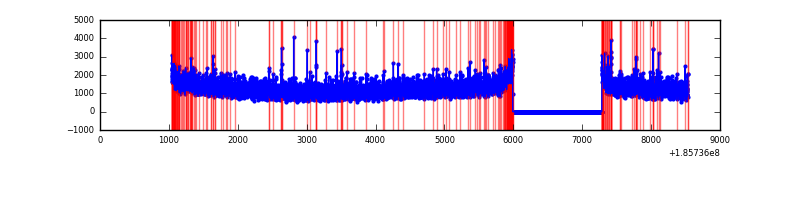 |
| C | 7492 | 6198 | 130 | 130 | 1.74% | 2.10% | 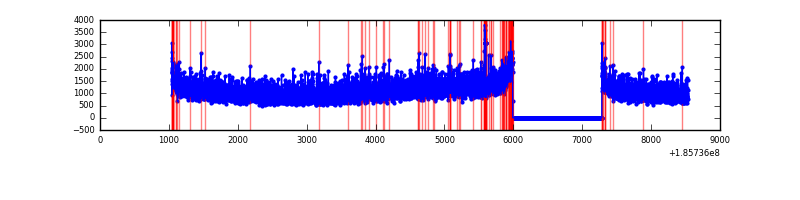 |
| D | 7492 | 6198 | 194 | 194 | 2.59% | 3.13% | 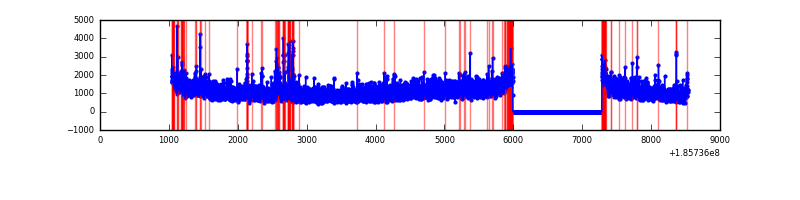 |
Top three noisy pixels from each quadrant. If the there are fewer than three noisy pixels in the level2.evt file, extra rows are filled as -1
| Pixel properties | Quadrant properties | ||||||
|---|---|---|---|---|---|---|---|
| Quadrant | DetID | PixID | Counts | Sigma | Mean | Median | Sigma |
| A | 12 | 243 | 201364 | 448.55 | 1854 | 1868 | 444.8 |
| A | 15 | 233 | 39299 | 84.16 | 1854 | 1868 | 444.8 |
| A | 10 | 133 | 16598 | 33.12 | 1854 | 1868 | 444.8 |
| B | 0 | 220 | 91898 | 196.74 | 1956 | 1962 | 457.1 |
| B | 0 | 23 | 72937 | 155.26 | 1956 | 1962 | 457.1 |
| B | 5 | 191 | 40173 | 83.59 | 1956 | 1962 | 457.1 |
| C | 9 | 52 | 88373 | 181.13 | 1739 | 1796 | 478.0 |
| C | 15 | 241 | 47993 | 96.65 | 1739 | 1796 | 478.0 |
| C | 3 | 111 | 27746 | 54.29 | 1739 | 1796 | 478.0 |
| D | 1 | 4 | 227545 | 438.45 | 1669 | 1722 | 515.0 |
| D | 13 | 25 | 218520 | 420.93 | 1669 | 1722 | 515.0 |
| D | 13 | 164 | 139431 | 267.37 | 1669 | 1722 | 515.0 |
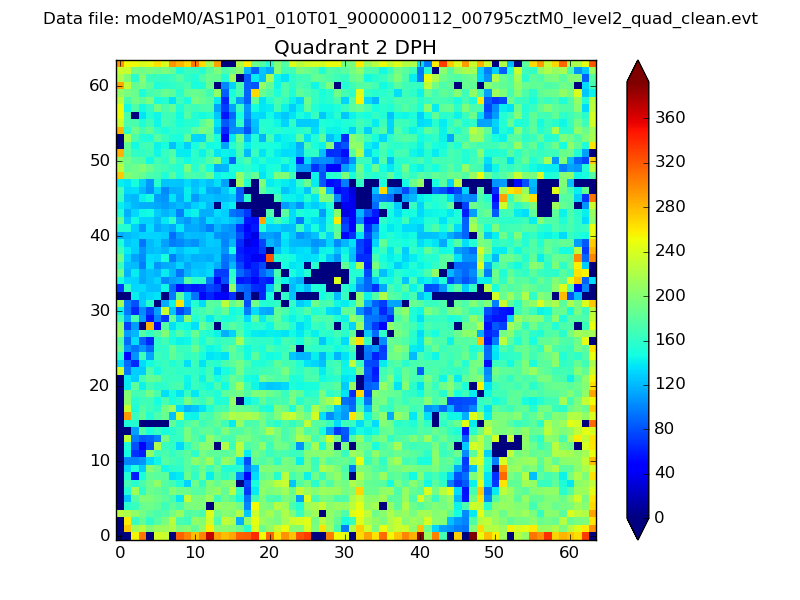
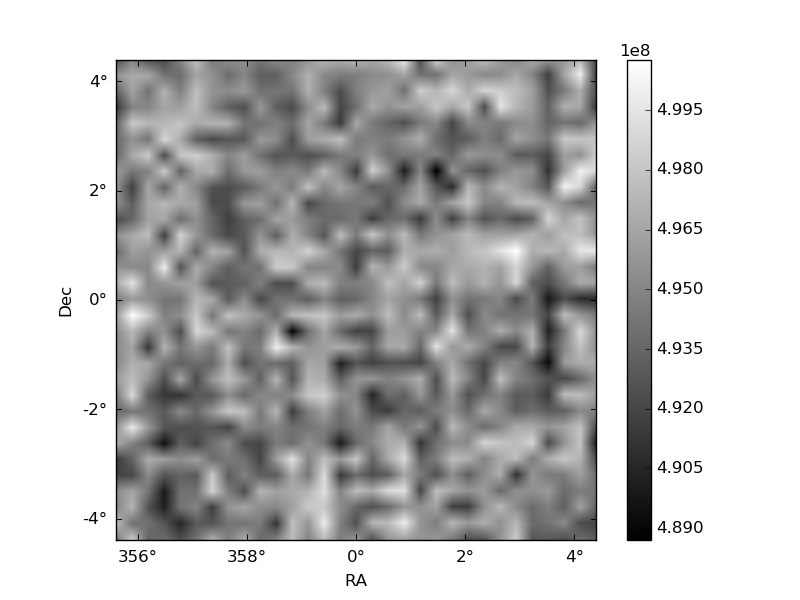
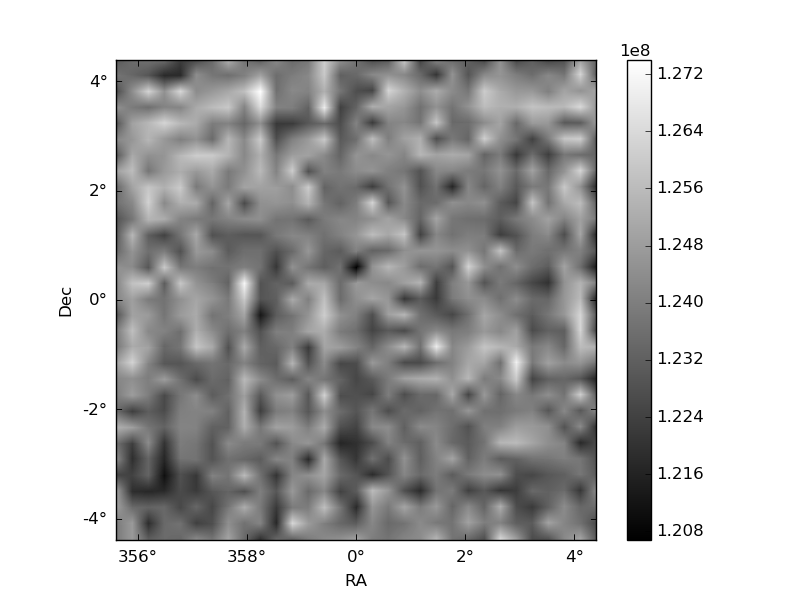
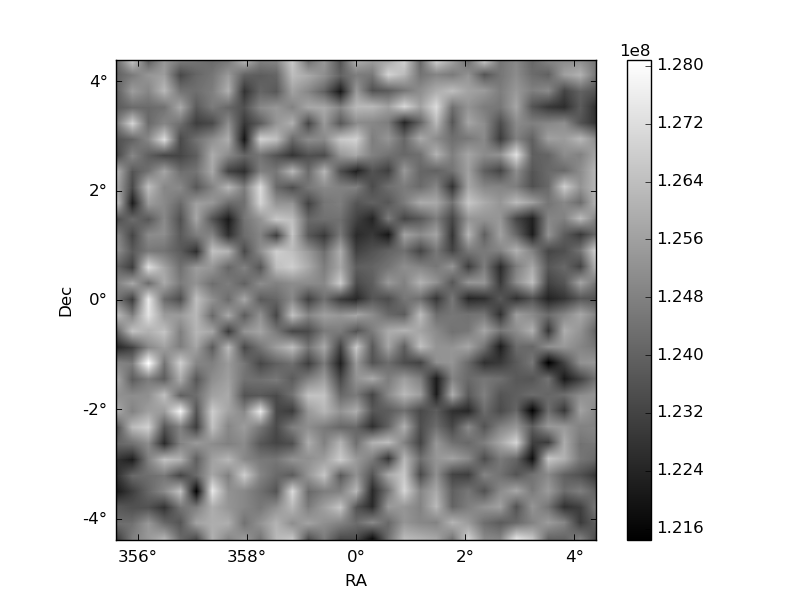
Histogram calculated using DETX and DETY for each event in the final _common_clean file
| Quadrant A | 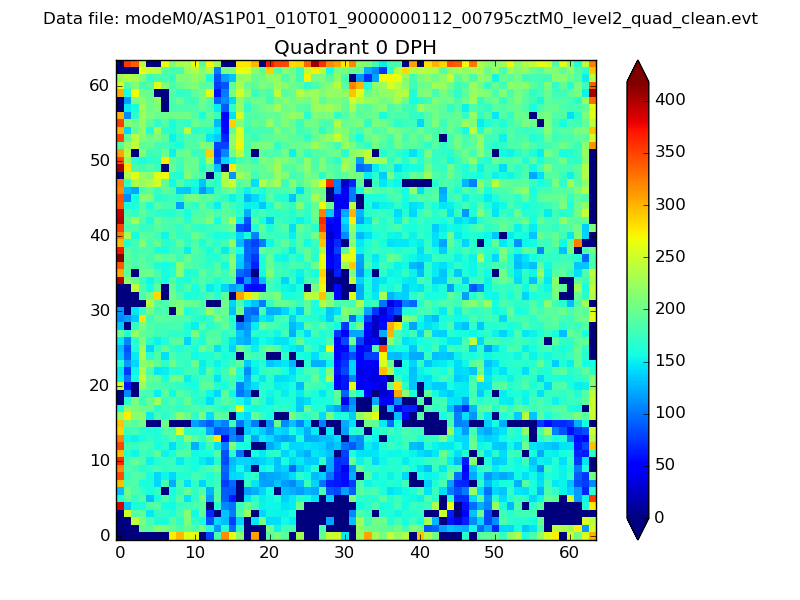 |
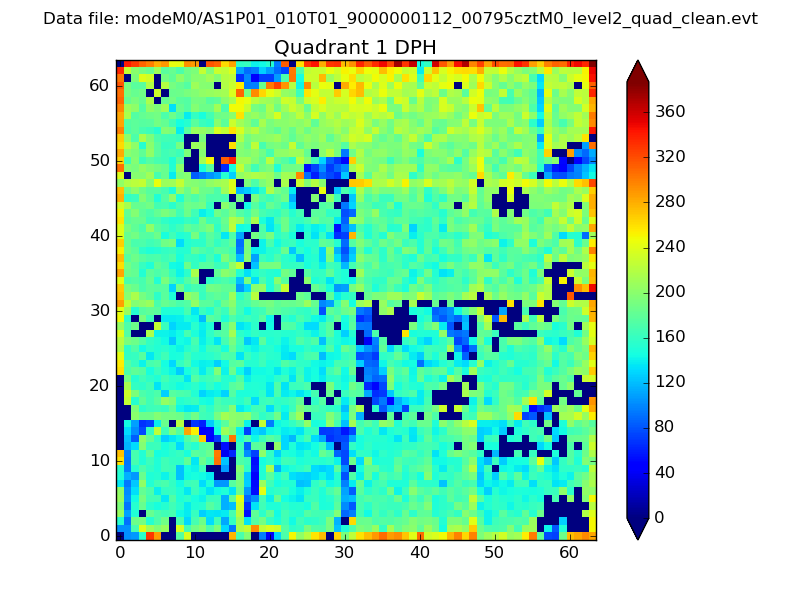 |
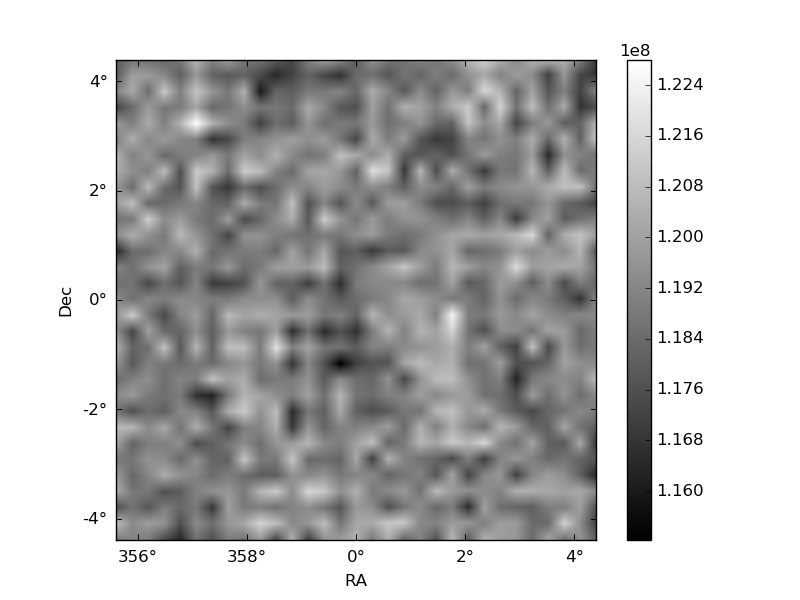
Quadrant B |
|---|---|---|---|
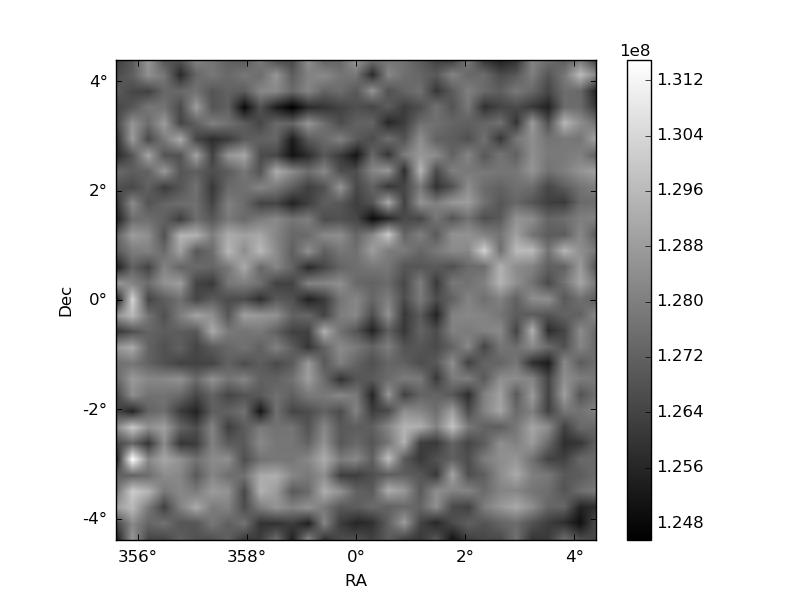
| Quadrant D | 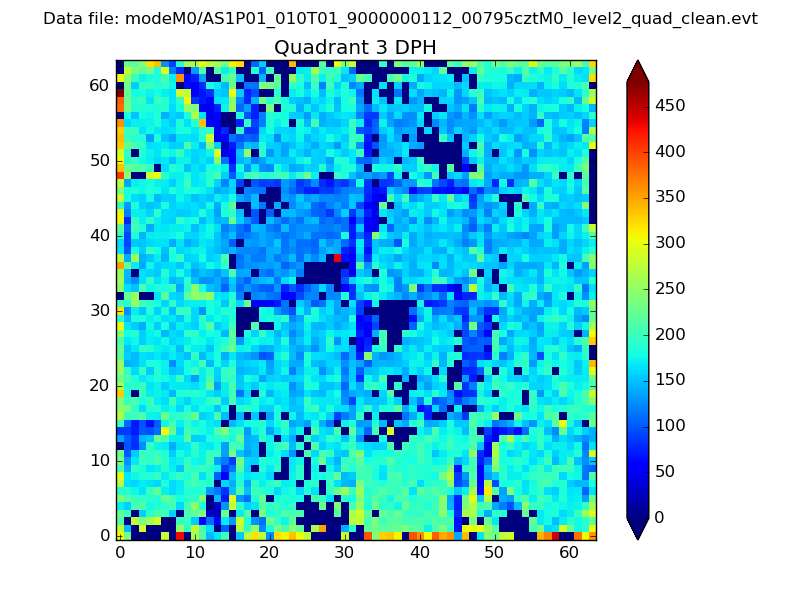 |
 |
Quadrant C |
| Plot type | Count rate plots | Images |
|---|---|---|
| Comparison with Poisson distribution Blue bars denote a histogram of data divided into 1 sec bins. Red curve is a Poisson curve with rate = median count rate of data. |
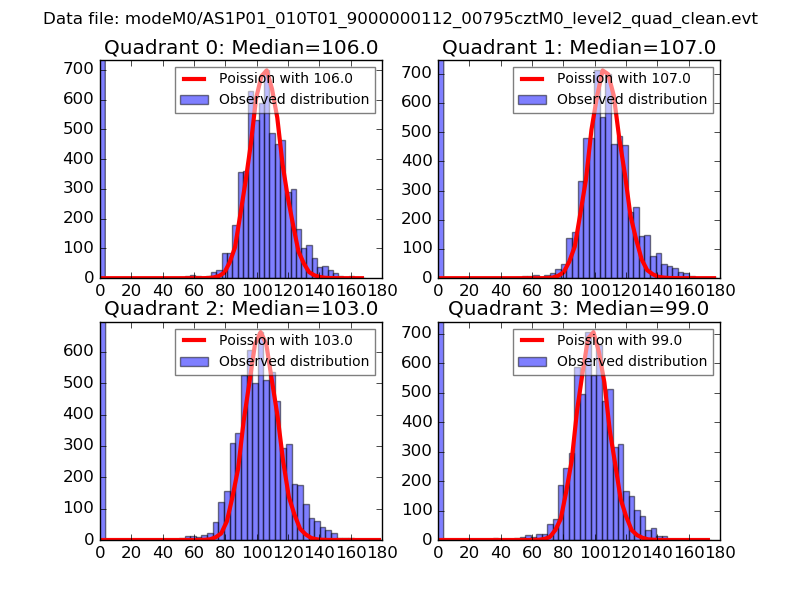 |
 |
| Quadrant-wise count rates Data is divided into 100 sec bins |
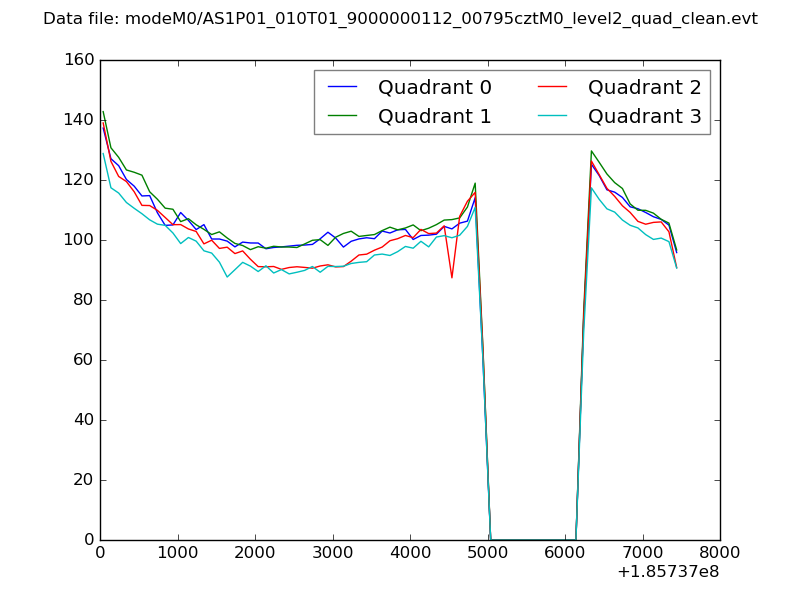 |
|
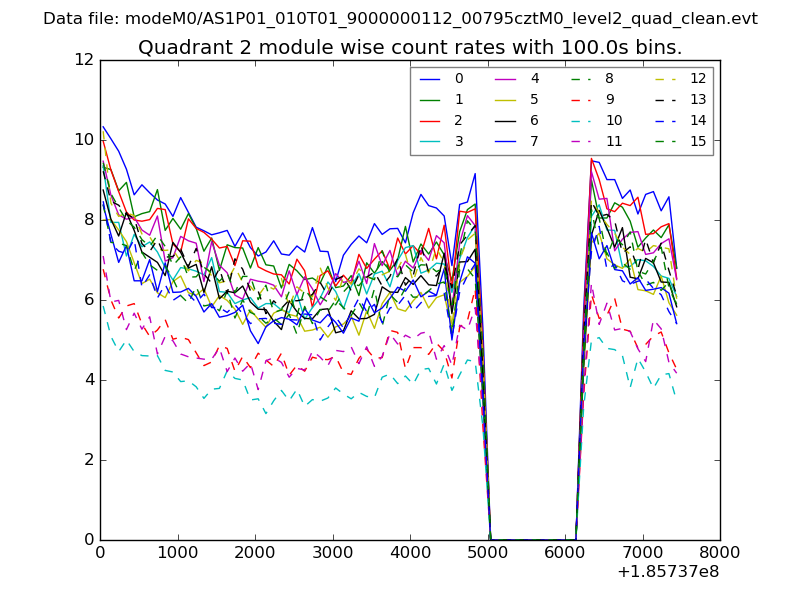
| Module-wise count rates for Quadrant A Data is divided into 100 sec bins |
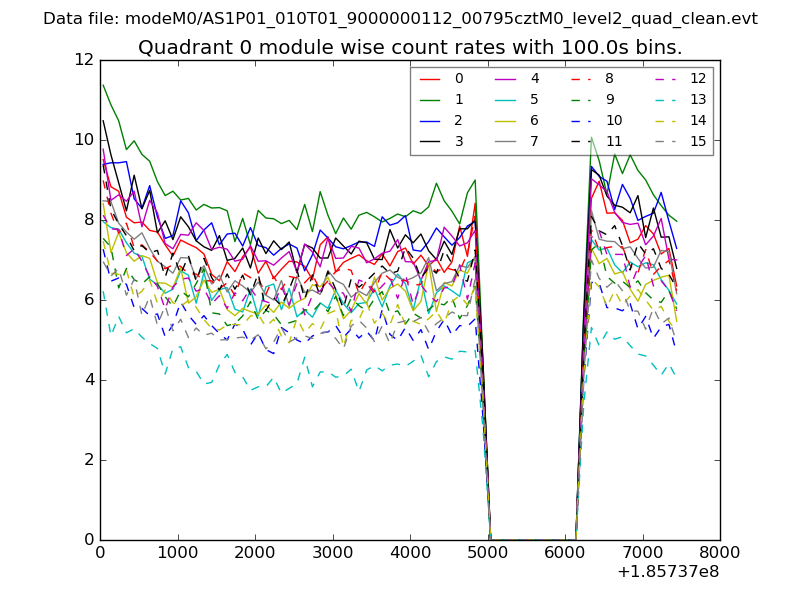 |
 |
| Module-wise count rates for Quadrant B Data is divided into 100 sec bins |
 |
 |
| Module-wise count rates for Quadrant C Data is divided into 100 sec bins |
 |
 |
| Module-wise count rates for Quadrant D Data is divided into 100 sec bins |
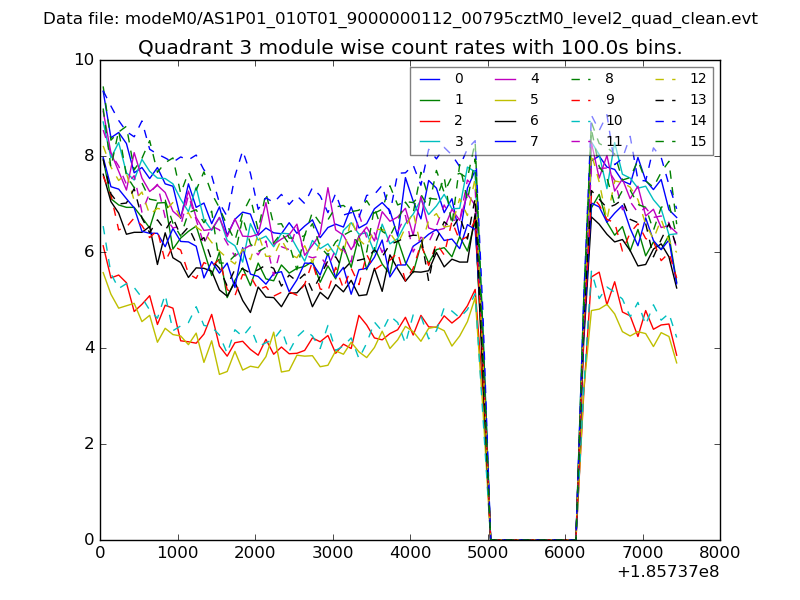 |
 |
| Parameter | Plot |
|---|---|
| CZT HV Monitor | 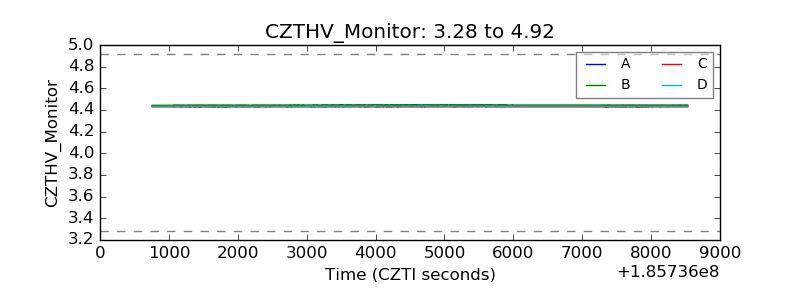 |
| D_VDD | 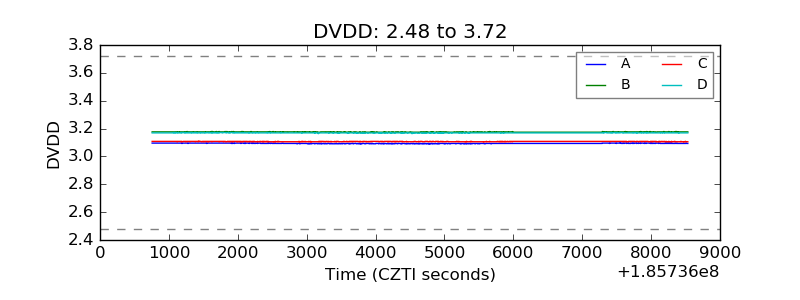 |
| Temperature 1 |  |
| Veto HV Monitor | 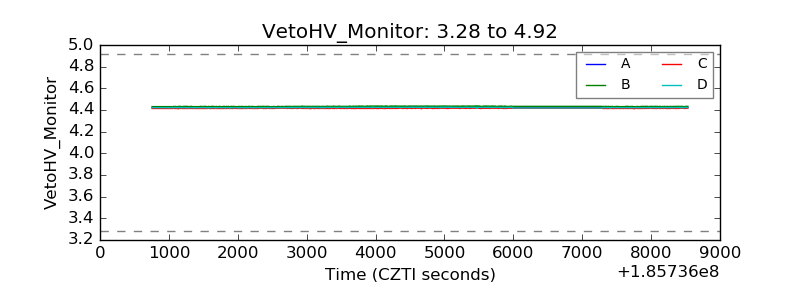 |
| Veto LLD | 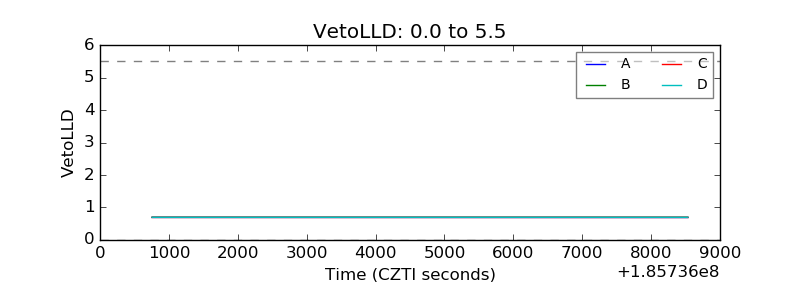 |
| Alpha Counter | 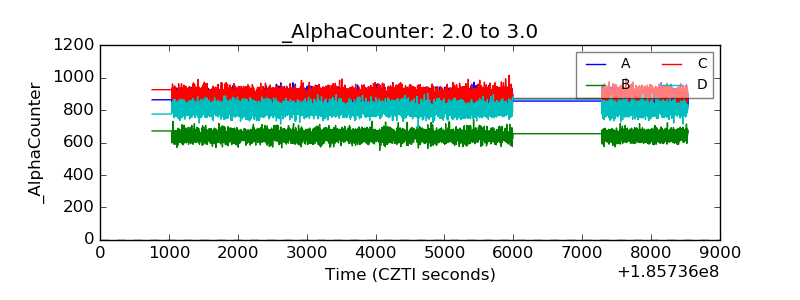 |
| _CPM_Rate | 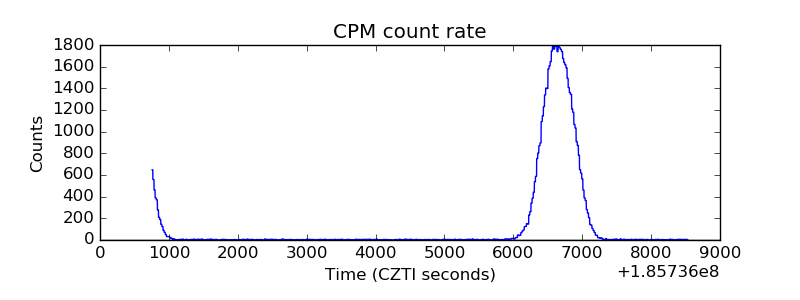 |
| CZT Counter | 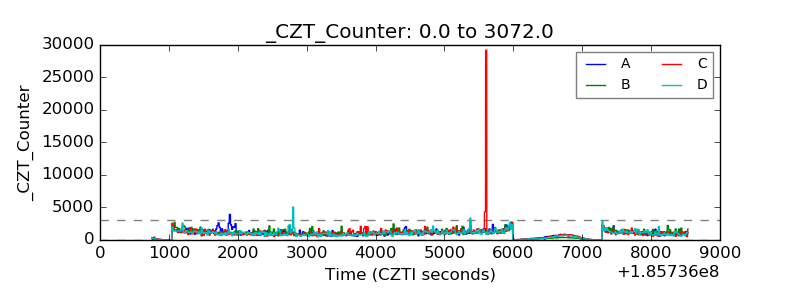 |
| +2.5 Volts monitor |  |
| +5 Volts monitor |  |
| _ROLL_ROT | 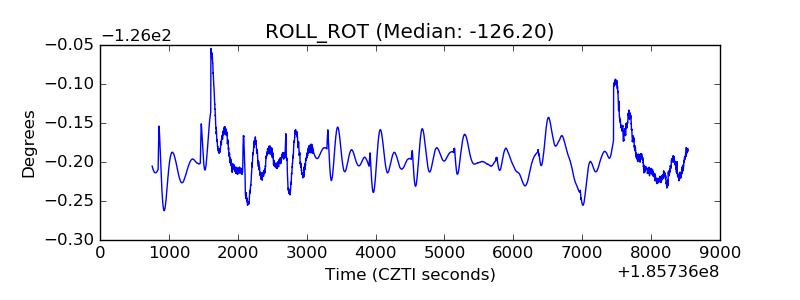 |
| _Roll_DEC | 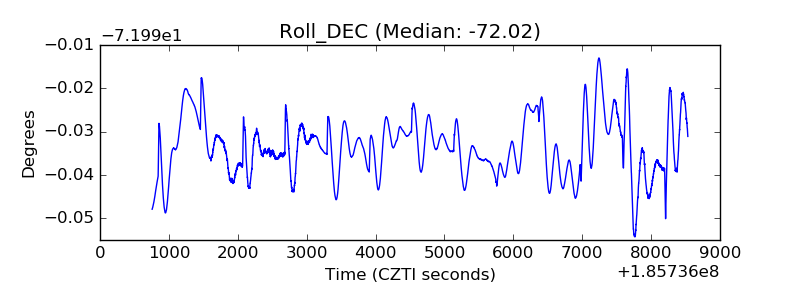 |
| _Roll_RA | 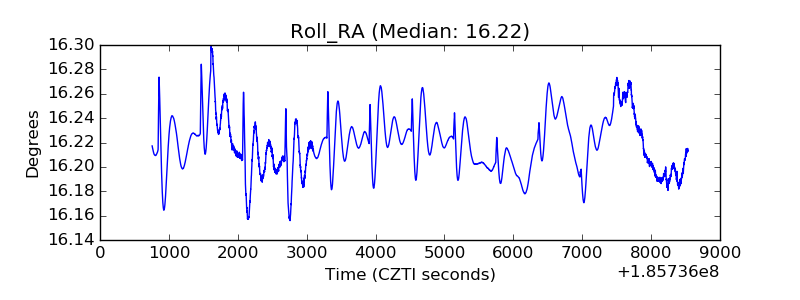 |
| Veto Counter |  |