| Param | Original file | Final file |
|---|---|---|
| Filename | modeM0/AS1P01_010T01_9000000112_00796cztM0_level2.evt | modeM0/AS1P01_010T01_9000000112_00796cztM0_level2_quad_clean.evt |
| Size (bytes) | 933,459,840 | 96,912,000 |
| Size | 890.2 MB | 92.4 MB |
| Events in quadrant A | 7,016,915 | 636,284 |
| Events in quadrant B | 7,578,042 | 648,012 |
| Events in quadrant C | 6,763,079 | 622,326 |
| Events in quadrant D | 6,505,259 | 601,385 |
| Mode M9 | |||
|---|---|---|---|
| Quadrant | BADHDUFLAG | Total packets | Discarded packets |
| A | 0 | 13 | 0 |
| B | 0 | 13 | 0 |
| C | 0 | 13 | 0 |
| D | 0 | 13 | 0 |
| Mode M0 | |||
|---|---|---|---|
| Quadrant | BADHDUFLAG | Total packets | Discarded packets |
| A | 0 | 25219 | 0 |
| B | 0 | 26835 | 0 |
| C | 0 | 24431 | 0 |
| D | 0 | 23692 | 0 |
| Mode SS | |||
|---|---|---|---|
| Quadrant | BADHDUFLAG | Total packets | Discarded packets |
| A | 0 | 124 | 0 |
| B | 0 | 124 | 0 |
| C | 0 | 124 | 0 |
| D | 0 | 124 | 0 |
| Quadrant | Total seconds | Saturated seconds | Saturation percentage |
|---|---|---|---|
| A | 6117 | 16 | 0.261566% |
| B | 6117 | 20 | 0.326958% |
| C | 6117 | 5 | 0.081739% |
| D | 6117 | 11 | 0.179827% |
Noise dominated data is calculated using 1-second bins in cleaned event files. If a bin has >2000 counts, and if more than 50% of those come from <1% of pixels, then it is considered to be noise-dominated and hence unusable.
| Quadrant | # 1 sec bins | Bins with >0 counts | Bins with >2000 counts | High rate bins dominated by noise | Noise dominated (total time) | Noise dominated (detector-on time) | Marked lightcurve |
|---|---|---|---|---|---|---|---|
| A | 7392 | 6118 | 197 | 197 | 2.67% | 3.22% | 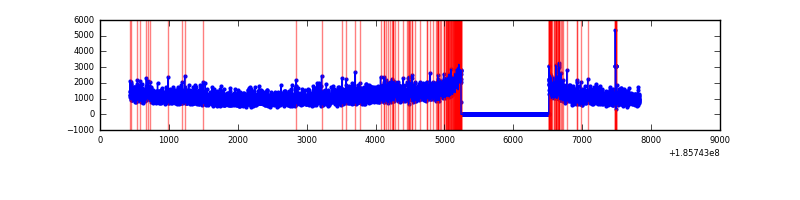 |
| B | 7392 | 6118 | 249 | 249 | 3.37% | 4.07% | 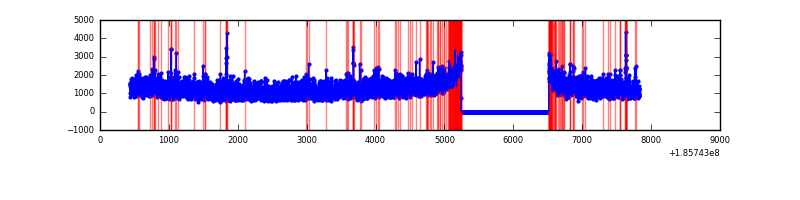 |
| C | 7392 | 6118 | 111 | 111 | 1.50% | 1.81% | 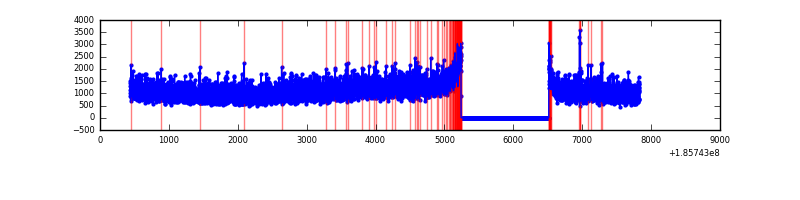 |
| D | 7392 | 6118 | 116 | 116 | 1.57% | 1.90% | 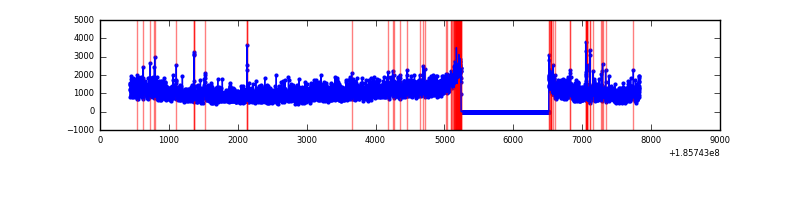 |
Top three noisy pixels from each quadrant. If the there are fewer than three noisy pixels in the level2.evt file, extra rows are filled as -1
| Pixel properties | Quadrant properties | ||||||
|---|---|---|---|---|---|---|---|
| Quadrant | DetID | PixID | Counts | Sigma | Mean | Median | Sigma |
| A | 15 | 171 | 39131 | 86.72 | 1805 | 1822 | 430.2 |
| A | 12 | 243 | 35941 | 79.3 | 1805 | 1822 | 430.2 |
| A | 10 | 133 | 13779 | 27.79 | 1805 | 1822 | 430.2 |
| B | 0 | 23 | 104012 | 229.31 | 1913 | 1926 | 445.2 |
| B | 5 | 191 | 47260 | 101.83 | 1913 | 1926 | 445.2 |
| B | 0 | 220 | 33448 | 70.81 | 1913 | 1926 | 445.2 |
| C | 15 | 241 | 42395 | 86.64 | 1702 | 1760 | 469.0 |
| C | 9 | 52 | 26716 | 53.21 | 1702 | 1760 | 469.0 |
| C | 3 | 111 | 24334 | 48.13 | 1702 | 1760 | 469.0 |
| D | 1 | 4 | 194897 | 386.61 | 1619 | 1674 | 499.8 |
| D | 13 | 25 | 100057 | 196.85 | 1619 | 1674 | 499.8 |
| D | 2 | 225 | 42313 | 81.31 | 1619 | 1674 | 499.8 |
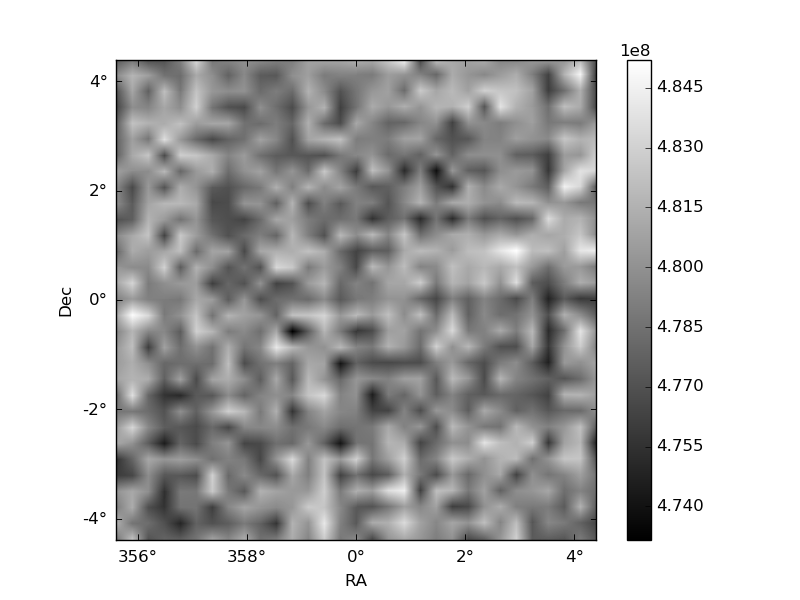
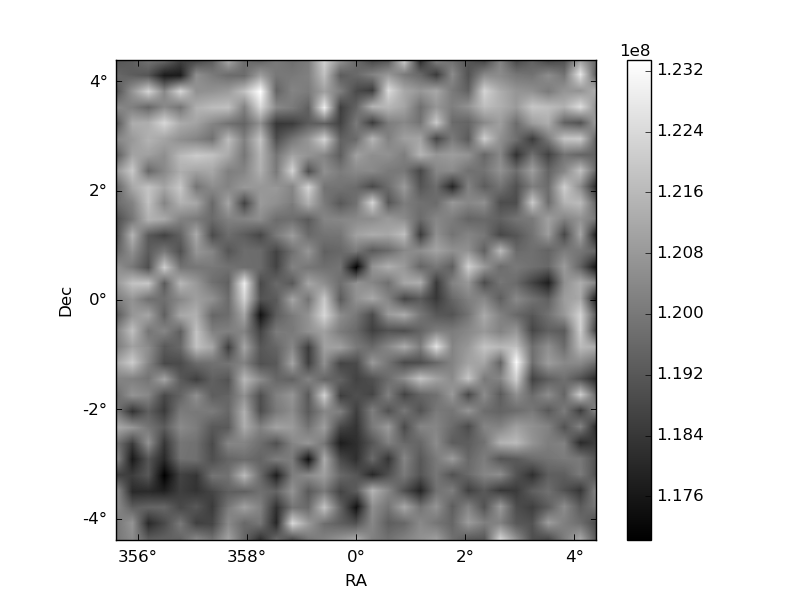
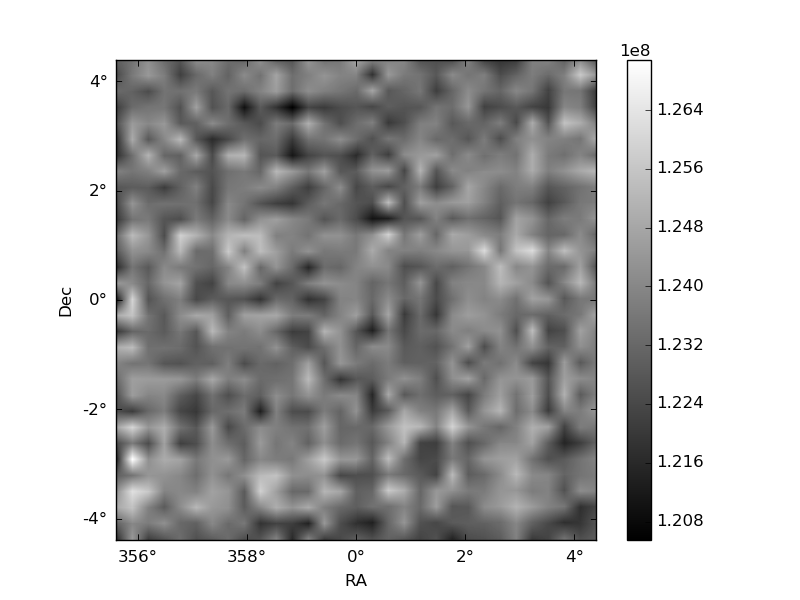
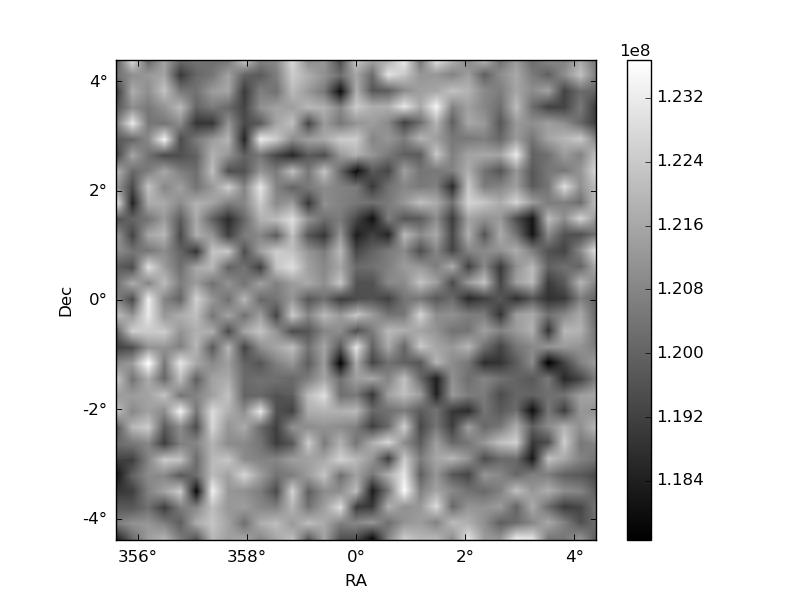
Histogram calculated using DETX and DETY for each event in the final _common_clean file
| Quadrant A | 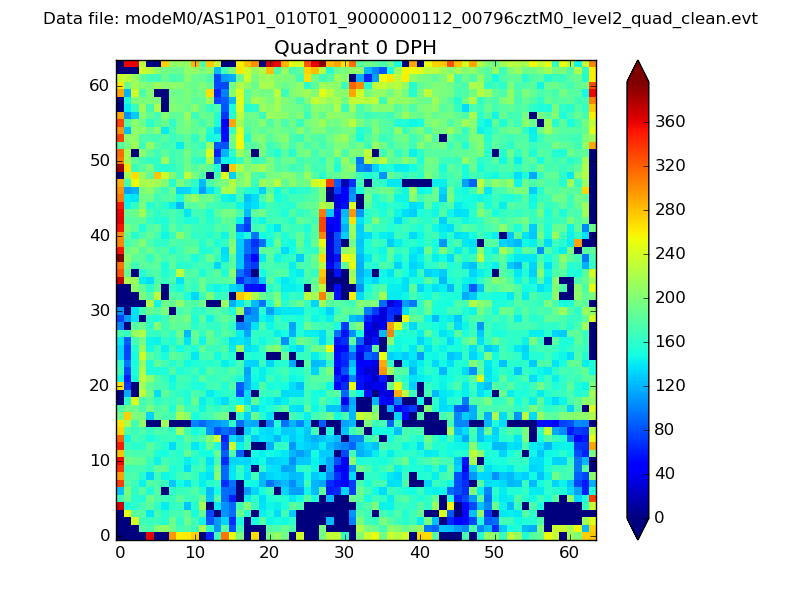 |
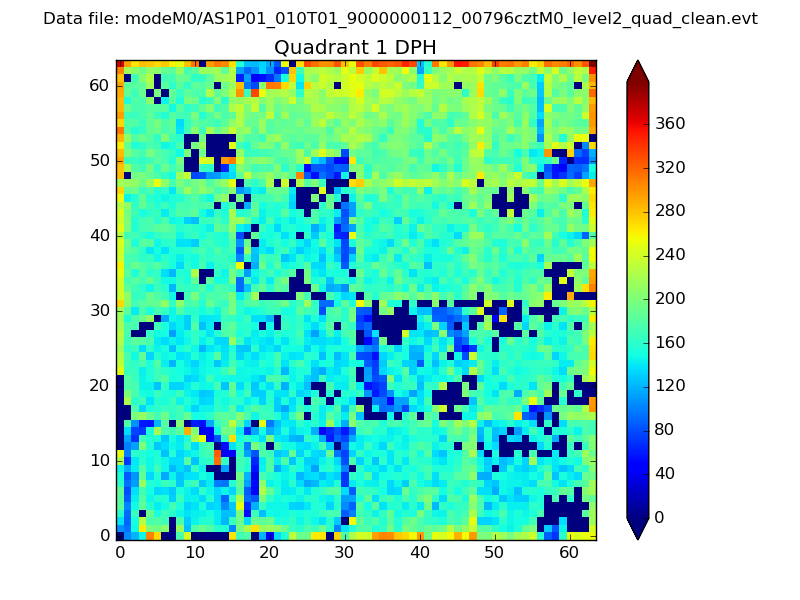 |
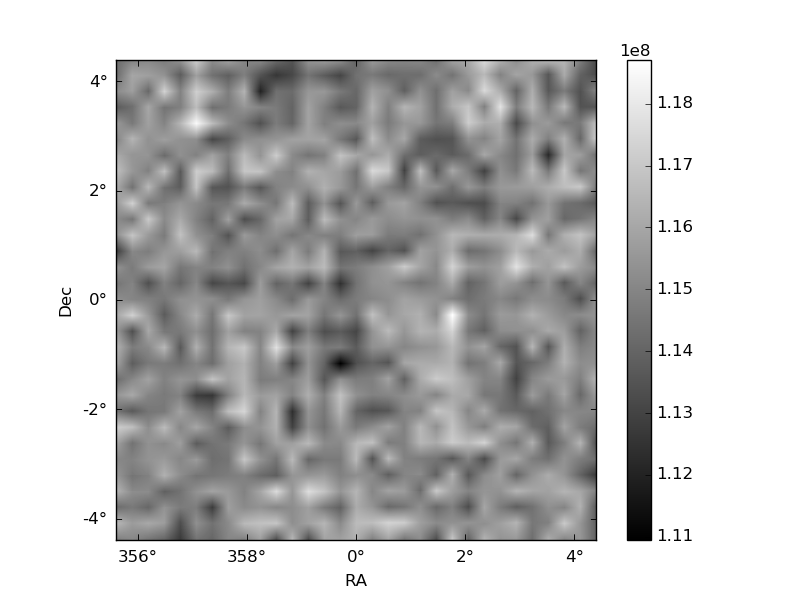
Quadrant B |
|---|---|---|---|
| Quadrant D | 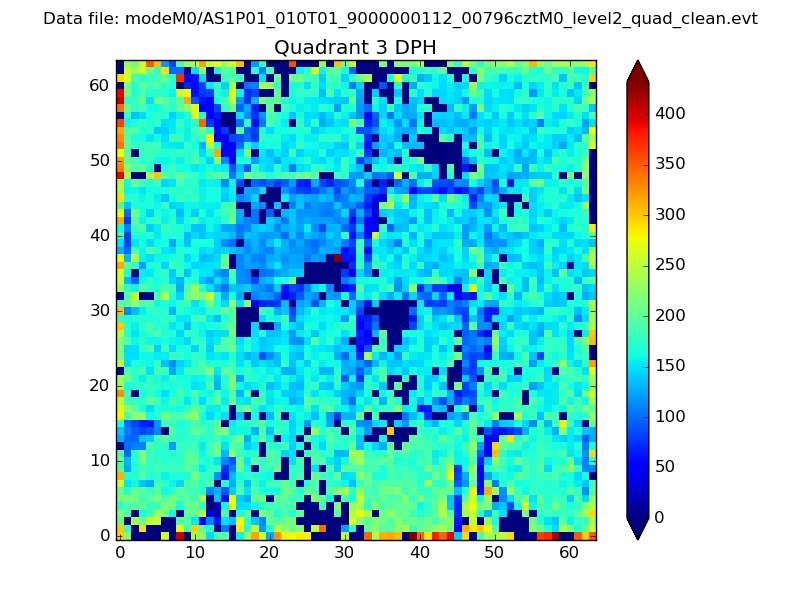 |
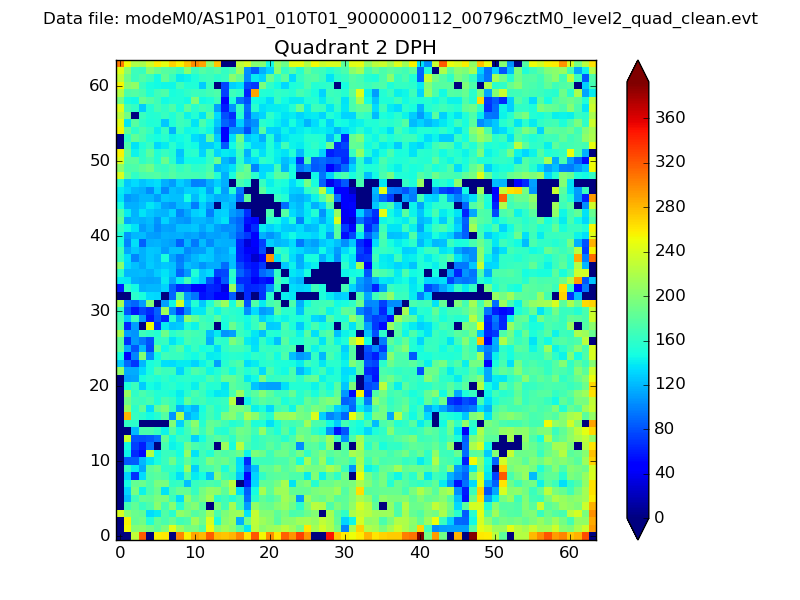 |
Quadrant C |
| Plot type | Count rate plots | Images |
|---|---|---|
| Comparison with Poisson distribution Blue bars denote a histogram of data divided into 1 sec bins. Red curve is a Poisson curve with rate = median count rate of data. |
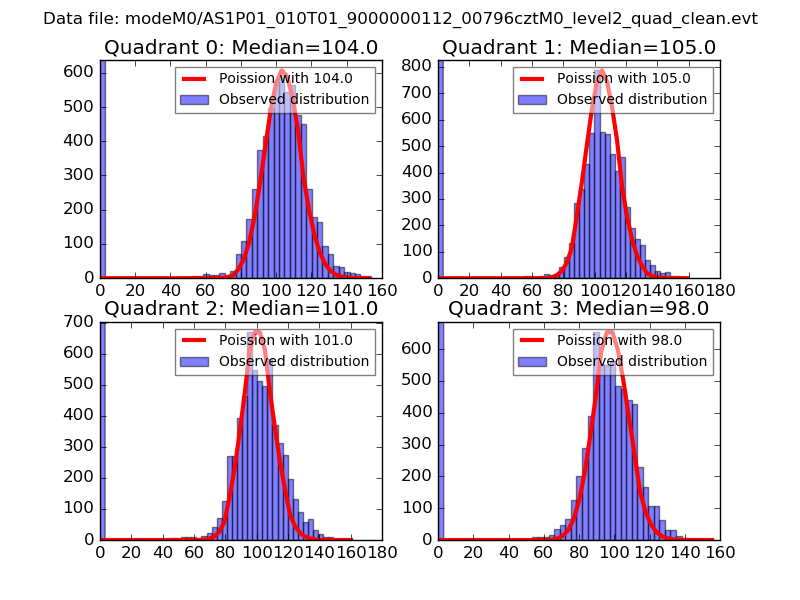 |
 |
| Quadrant-wise count rates Data is divided into 100 sec bins |
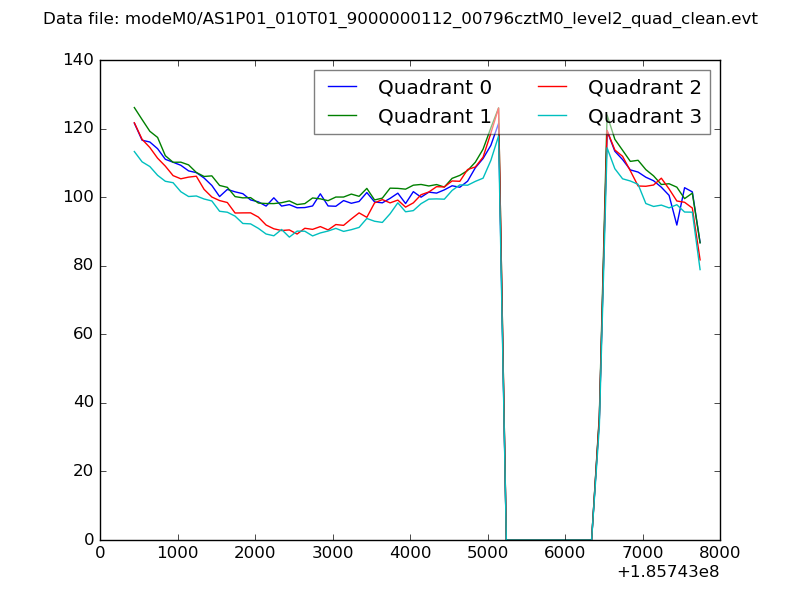 |
|
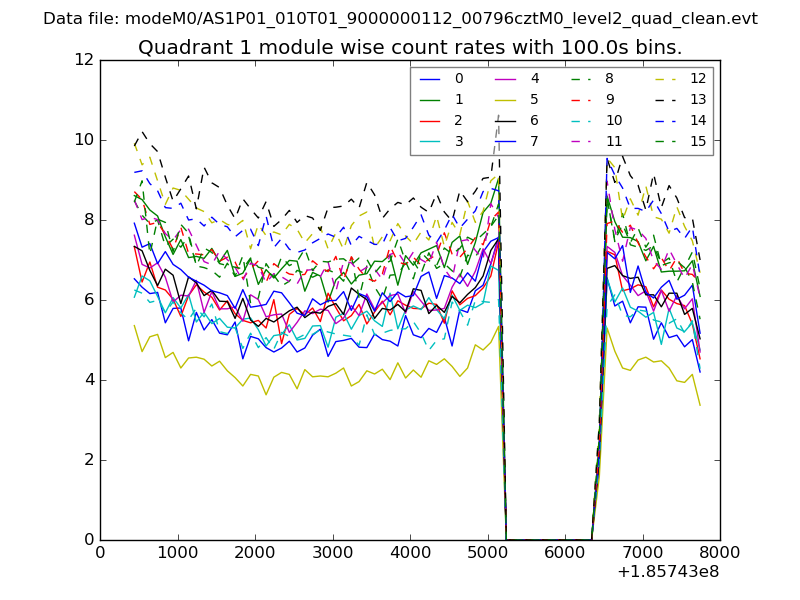
| Module-wise count rates for Quadrant A Data is divided into 100 sec bins |
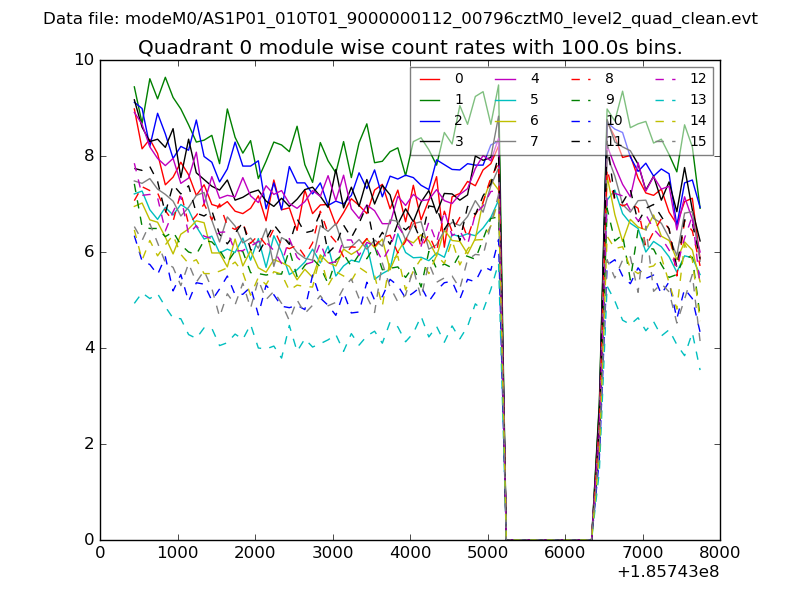 |
 |
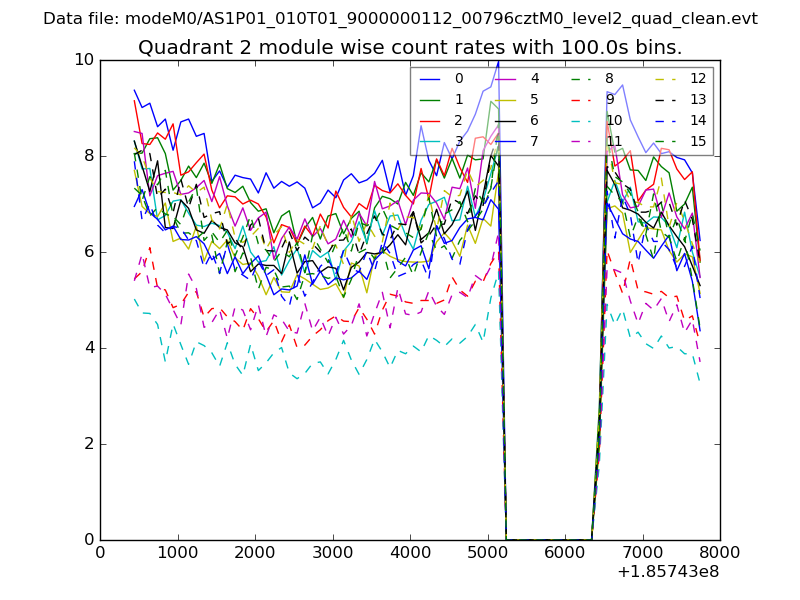
| Module-wise count rates for Quadrant B Data is divided into 100 sec bins |
 |
 |
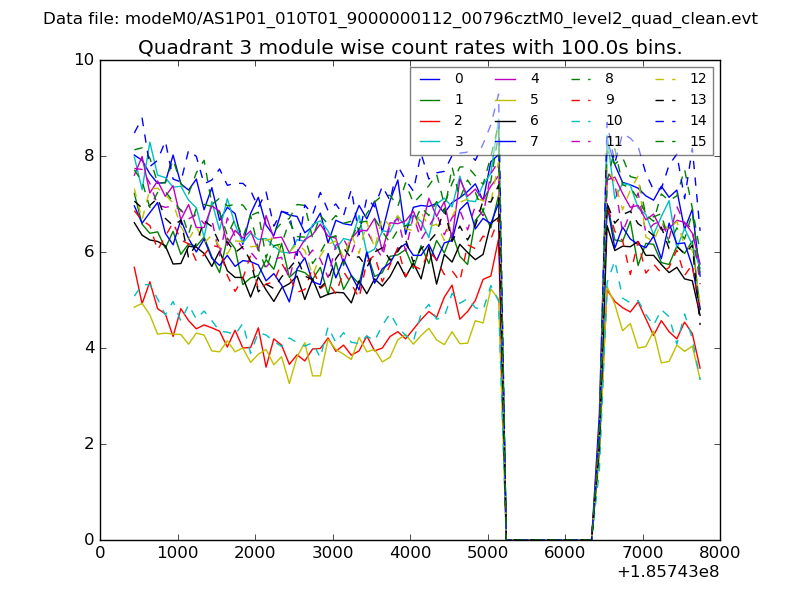
| Module-wise count rates for Quadrant C Data is divided into 100 sec bins |
 |
 |
| Module-wise count rates for Quadrant D Data is divided into 100 sec bins |
 |
 |
| Parameter | Plot |
|---|---|
| CZT HV Monitor | 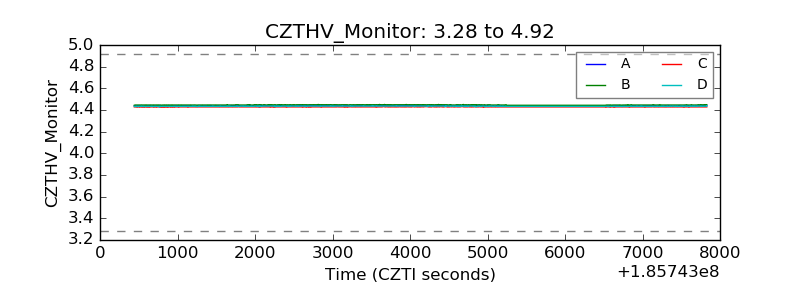 |
| D_VDD | 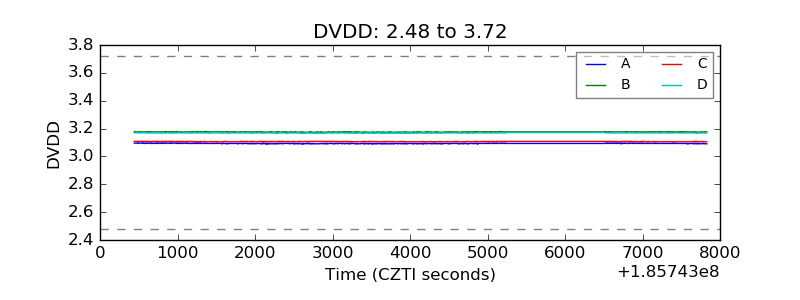 |
| Temperature 1 | 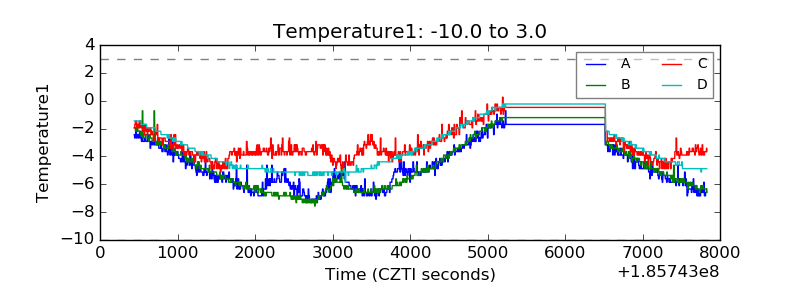 |
| Veto HV Monitor | 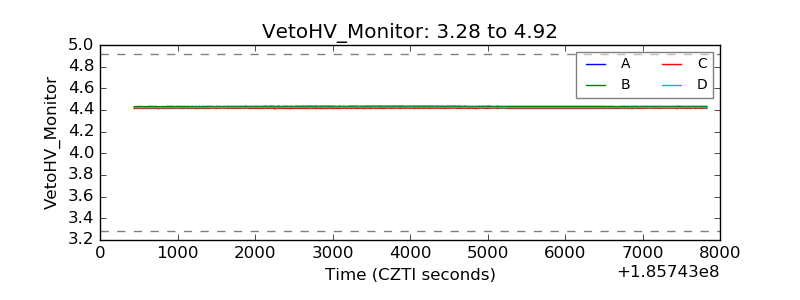 |
| Veto LLD |  |
| Alpha Counter | 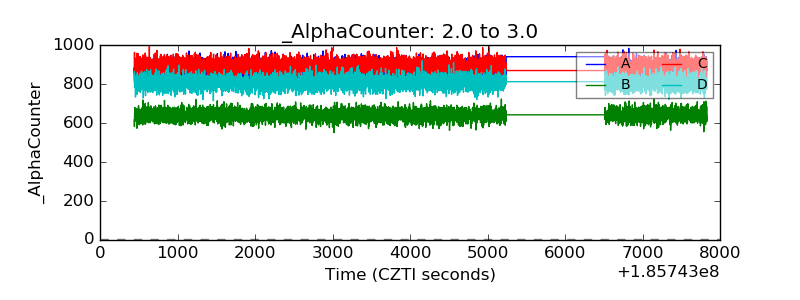 |
| _CPM_Rate | 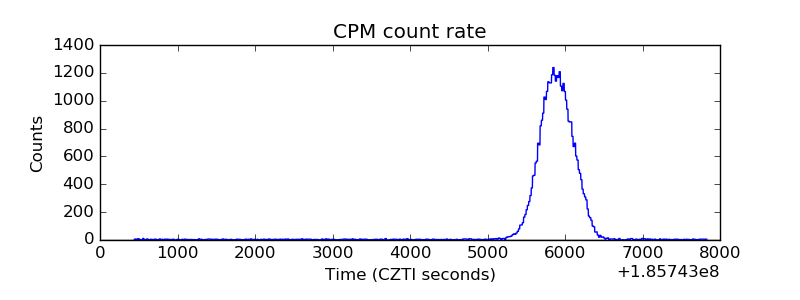 |
| CZT Counter | 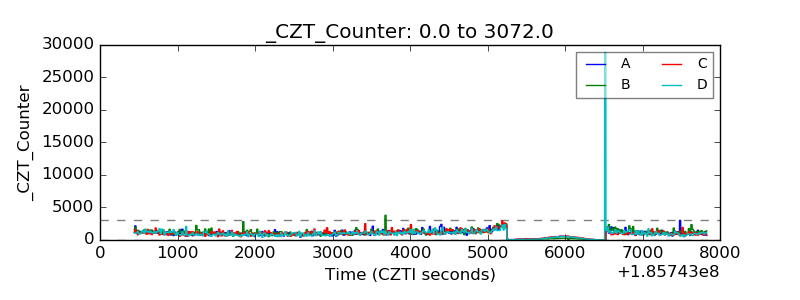 |
| +2.5 Volts monitor | 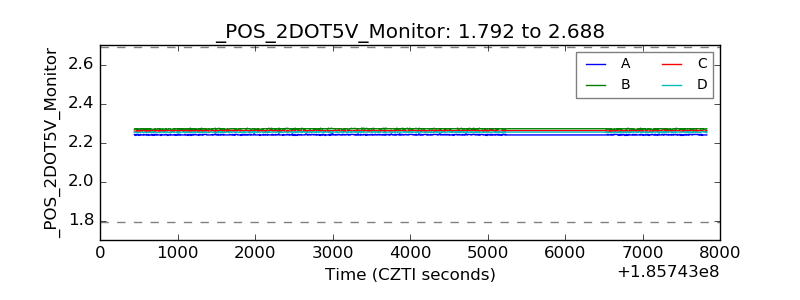 |
| +5 Volts monitor |  |
| _ROLL_ROT | 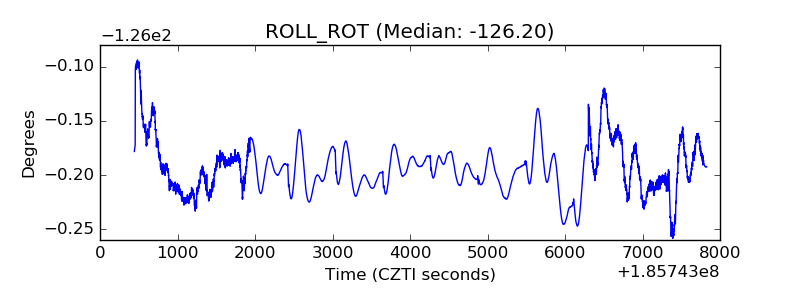 |
| _Roll_DEC | 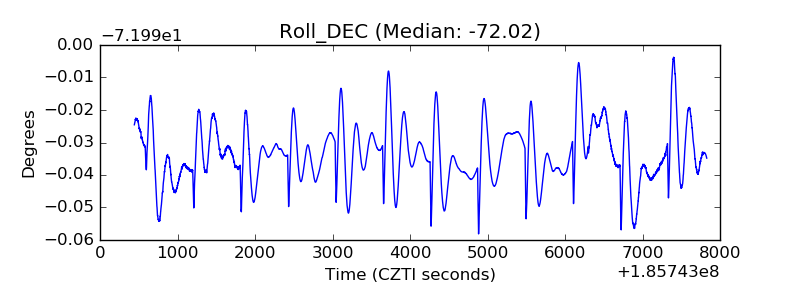 |
| _Roll_RA | 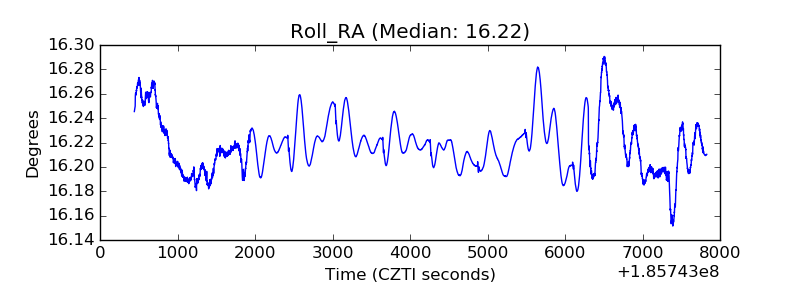 |
| Veto Counter | 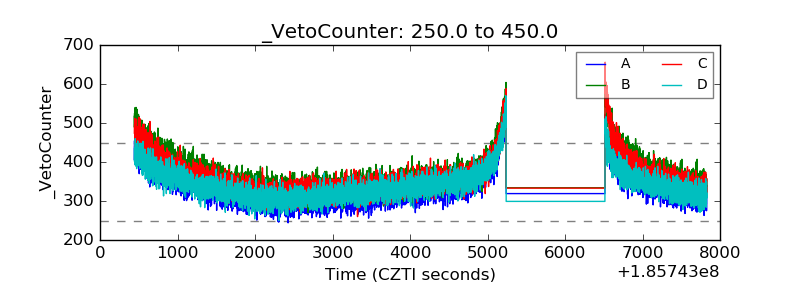 |