| Param | Original file | Final file |
|---|---|---|
| Filename | modeM0/AS1P01_010T01_9000000112_00797cztM0_level2.evt | modeM0/AS1P01_010T01_9000000112_00797cztM0_level2_quad_clean.evt |
| Size (bytes) | 969,770,880 | 97,871,040 |
| Size | 924.8 MB | 93.3 MB |
| Events in quadrant A | 7,292,500 | 637,187 |
| Events in quadrant B | 7,843,645 | 650,224 |
| Events in quadrant C | 7,121,947 | 626,565 |
| Events in quadrant D | 6,691,093 | 608,517 |
| Mode M9 | |||
|---|---|---|---|
| Quadrant | BADHDUFLAG | Total packets | Discarded packets |
| A | 0 | 12 | 0 |
| B | 0 | 12 | 0 |
| C | 0 | 12 | 0 |
| D | 0 | 12 | 0 |
| Mode M0 | |||
|---|---|---|---|
| Quadrant | BADHDUFLAG | Total packets | Discarded packets |
| A | 0 | 26191 | 0 |
| B | 0 | 27814 | 0 |
| C | 0 | 25597 | 0 |
| D | 0 | 24385 | 0 |
| Mode SS | |||
|---|---|---|---|
| Quadrant | BADHDUFLAG | Total packets | Discarded packets |
| A | 0 | 130 | 0 |
| B | 0 | 130 | 0 |
| C | 0 | 130 | 0 |
| D | 0 | 130 | 0 |
| Quadrant | Total seconds | Saturated seconds | Saturation percentage |
|---|---|---|---|
| A | 6322 | 44 | 0.695982% |
| B | 6322 | 15 | 0.237267% |
| C | 6322 | 5 | 0.079089% |
| D | 6322 | 14 | 0.221449% |
Noise dominated data is calculated using 1-second bins in cleaned event files. If a bin has >2000 counts, and if more than 50% of those come from <1% of pixels, then it is considered to be noise-dominated and hence unusable.
| Quadrant | # 1 sec bins | Bins with >0 counts | Bins with >2000 counts | High rate bins dominated by noise | Noise dominated (total time) | Noise dominated (detector-on time) | Marked lightcurve |
|---|---|---|---|---|---|---|---|
| A | 7502 | 6323 | 231 | 231 | 3.08% | 3.65% | 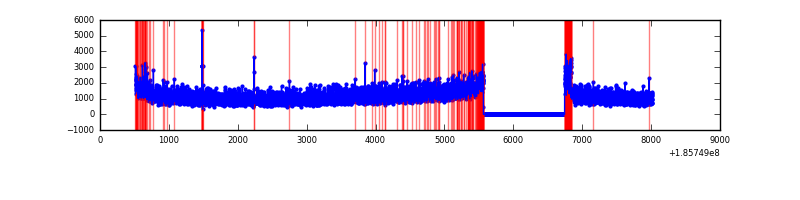 |
| B | 7502 | 6323 | 281 | 281 | 3.75% | 4.44% | 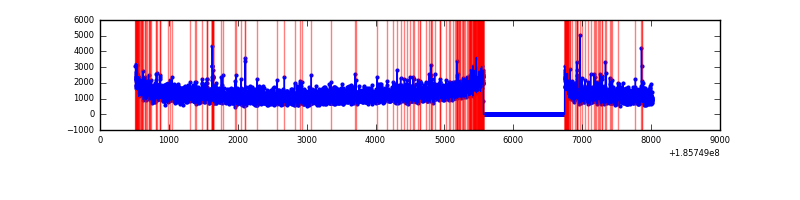 |
| C | 7502 | 6323 | 114 | 114 | 1.52% | 1.80% |  |
| D | 7502 | 6323 | 96 | 96 | 1.28% | 1.52% | 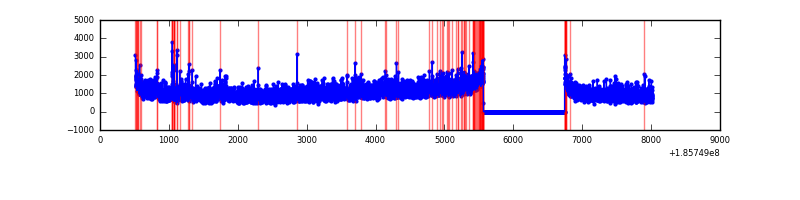 |
Top three noisy pixels from each quadrant. If the there are fewer than three noisy pixels in the level2.evt file, extra rows are filled as -1
| Pixel properties | Quadrant properties | ||||||
|---|---|---|---|---|---|---|---|
| Quadrant | DetID | PixID | Counts | Sigma | Mean | Median | Sigma |
| A | 15 | 233 | 95248 | 208.98 | 1854 | 1867 | 446.8 |
| A | 15 | 171 | 40451 | 86.35 | 1854 | 1867 | 446.8 |
| A | 12 | 243 | 35847 | 76.05 | 1854 | 1867 | 446.8 |
| B | 0 | 23 | 154653 | 331.44 | 1977 | 1981 | 460.6 |
| B | 15 | 22 | 54639 | 114.32 | 1977 | 1981 | 460.6 |
| B | 5 | 191 | 37254 | 76.58 | 1977 | 1981 | 460.6 |
| C | 15 | 241 | 43086 | 83.76 | 1785 | 1846 | 492.4 |
| C | 9 | 52 | 41103 | 79.73 | 1785 | 1846 | 492.4 |
| C | 3 | 111 | 25992 | 49.04 | 1785 | 1846 | 492.4 |
| D | 1 | 4 | 168634 | 318.65 | 1700 | 1759 | 523.7 |
| D | 2 | 225 | 42125 | 77.08 | 1700 | 1759 | 523.7 |
| D | 13 | 25 | 36150 | 65.67 | 1700 | 1759 | 523.7 |
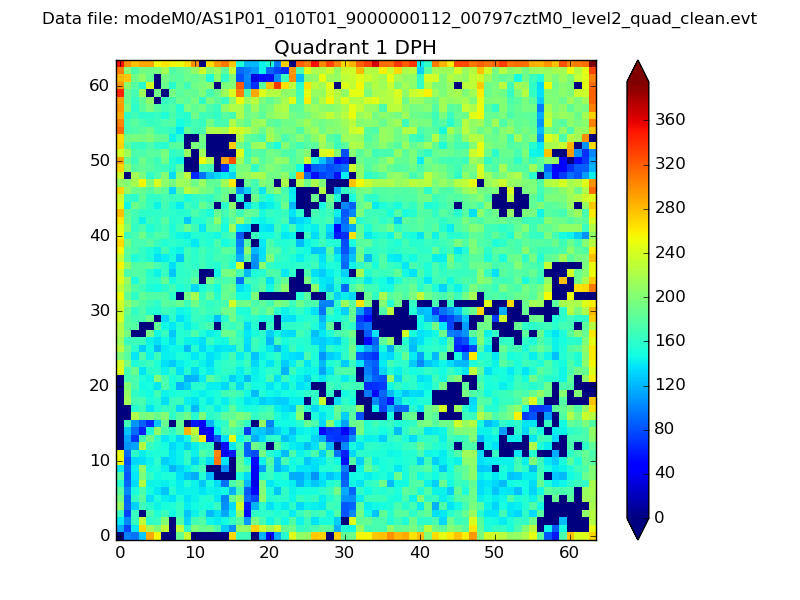
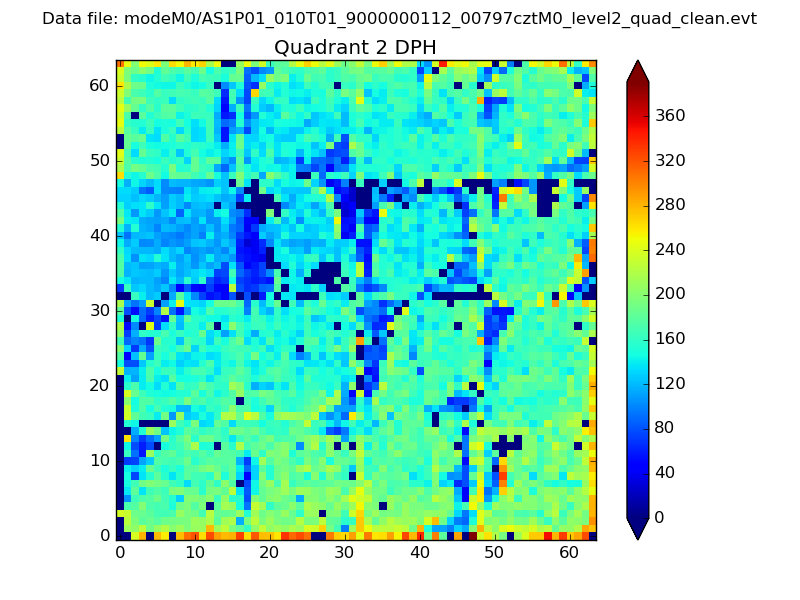
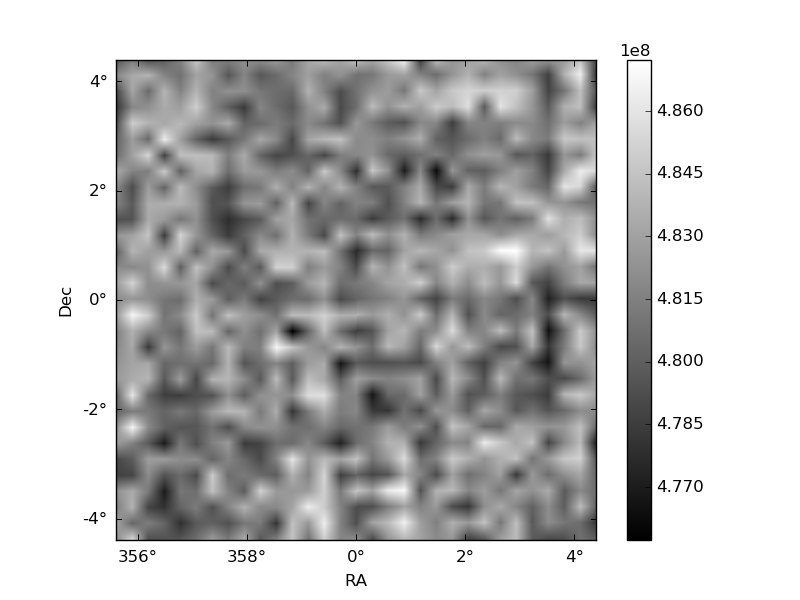
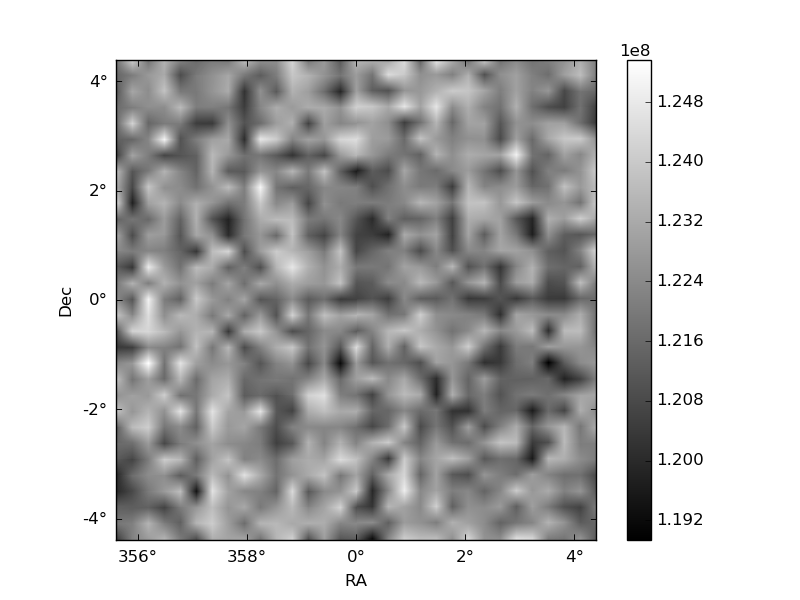
Histogram calculated using DETX and DETY for each event in the final _common_clean file
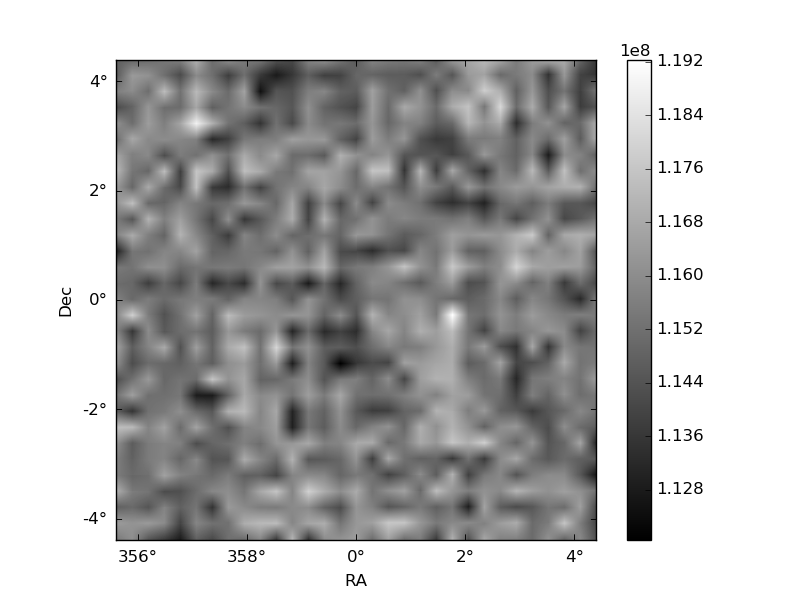
| Quadrant A | 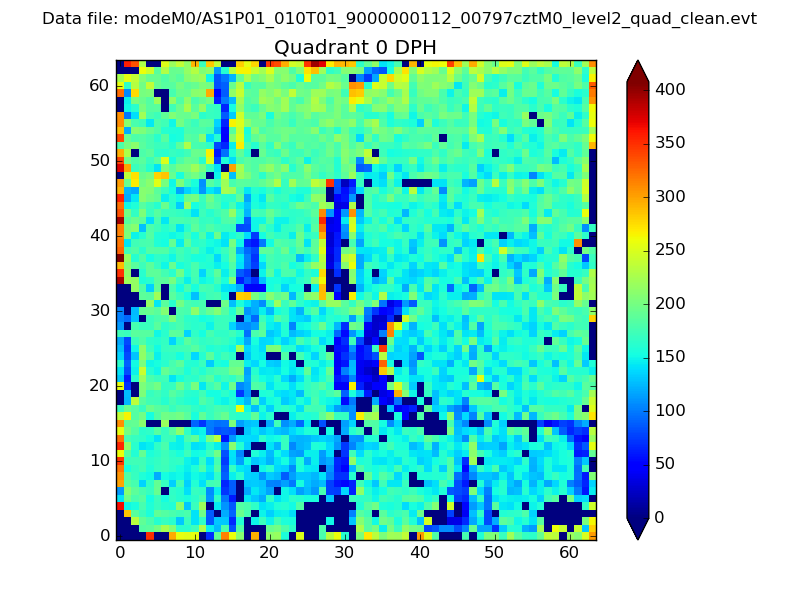 |
 |
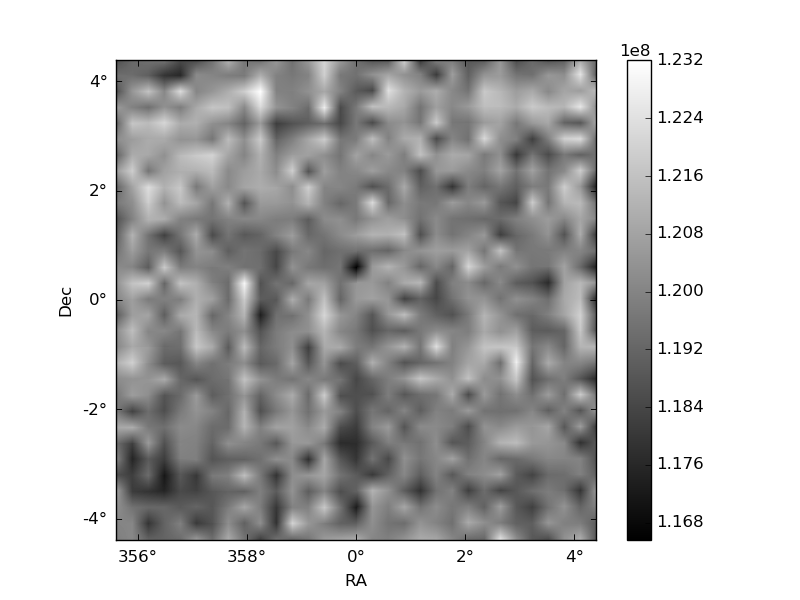
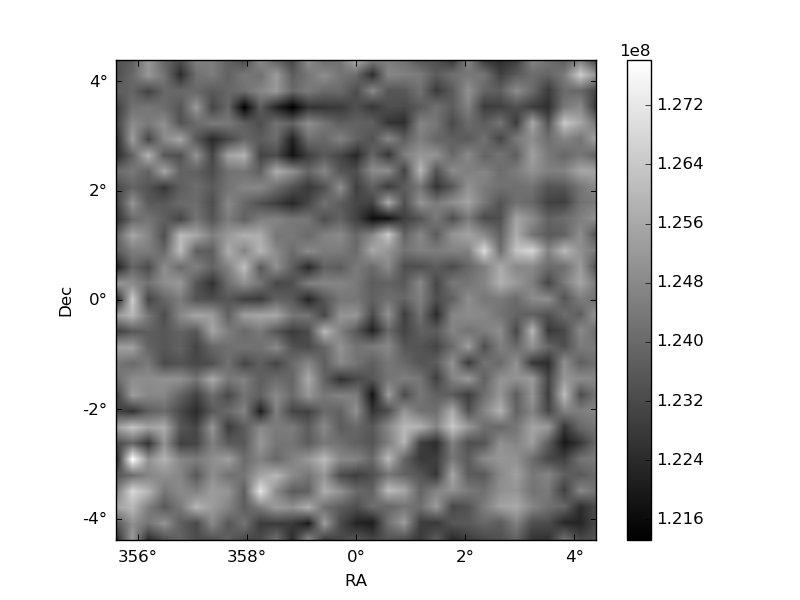
Quadrant B |
|---|---|---|---|
| Quadrant D | 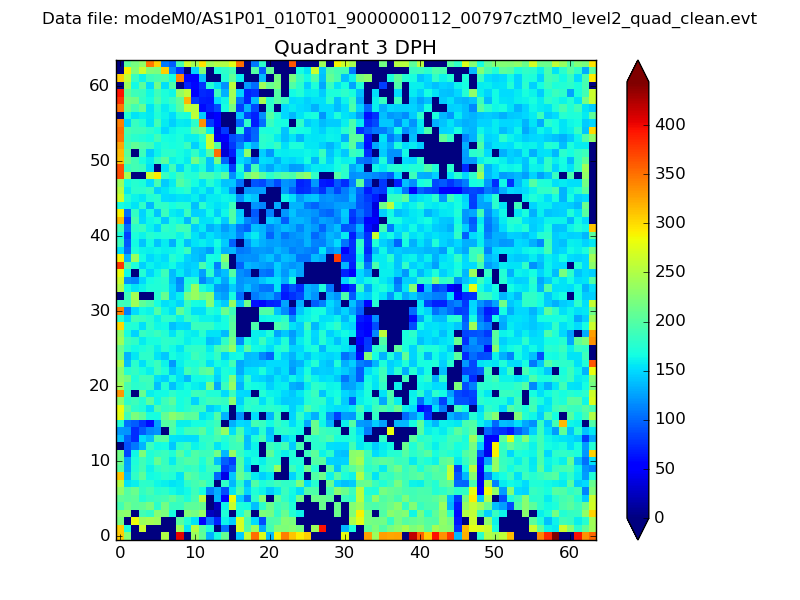 |
 |
Quadrant C |
| Plot type | Count rate plots | Images |
|---|---|---|
| Comparison with Poisson distribution Blue bars denote a histogram of data divided into 1 sec bins. Red curve is a Poisson curve with rate = median count rate of data. |
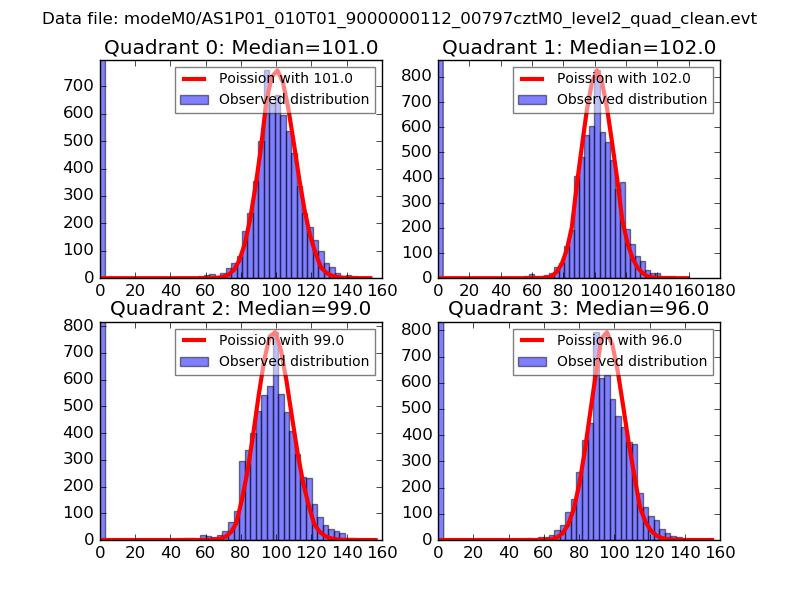 |
 |
| Quadrant-wise count rates Data is divided into 100 sec bins |
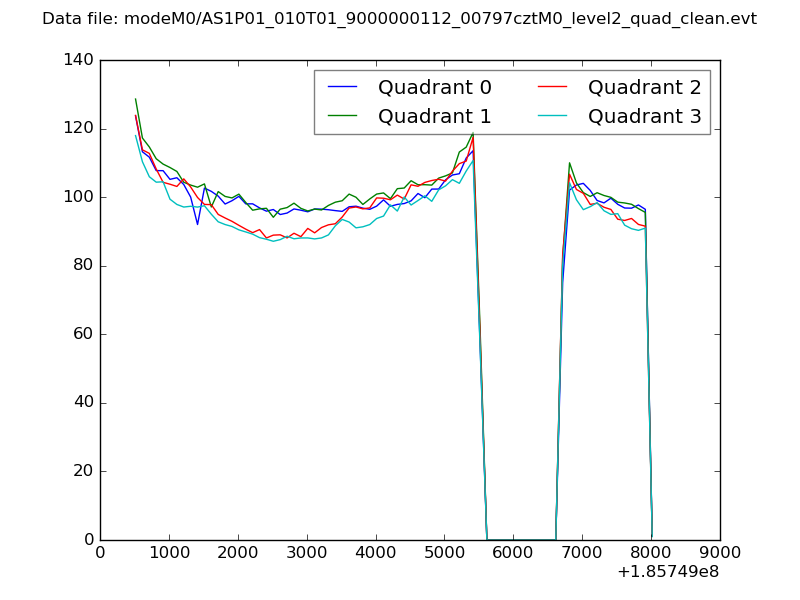 |
|
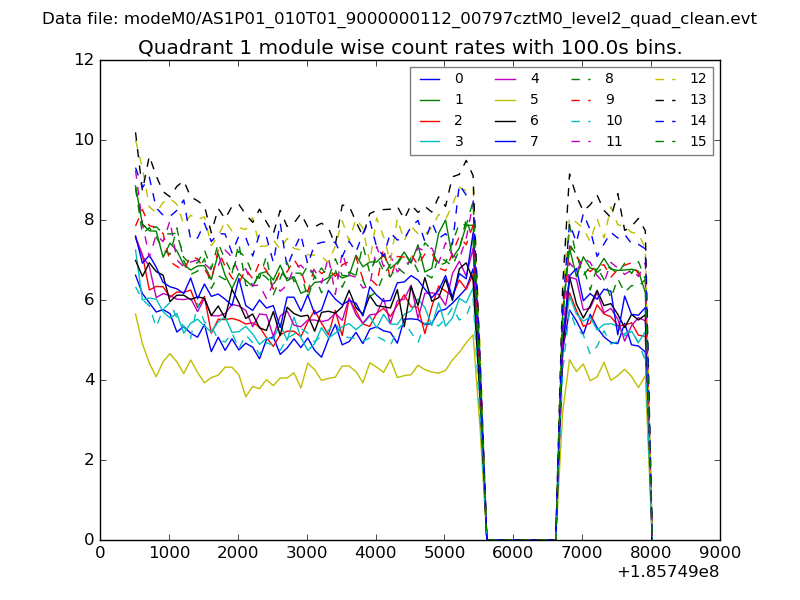
| Module-wise count rates for Quadrant A Data is divided into 100 sec bins |
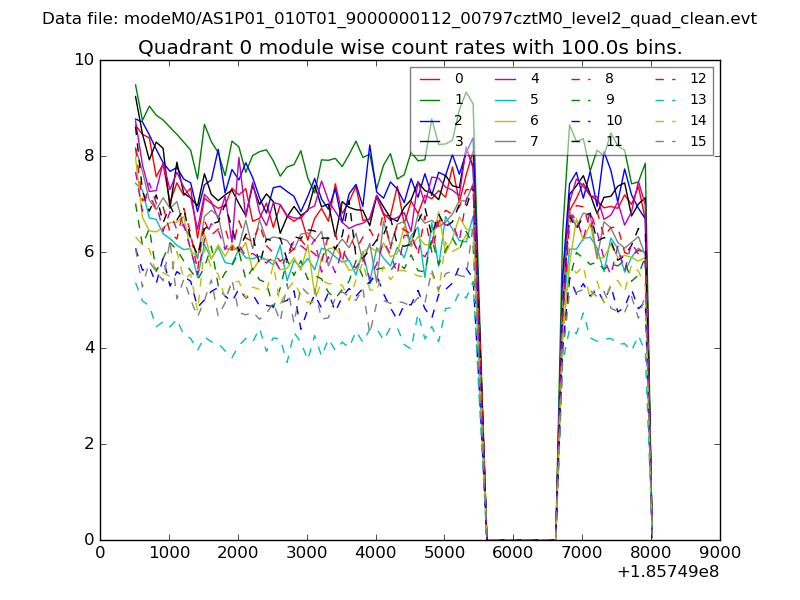 |
 |
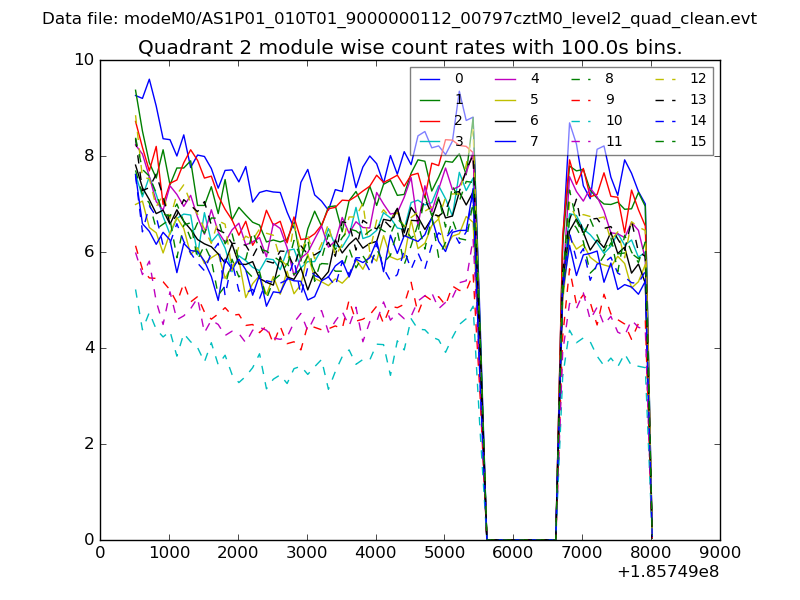
| Module-wise count rates for Quadrant B Data is divided into 100 sec bins |
 |
 |
| Module-wise count rates for Quadrant C Data is divided into 100 sec bins |
 |
 |
| Module-wise count rates for Quadrant D Data is divided into 100 sec bins |
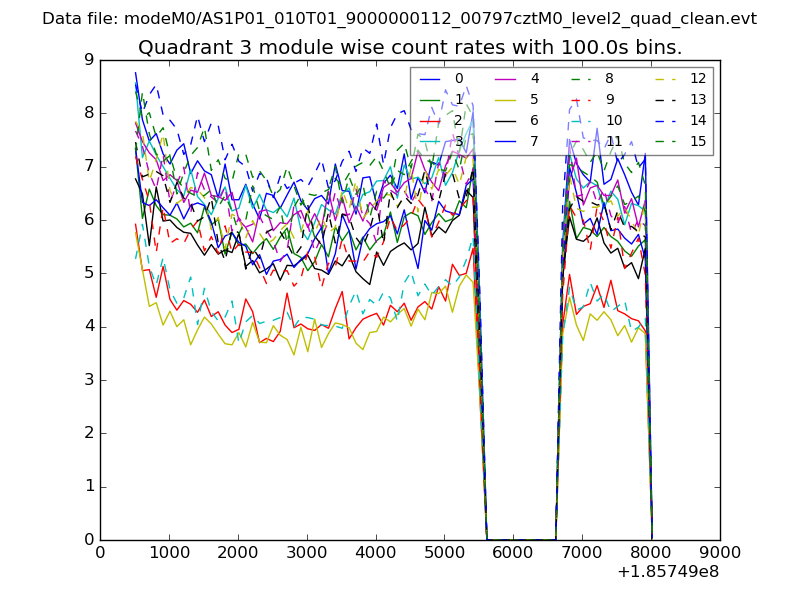 |
 |
| Parameter | Plot |
|---|---|
| CZT HV Monitor | 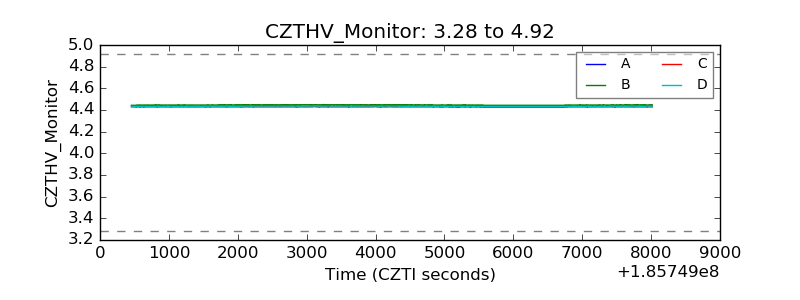 |
| D_VDD | 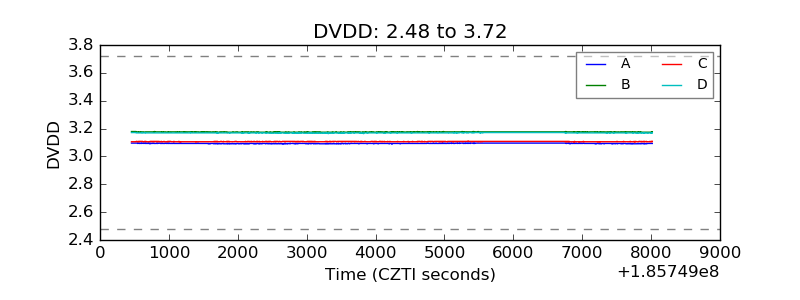 |
| Temperature 1 | 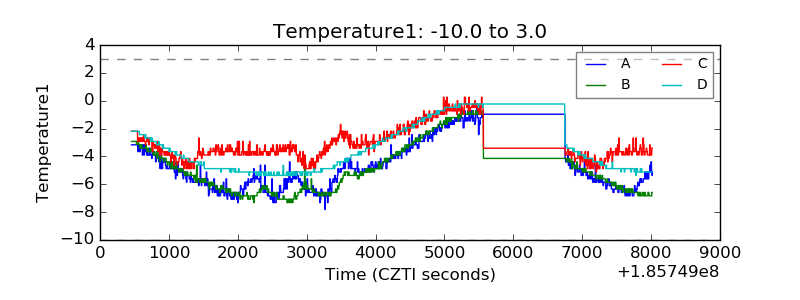 |
| Veto HV Monitor |  |
| Veto LLD | 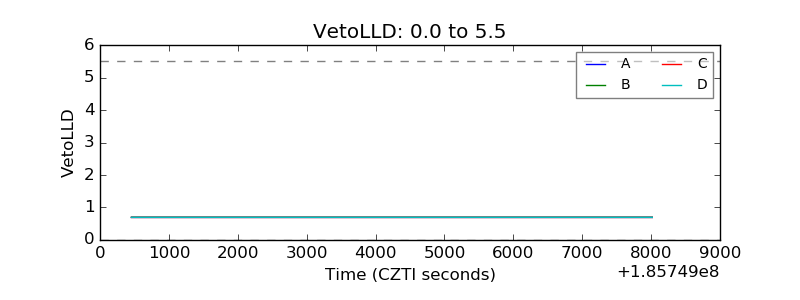 |
| Alpha Counter | 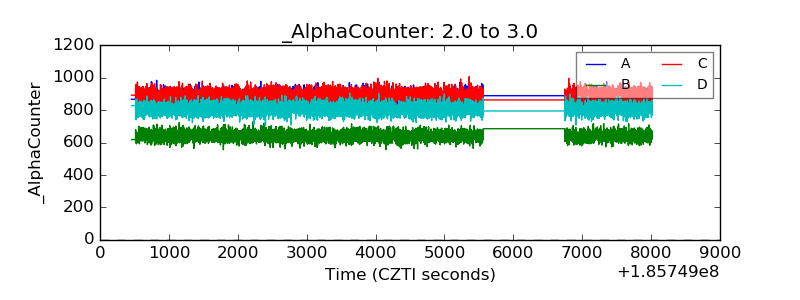 |
| _CPM_Rate | 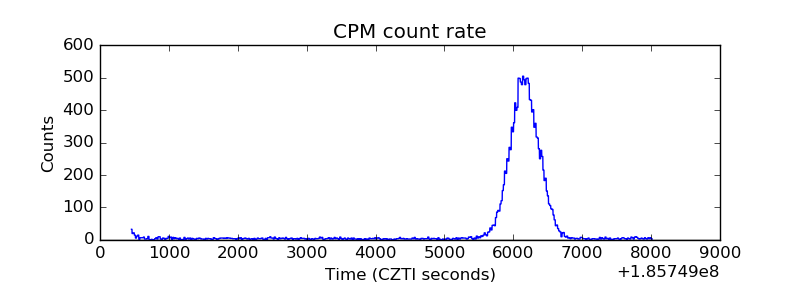 |
| CZT Counter | 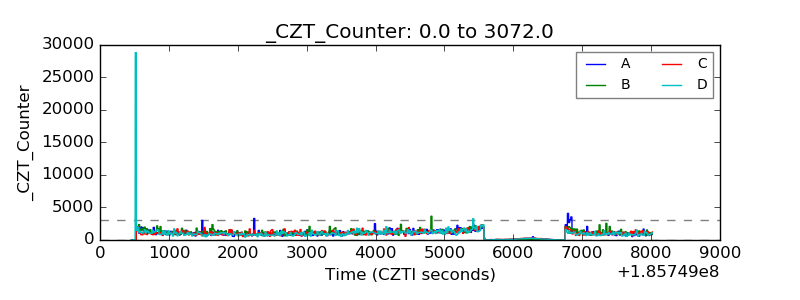 |
| +2.5 Volts monitor |  |
| +5 Volts monitor |  |
| _ROLL_ROT | 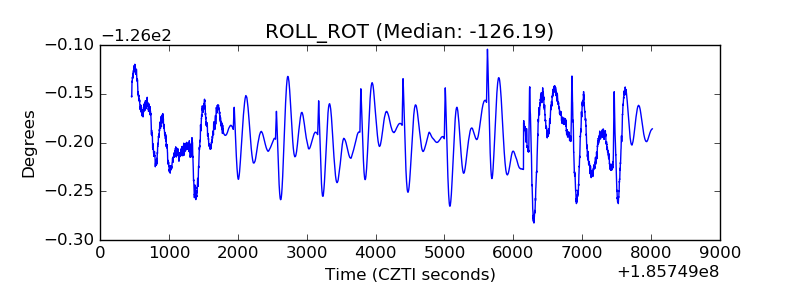 |
| _Roll_DEC |  |
| _Roll_RA | 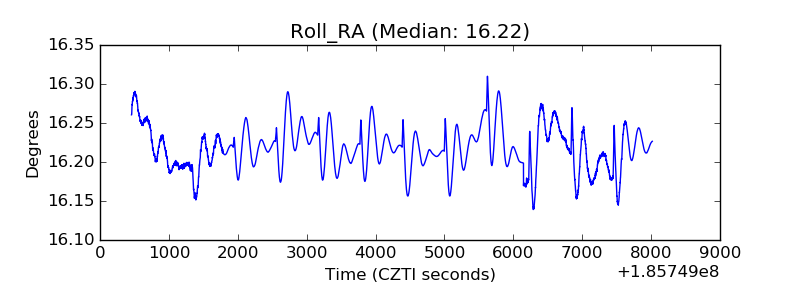 |
| Veto Counter | 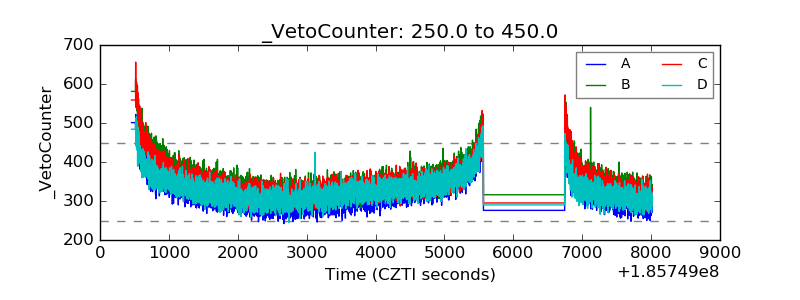 |