| Param | Original file | Final file |
|---|---|---|
| Filename | modeM0/AS1P01_010T01_9000000112_00799cztM0_level2.evt | modeM0/AS1P01_010T01_9000000112_00799cztM0_level2_quad_clean.evt |
| Size (bytes) | 1,094,705,280 | 102,576,960 |
| Size | 1.0 GB | 97.8 MB |
| Events in quadrant A | 8,148,742 | 667,763 |
| Events in quadrant B | 8,610,198 | 673,903 |
| Events in quadrant C | 8,050,861 | 649,483 |
| Events in quadrant D | 7,880,919 | 629,889 |
| Mode M9 | |||
|---|---|---|---|
| Quadrant | BADHDUFLAG | Total packets | Discarded packets |
| A | 0 | 4 | 0 |
| B | 0 | 4 | 0 |
| C | 0 | 4 | 0 |
| D | 0 | 4 | 0 |
| Mode M0 | |||
|---|---|---|---|
| Quadrant | BADHDUFLAG | Total packets | Discarded packets |
| A | 0 | 29162 | 0 |
| B | 0 | 30503 | 0 |
| C | 0 | 28880 | 0 |
| D | 0 | 28382 | 0 |
| Mode SS | |||
|---|---|---|---|
| Quadrant | BADHDUFLAG | Total packets | Discarded packets |
| A | 0 | 140 | 0 |
| B | 0 | 140 | 0 |
| C | 0 | 140 | 0 |
| D | 0 | 140 | 0 |
| Quadrant | Total seconds | Saturated seconds | Saturation percentage |
|---|---|---|---|
| A | 6975 | 42 | 0.602151% |
| B | 6975 | 81 | 1.161290% |
| C | 6975 | 39 | 0.559140% |
| D | 6974 | 142 | 2.036134% |
Noise dominated data is calculated using 1-second bins in cleaned event files. If a bin has >2000 counts, and if more than 50% of those come from <1% of pixels, then it is considered to be noise-dominated and hence unusable.
| Quadrant | # 1 sec bins | Bins with >0 counts | Bins with >2000 counts | High rate bins dominated by noise | Noise dominated (total time) | Noise dominated (detector-on time) | Marked lightcurve |
|---|---|---|---|---|---|---|---|
| A | 7335 | 6977 | 269 | 269 | 3.67% | 3.86% | 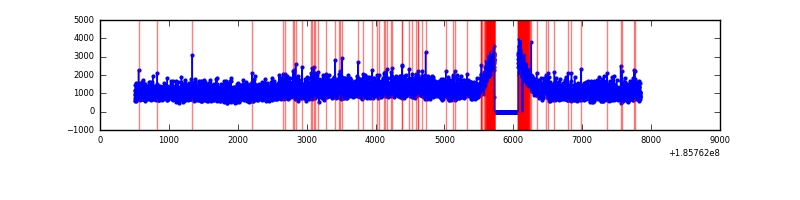 |
| B | 7335 | 6977 | 342 | 342 | 4.66% | 4.90% | 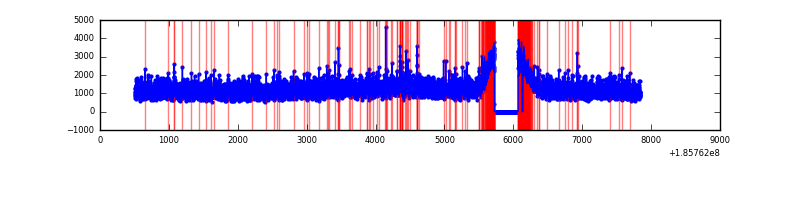 |
| C | 7335 | 6977 | 258 | 258 | 3.52% | 3.70% | 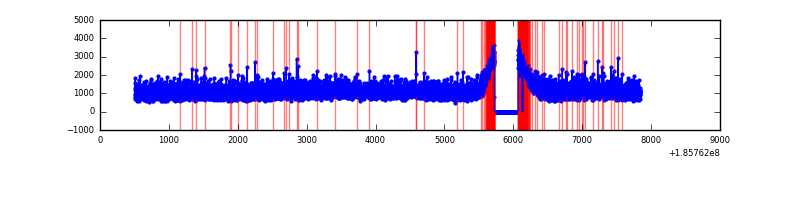 |
| D | 7334 | 6976 | 325 | 325 | 4.43% | 4.66% |  |
Top three noisy pixels from each quadrant. If the there are fewer than three noisy pixels in the level2.evt file, extra rows are filled as -1
| Pixel properties | Quadrant properties | ||||||
|---|---|---|---|---|---|---|---|
| Quadrant | DetID | PixID | Counts | Sigma | Mean | Median | Sigma |
| A | 15 | 171 | 26769 | 48.26 | 2115 | 2128 | 510.6 |
| A | 15 | 233 | 9608 | 14.65 | 2115 | 2128 | 510.6 |
| A | 11 | 79 | 8576 | 12.63 | 2115 | 2128 | 510.6 |
| B | 15 | 22 | 59764 | 110.14 | 2223 | 2225 | 522.4 |
| B | 0 | 23 | 24706 | 43.03 | 2223 | 2225 | 522.4 |
| B | 0 | 230 | 19536 | 33.14 | 2223 | 2225 | 522.4 |
| C | 15 | 241 | 50862 | 86.37 | 2028 | 2104 | 564.5 |
| C | 3 | 111 | 33515 | 55.64 | 2028 | 2104 | 564.5 |
| C | 3 | 79 | 28169 | 46.17 | 2028 | 2104 | 564.5 |
| D | 13 | 25 | 252632 | 423.78 | 1911 | 1978 | 591.5 |
| D | 13 | 164 | 190646 | 318.98 | 1911 | 1978 | 591.5 |
| D | 13 | 170 | 103893 | 172.31 | 1911 | 1978 | 591.5 |
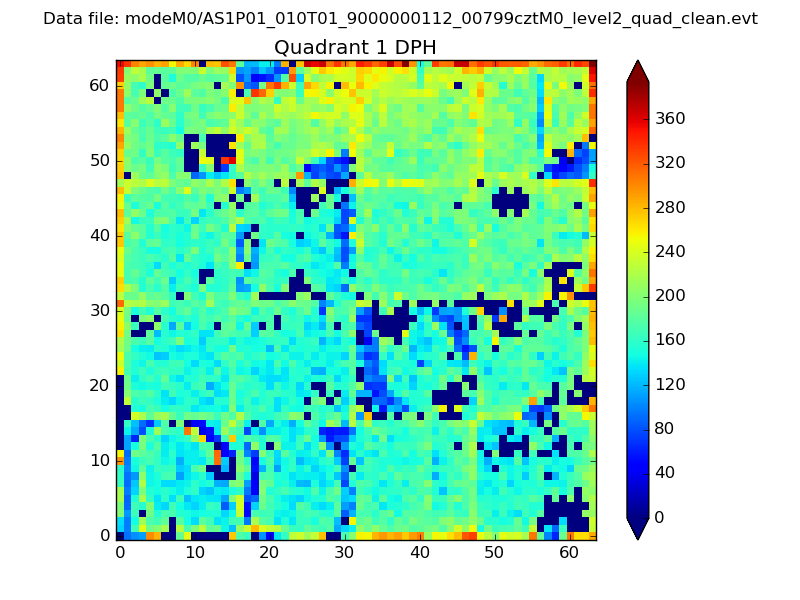
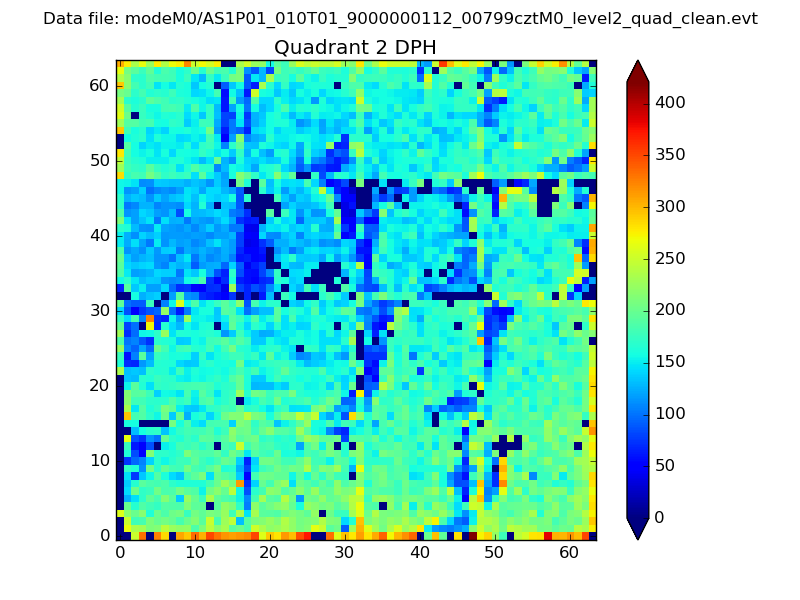
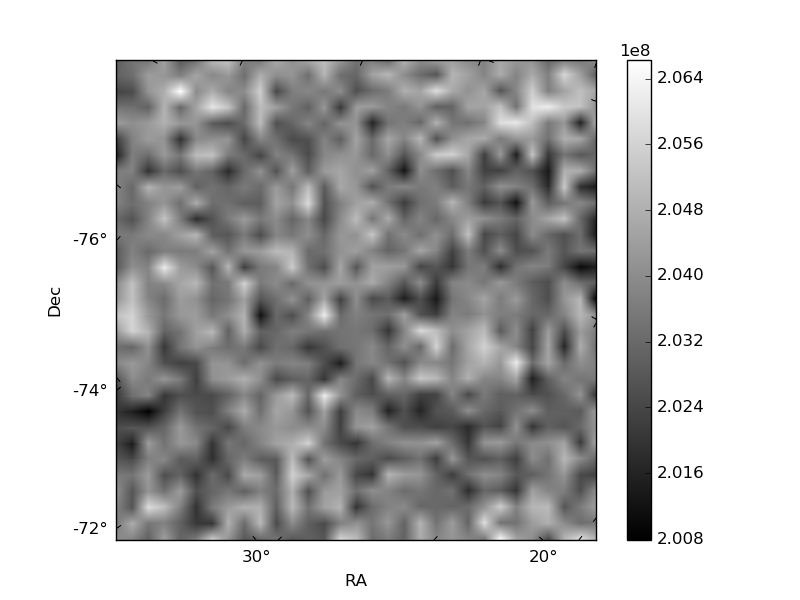
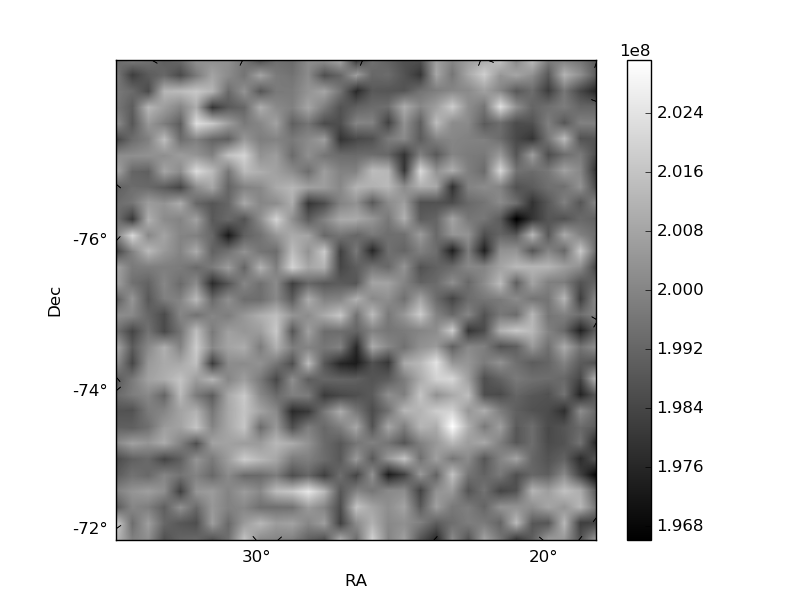
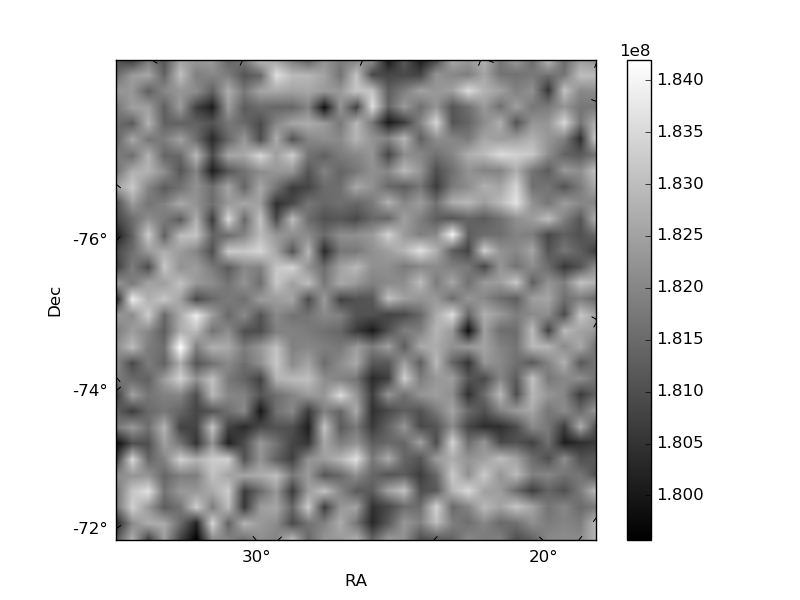
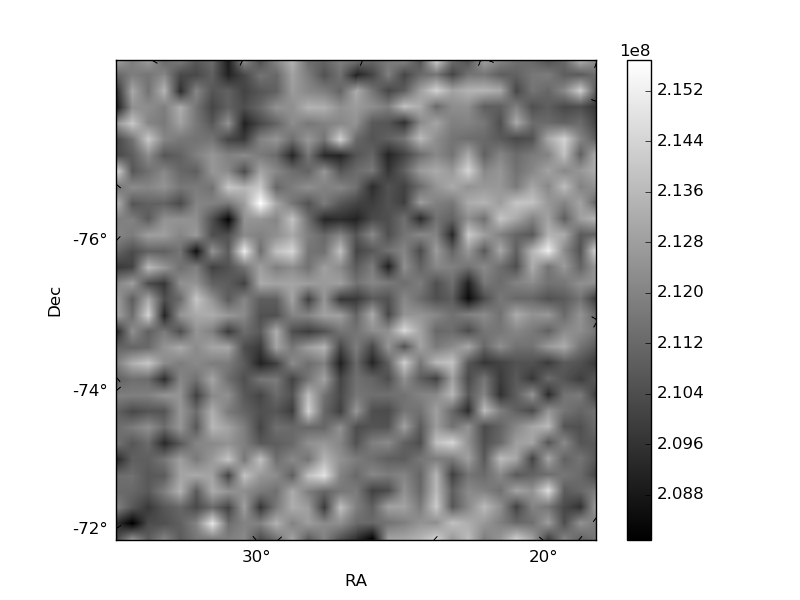
Histogram calculated using DETX and DETY for each event in the final _common_clean file
| Quadrant A | 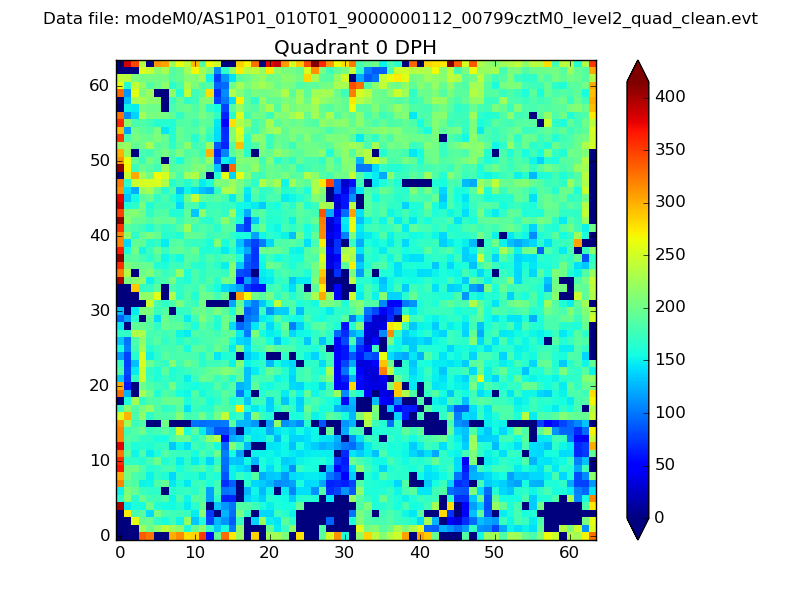 |
 |
Quadrant B |
|---|---|---|---|
| Quadrant D | 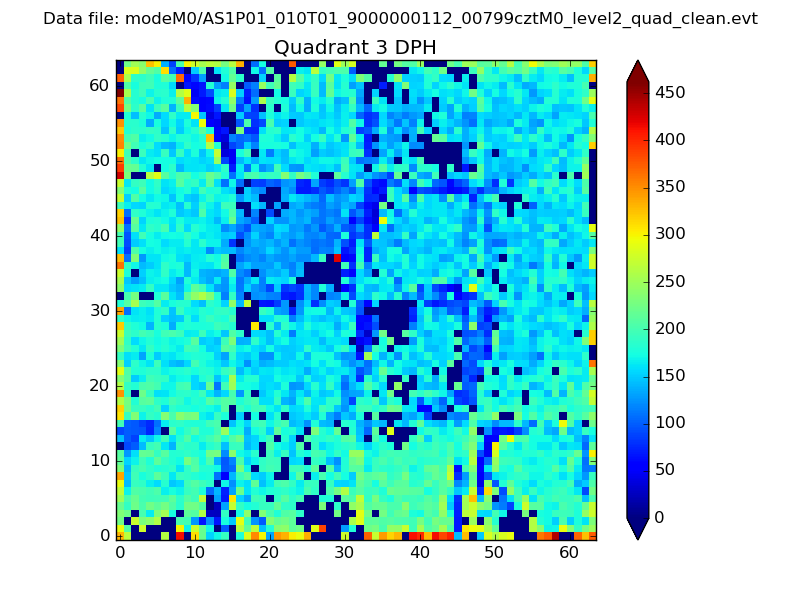 |
 |
Quadrant C |
| Plot type | Count rate plots | Images |
|---|---|---|
| Comparison with Poisson distribution Blue bars denote a histogram of data divided into 1 sec bins. Red curve is a Poisson curve with rate = median count rate of data. |
 |
 |
| Quadrant-wise count rates Data is divided into 100 sec bins |
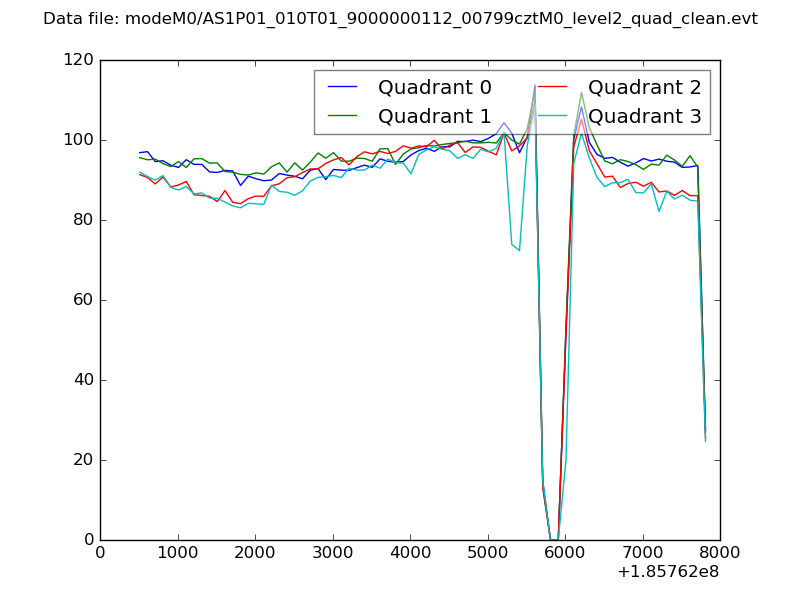 |
|
| Module-wise count rates for Quadrant A Data is divided into 100 sec bins |
 |
 |
| Module-wise count rates for Quadrant B Data is divided into 100 sec bins |
 |
 |
| Module-wise count rates for Quadrant C Data is divided into 100 sec bins |
 |
 |
| Module-wise count rates for Quadrant D Data is divided into 100 sec bins |
 |
 |
| Parameter | Plot |
|---|---|
| CZT HV Monitor |  |
| D_VDD | 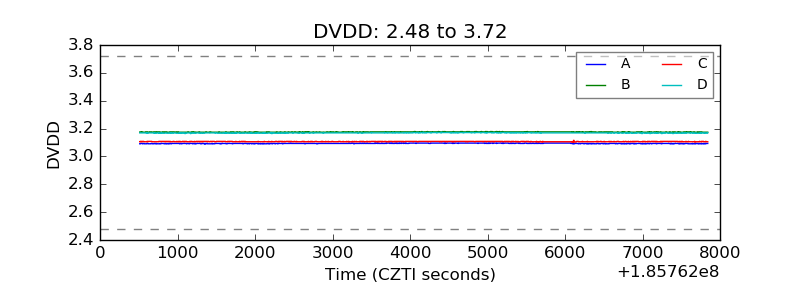 |
| Temperature 1 | 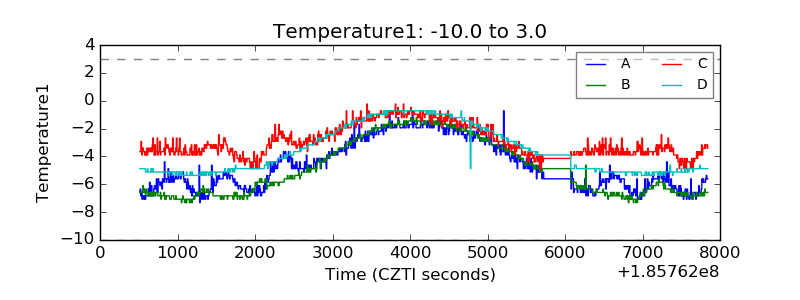 |
| Veto HV Monitor | 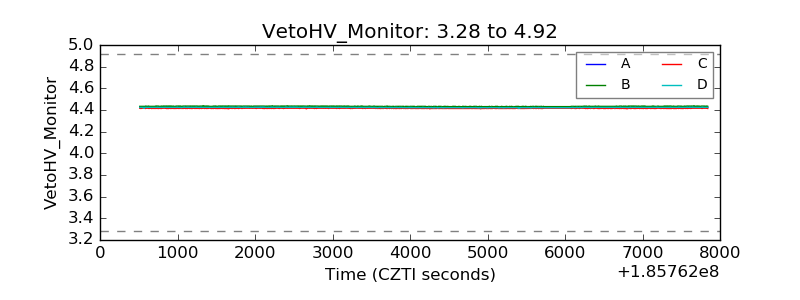 |
| Veto LLD |  |
| Alpha Counter |  |
| _CPM_Rate | 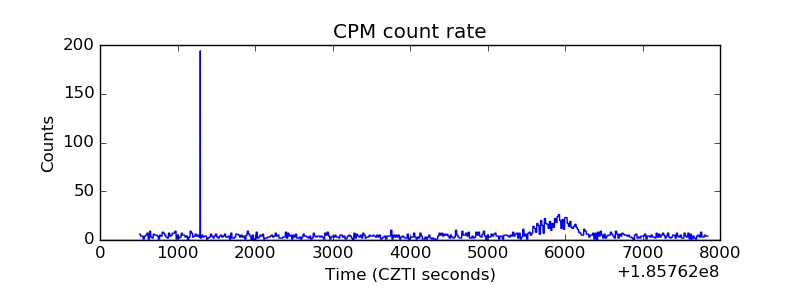 |
| CZT Counter | 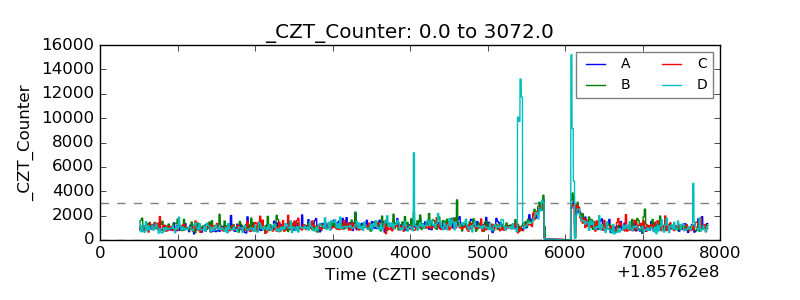 |
| +2.5 Volts monitor |  |
| +5 Volts monitor | 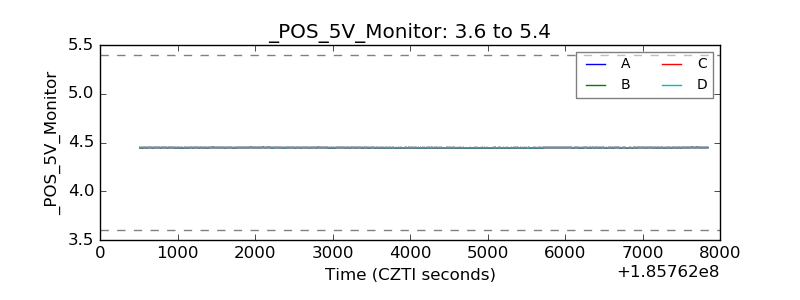 |
| _ROLL_ROT |  |
| _Roll_DEC | 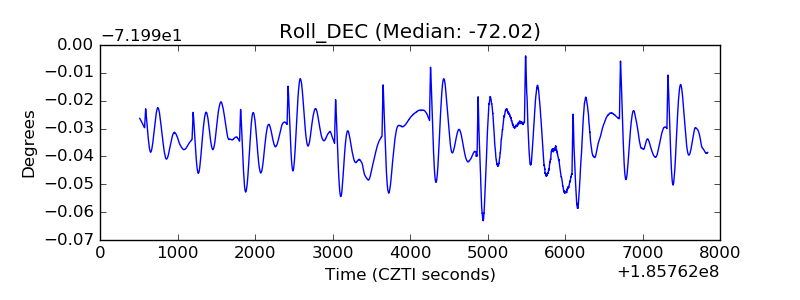 |
| _Roll_RA | 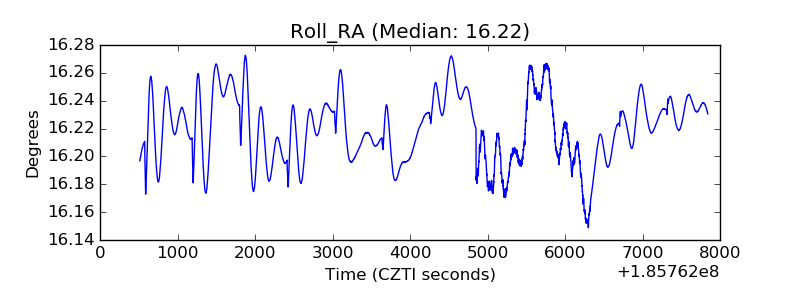 |
| Veto Counter |  |