| Param | Original file | Final file |
|---|---|---|
| Filename | modeM0/AS1P01_010T01_9000000112_00800cztM0_level2.evt | modeM0/AS1P01_010T01_9000000112_00800cztM0_level2_quad_clean.evt |
| Size (bytes) | 1,093,023,360 | 101,257,920 |
| Size | 1.0 GB | 96.6 MB |
| Events in quadrant A | 8,189,199 | 655,225 |
| Events in quadrant B | 8,681,410 | 660,581 |
| Events in quadrant C | 8,070,876 | 642,254 |
| Events in quadrant D | 7,704,970 | 629,482 |
| Mode M0 | |||
|---|---|---|---|
| Quadrant | BADHDUFLAG | Total packets | Discarded packets |
| A | 0 | 29167 | 0 |
| B | 0 | 30665 | 0 |
| C | 0 | 28851 | 0 |
| D | 0 | 27785 | 0 |
| Mode SS | |||
|---|---|---|---|
| Quadrant | BADHDUFLAG | Total packets | Discarded packets |
| A | 0 | 138 | 0 |
| B | 0 | 138 | 0 |
| C | 0 | 138 | 0 |
| D | 0 | 138 | 0 |
| Quadrant | Total seconds | Saturated seconds | Saturation percentage |
|---|---|---|---|
| A | 6874 | 22 | 0.320047% |
| B | 6875 | 15 | 0.218182% |
| C | 6874 | 9 | 0.130928% |
| D | 6874 | 35 | 0.509165% |
Noise dominated data is calculated using 1-second bins in cleaned event files. If a bin has >2000 counts, and if more than 50% of those come from <1% of pixels, then it is considered to be noise-dominated and hence unusable.
| Quadrant | # 1 sec bins | Bins with >0 counts | Bins with >2000 counts | High rate bins dominated by noise | Noise dominated (total time) | Noise dominated (detector-on time) | Marked lightcurve |
|---|---|---|---|---|---|---|---|
| A | 6874 | 6874 | 320 | 320 | 4.66% | 4.66% | 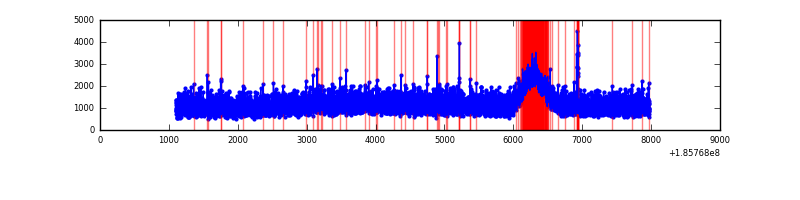 |
| B | 6875 | 6875 | 410 | 410 | 5.96% | 5.96% | 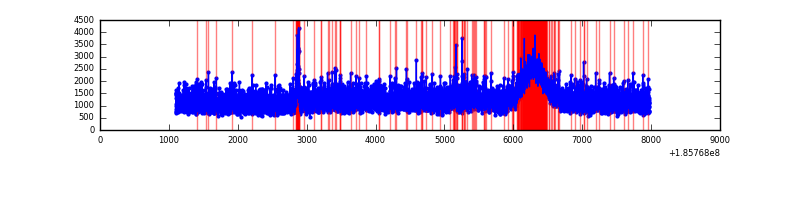 |
| C | 6874 | 6874 | 307 | 307 | 4.47% | 4.47% | 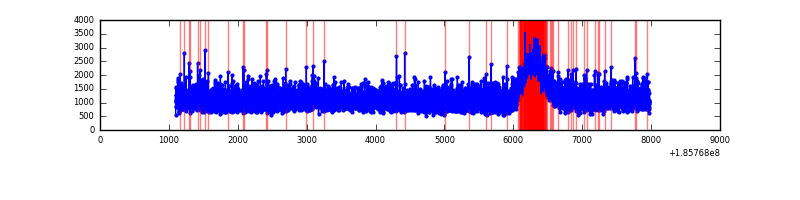 |
| D | 6874 | 6874 | 290 | 290 | 4.22% | 4.22% | 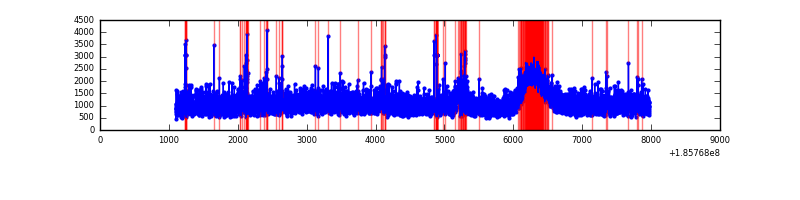 |
Top three noisy pixels from each quadrant. If the there are fewer than three noisy pixels in the level2.evt file, extra rows are filled as -1
| Pixel properties | Quadrant properties | ||||||
|---|---|---|---|---|---|---|---|
| Quadrant | DetID | PixID | Counts | Sigma | Mean | Median | Sigma |
| A | 15 | 233 | 27359 | 49.58 | 2114 | 2125 | 508.9 |
| A | 15 | 171 | 12828 | 21.03 | 2114 | 2125 | 508.9 |
| A | 14 | 79 | 12639 | 20.66 | 2114 | 2125 | 508.9 |
| B | 15 | 22 | 94176 | 174.8 | 2232 | 2231 | 526.0 |
| B | 5 | 191 | 42474 | 76.51 | 2232 | 2231 | 526.0 |
| B | 7 | 221 | 30239 | 53.25 | 2232 | 2231 | 526.0 |
| C | 15 | 241 | 50993 | 86.07 | 2029 | 2101 | 568.1 |
| C | 3 | 111 | 35037 | 57.98 | 2029 | 2101 | 568.1 |
| C | 3 | 79 | 29324 | 47.92 | 2029 | 2101 | 568.1 |
| D | 13 | 170 | 163360 | 264.48 | 1954 | 2024 | 610.0 |
| D | 13 | 13 | 86306 | 138.16 | 1954 | 2024 | 610.0 |
| D | 13 | 25 | 81843 | 130.85 | 1954 | 2024 | 610.0 |
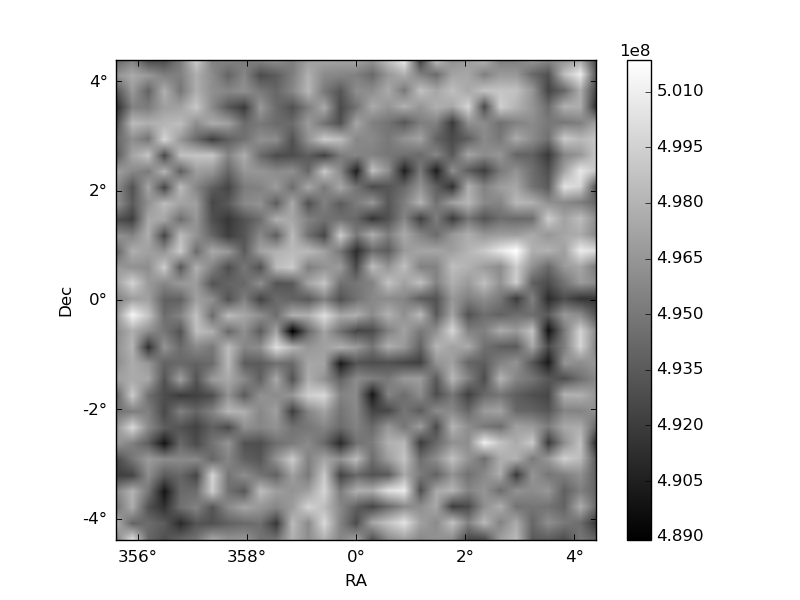
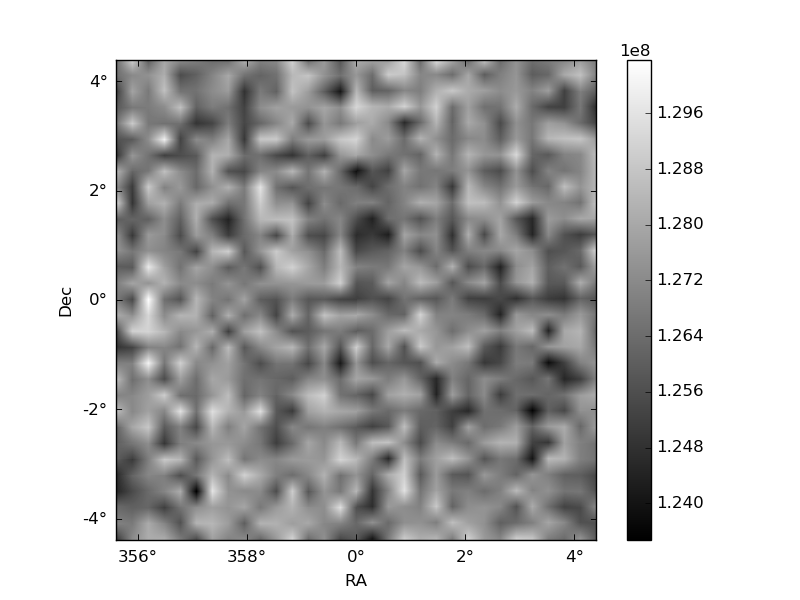
Histogram calculated using DETX and DETY for each event in the final _common_clean file
| Quadrant A | 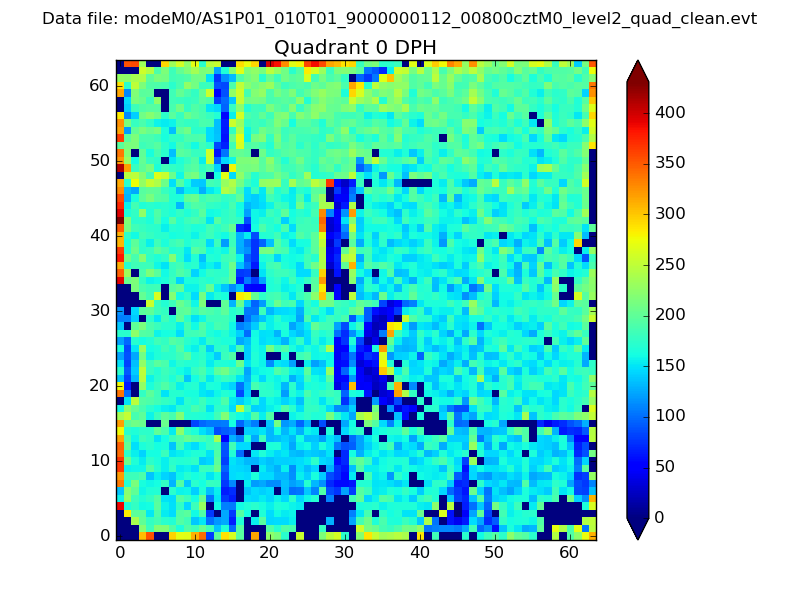 |
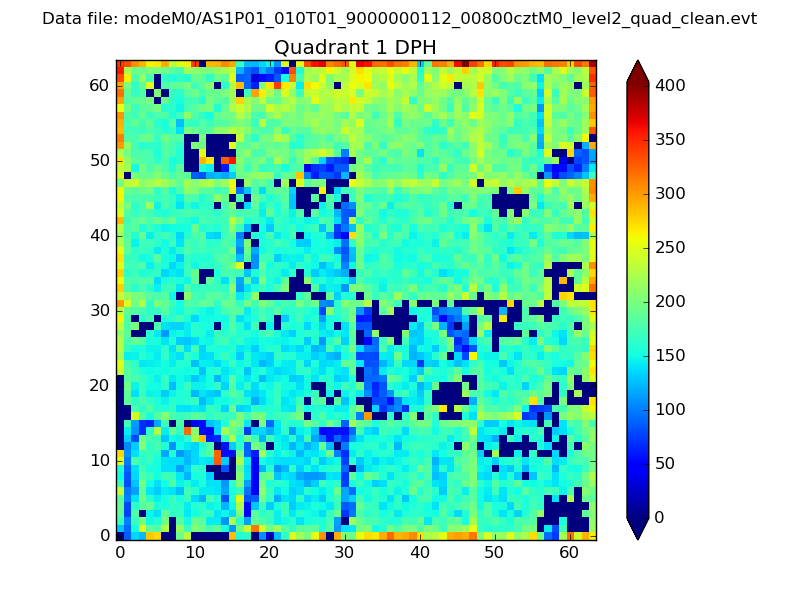 |
Quadrant B |
|---|---|---|---|
| Quadrant D | 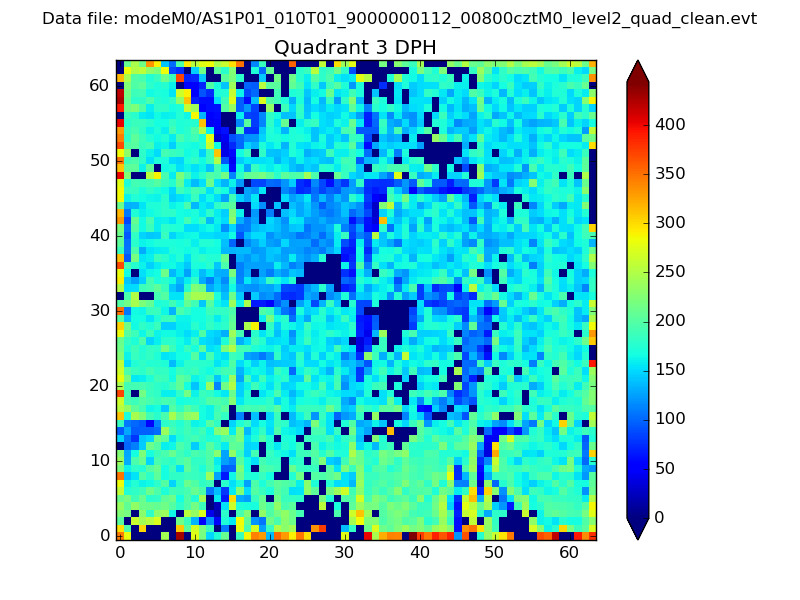 |
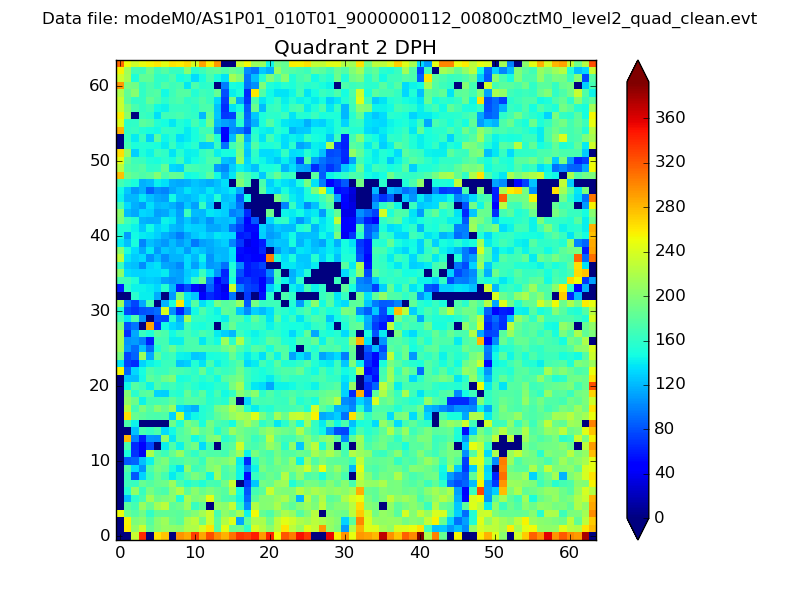 |
Quadrant C |
| Plot type | Count rate plots | Images |
|---|---|---|
| Comparison with Poisson distribution Blue bars denote a histogram of data divided into 1 sec bins. Red curve is a Poisson curve with rate = median count rate of data. |
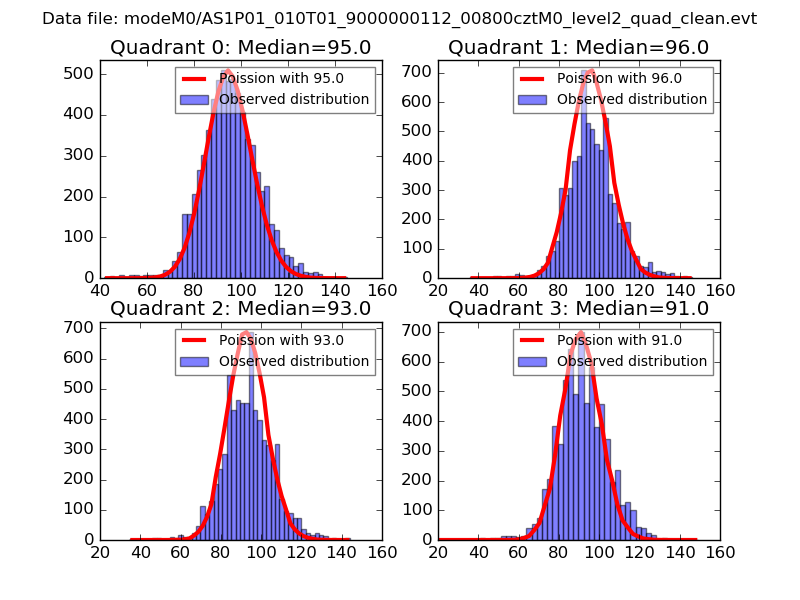 |
 |
| Quadrant-wise count rates Data is divided into 100 sec bins |
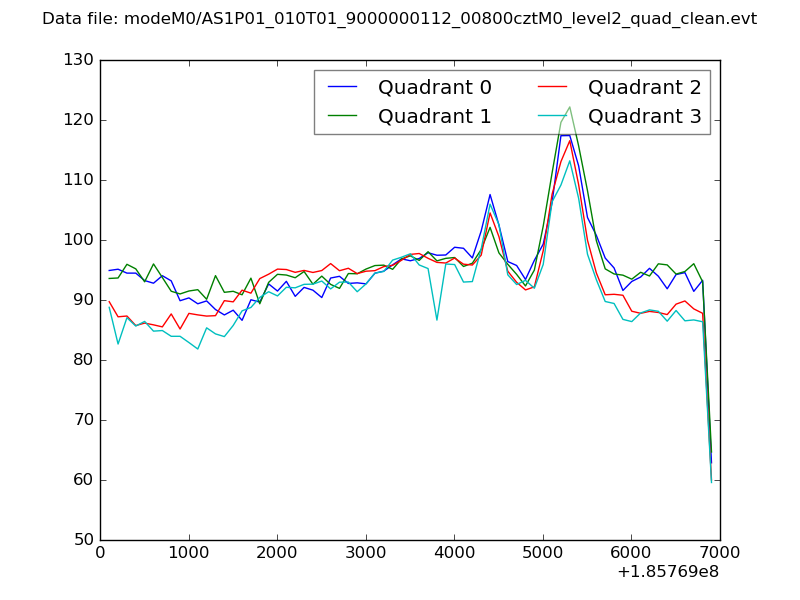 |
|
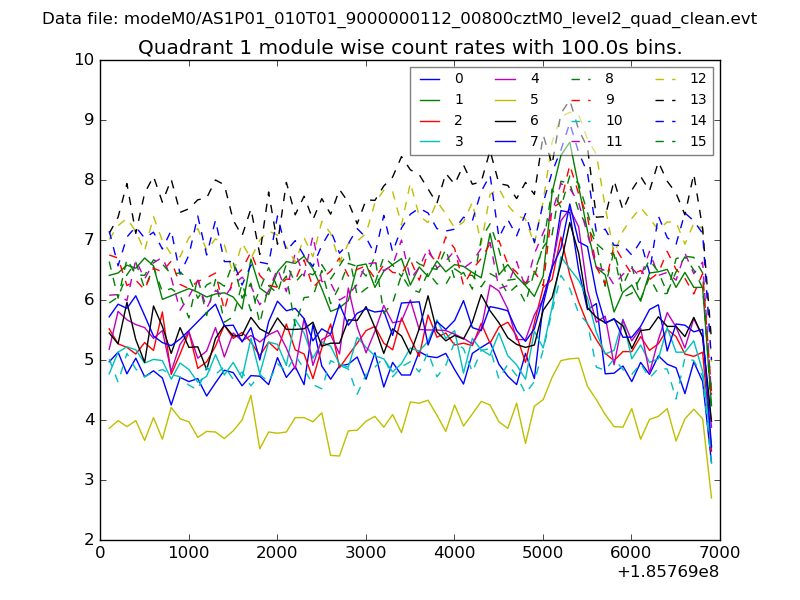
| Module-wise count rates for Quadrant A Data is divided into 100 sec bins |
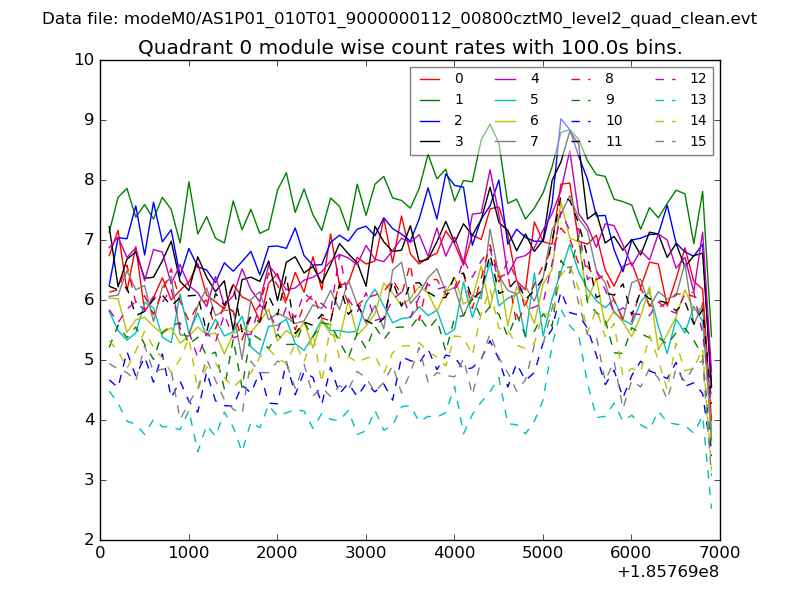 |
 |
| Module-wise count rates for Quadrant B Data is divided into 100 sec bins |
 |
 |
| Module-wise count rates for Quadrant C Data is divided into 100 sec bins |
 |
 |
| Module-wise count rates for Quadrant D Data is divided into 100 sec bins |
 |
 |
| Parameter | Plot |
|---|---|
| CZT HV Monitor | 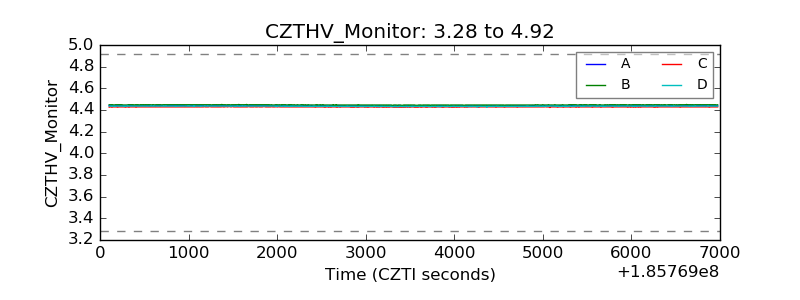 |
| D_VDD | 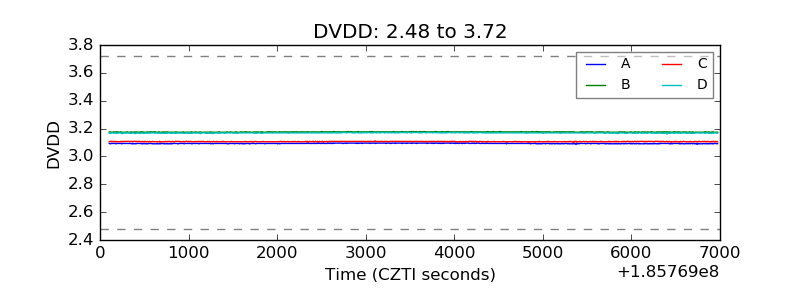 |
| Temperature 1 | 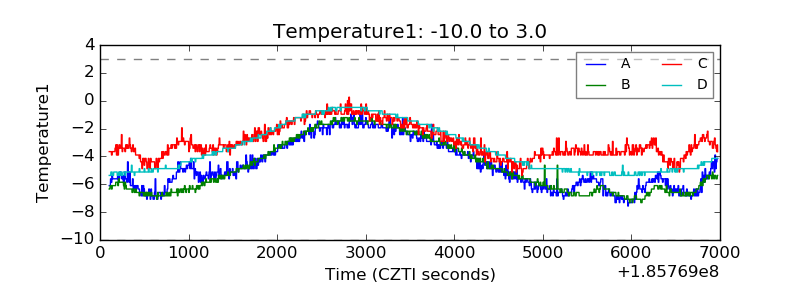 |
| Veto HV Monitor | 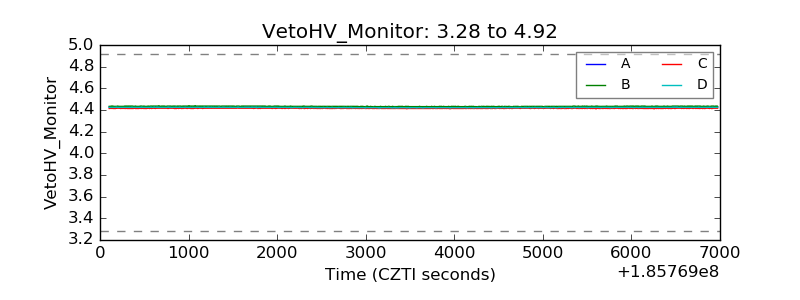 |
| Veto LLD |  |
| Alpha Counter | 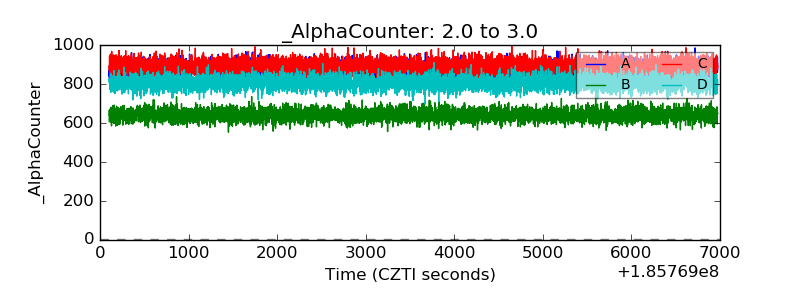 |
| _CPM_Rate | 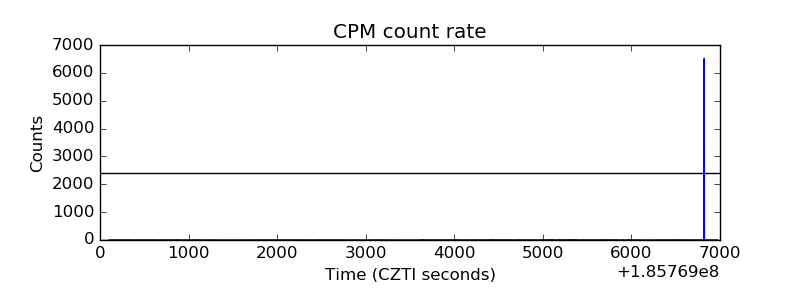 |
| CZT Counter | 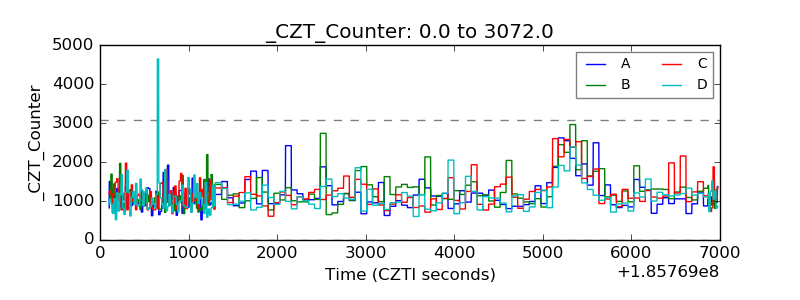 |
| +2.5 Volts monitor |  |
| +5 Volts monitor |  |
| _ROLL_ROT | 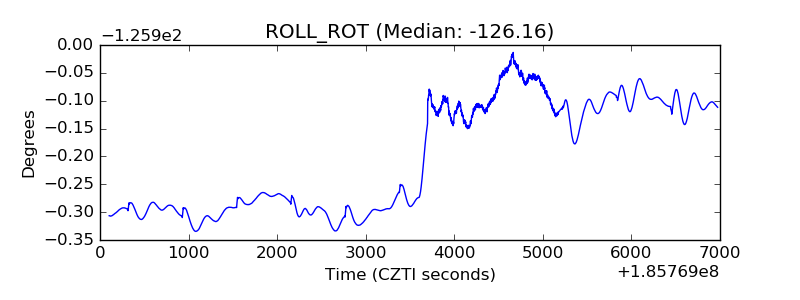 |
| _Roll_DEC | 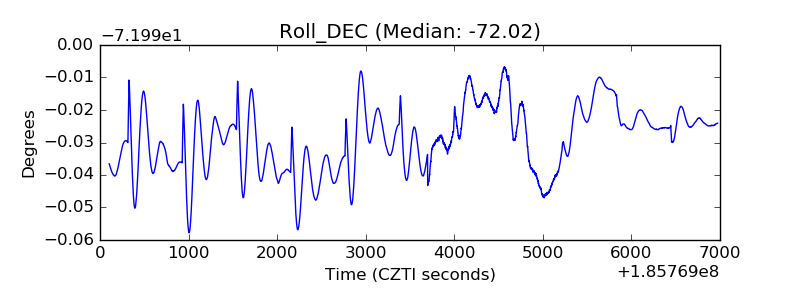 |
| _Roll_RA | 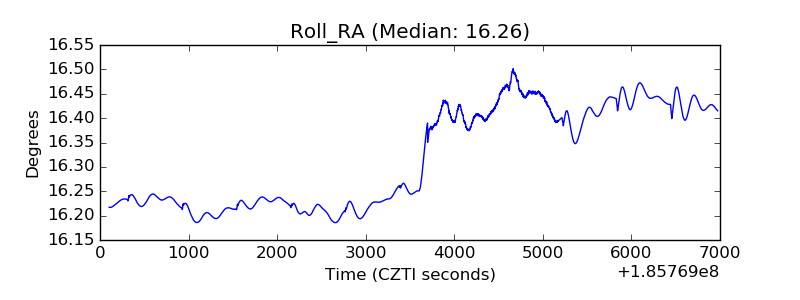 |
| Veto Counter | 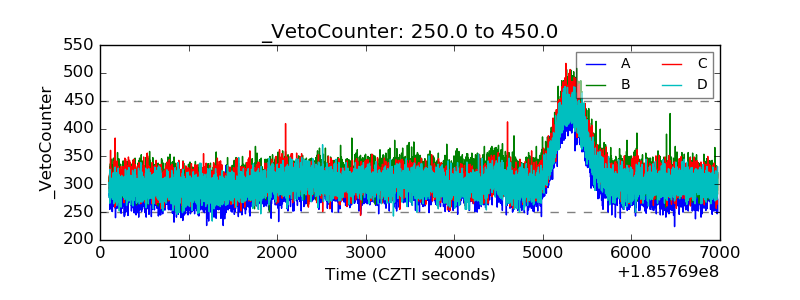 |