| Param | Original file | Final file |
|---|---|---|
| Filename | modeM0/AS1P01_010T01_9000000112_00801cztM0_level2.evt | modeM0/AS1P01_010T01_9000000112_00801cztM0_level2_quad_clean.evt |
| Size (bytes) | 1,149,376,320 | 104,080,320 |
| Size | 1.1 GB | 99.3 MB |
| Events in quadrant A | 8,726,574 | 670,741 |
| Events in quadrant B | 9,028,598 | 680,069 |
| Events in quadrant C | 8,507,560 | 663,214 |
| Events in quadrant D | 8,078,100 | 645,774 |
| Mode M0 | |||
|---|---|---|---|
| Quadrant | BADHDUFLAG | Total packets | Discarded packets |
| A | 0 | 30949 | 0 |
| B | 0 | 31817 | 0 |
| C | 0 | 30287 | 0 |
| D | 0 | 29011 | 0 |
| Mode SS | |||
|---|---|---|---|
| Quadrant | BADHDUFLAG | Total packets | Discarded packets |
| A | 0 | 142 | 0 |
| B | 0 | 142 | 0 |
| C | 0 | 142 | 0 |
| D | 0 | 142 | 0 |
| Quadrant | Total seconds | Saturated seconds | Saturation percentage |
|---|---|---|---|
| A | 7066 | 57 | 0.806680% |
| B | 7067 | 57 | 0.806566% |
| C | 7067 | 37 | 0.523560% |
| D | 7067 | 84 | 1.188623% |
Noise dominated data is calculated using 1-second bins in cleaned event files. If a bin has >2000 counts, and if more than 50% of those come from <1% of pixels, then it is considered to be noise-dominated and hence unusable.
| Quadrant | # 1 sec bins | Bins with >0 counts | Bins with >2000 counts | High rate bins dominated by noise | Noise dominated (total time) | Noise dominated (detector-on time) | Marked lightcurve |
|---|---|---|---|---|---|---|---|
| A | 7066 | 7066 | 434 | 434 | 6.14% | 6.14% | 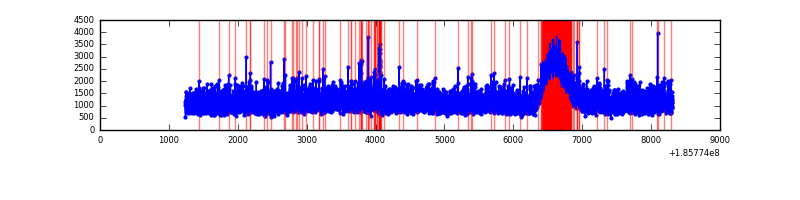 |
| B | 7067 | 7067 | 440 | 440 | 6.23% | 6.23% | 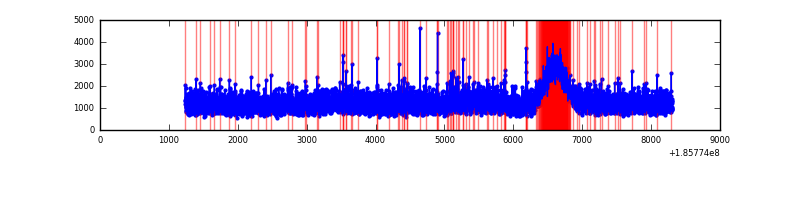 |
| C | 7067 | 7067 | 404 | 404 | 5.72% | 5.72% | 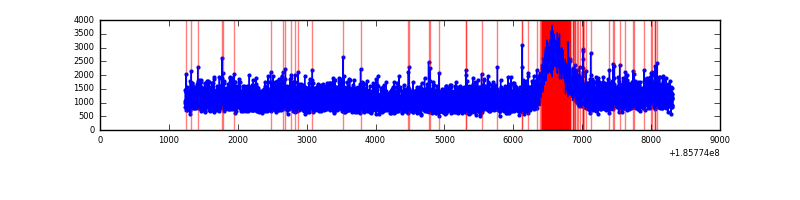 |
| D | 7067 | 7067 | 390 | 390 | 5.52% | 5.52% | 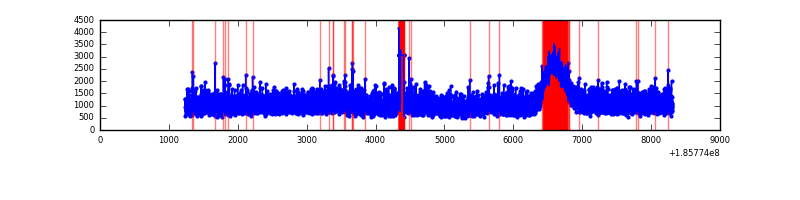 |
Top three noisy pixels from each quadrant. If the there are fewer than three noisy pixels in the level2.evt file, extra rows are filled as -1
| Pixel properties | Quadrant properties | ||||||
|---|---|---|---|---|---|---|---|
| Quadrant | DetID | PixID | Counts | Sigma | Mean | Median | Sigma |
| A | 14 | 79 | 119640 | 215.83 | 2226 | 2239 | 543.9 |
| A | 15 | 233 | 35975 | 62.02 | 2226 | 2239 | 543.9 |
| A | 15 | 171 | 27503 | 46.45 | 2226 | 2239 | 543.9 |
| B | 15 | 22 | 65666 | 114.72 | 2332 | 2337 | 552.0 |
| B | 5 | 191 | 39975 | 68.18 | 2332 | 2337 | 552.0 |
| B | 15 | 85 | 22044 | 35.7 | 2332 | 2337 | 552.0 |
| C | 15 | 241 | 53947 | 86.17 | 2135 | 2216 | 600.3 |
| C | 3 | 111 | 37811 | 59.29 | 2135 | 2216 | 600.3 |
| C | 3 | 79 | 33754 | 52.53 | 2135 | 2216 | 600.3 |
| D | 13 | 25 | 200538 | 309.73 | 2057 | 2131 | 640.6 |
| D | 1 | 4 | 69910 | 105.81 | 2057 | 2131 | 640.6 |
| D | 13 | 170 | 67718 | 102.39 | 2057 | 2131 | 640.6 |
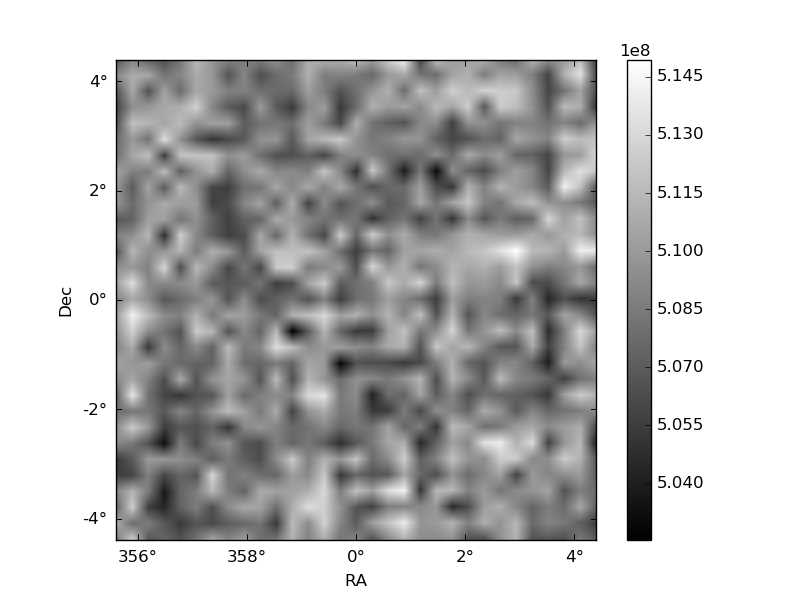
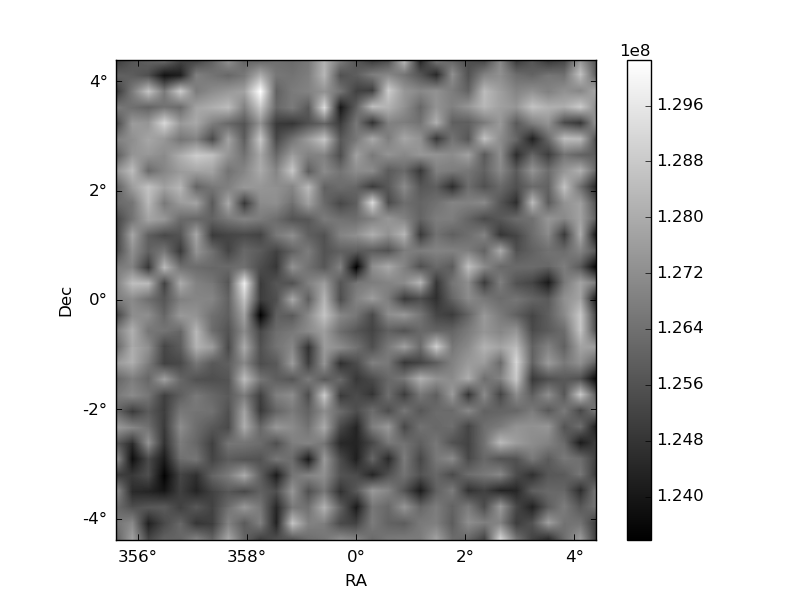
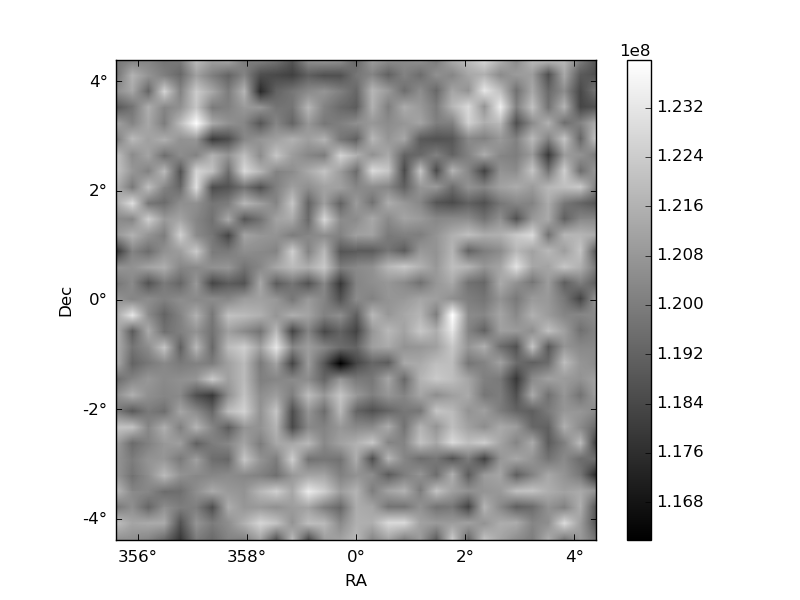
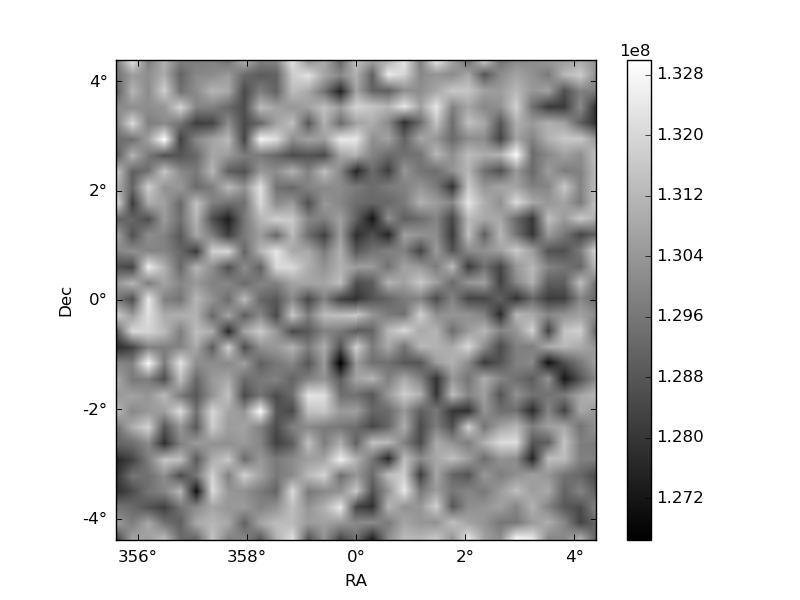
Histogram calculated using DETX and DETY for each event in the final _common_clean file
| Quadrant A | 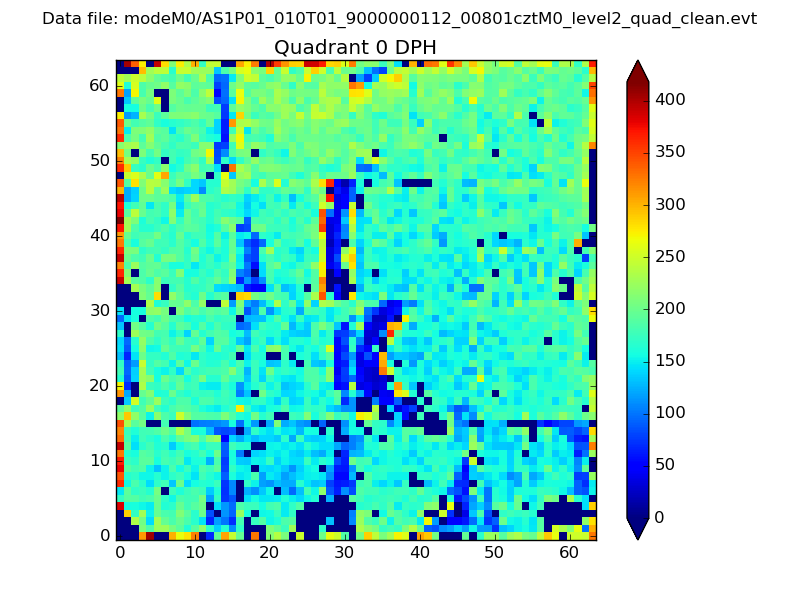 |
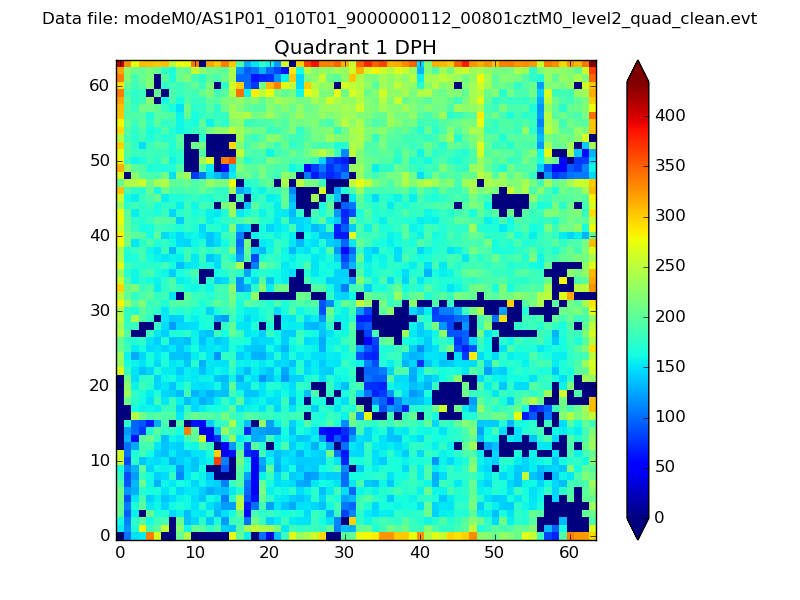 |
Quadrant B |
|---|---|---|---|
| Quadrant D | 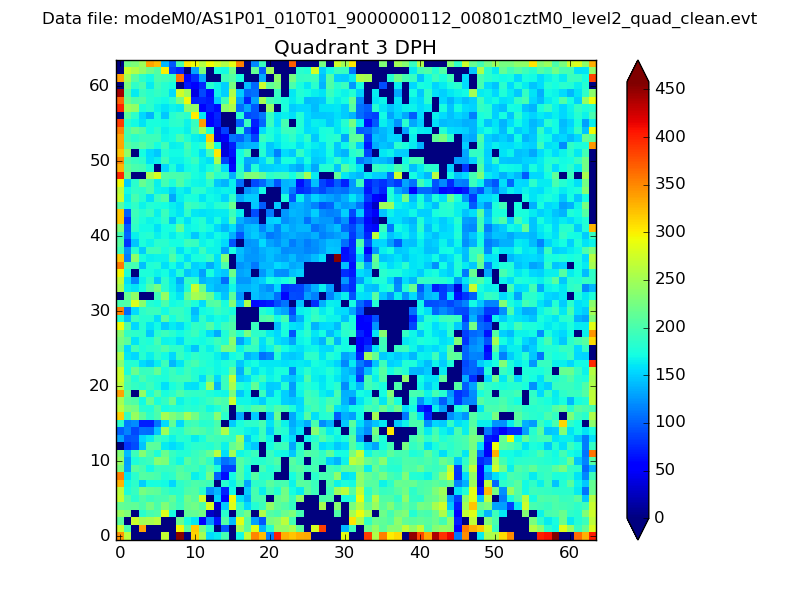 |
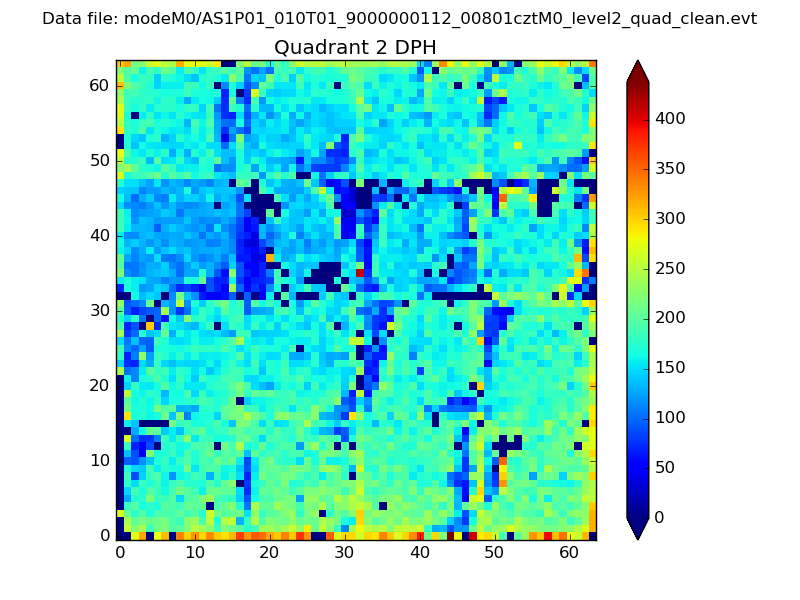 |
Quadrant C |
| Plot type | Count rate plots | Images |
|---|---|---|
| Comparison with Poisson distribution Blue bars denote a histogram of data divided into 1 sec bins. Red curve is a Poisson curve with rate = median count rate of data. |
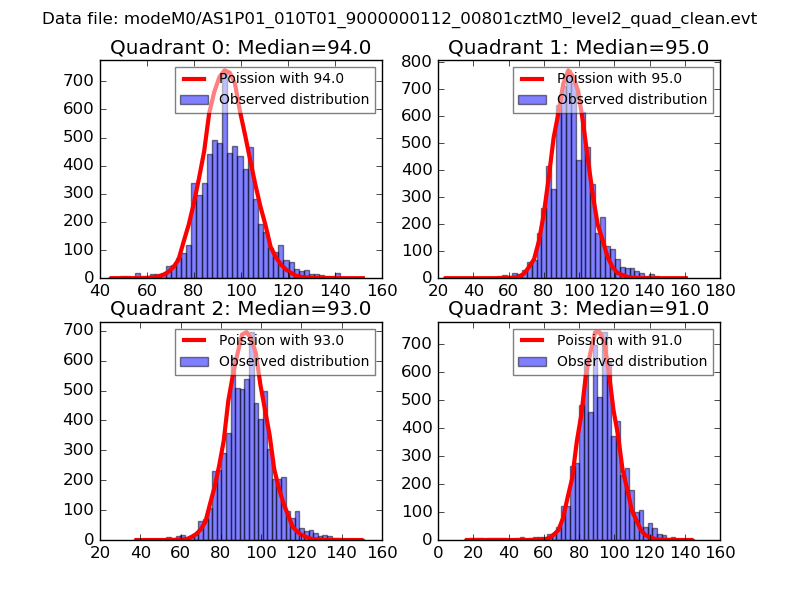 |
 |
| Quadrant-wise count rates Data is divided into 100 sec bins |
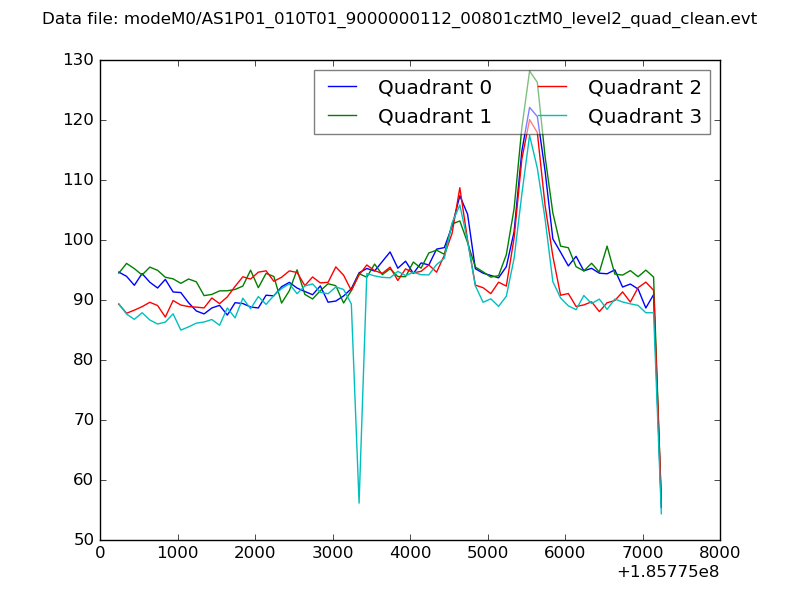 |
|
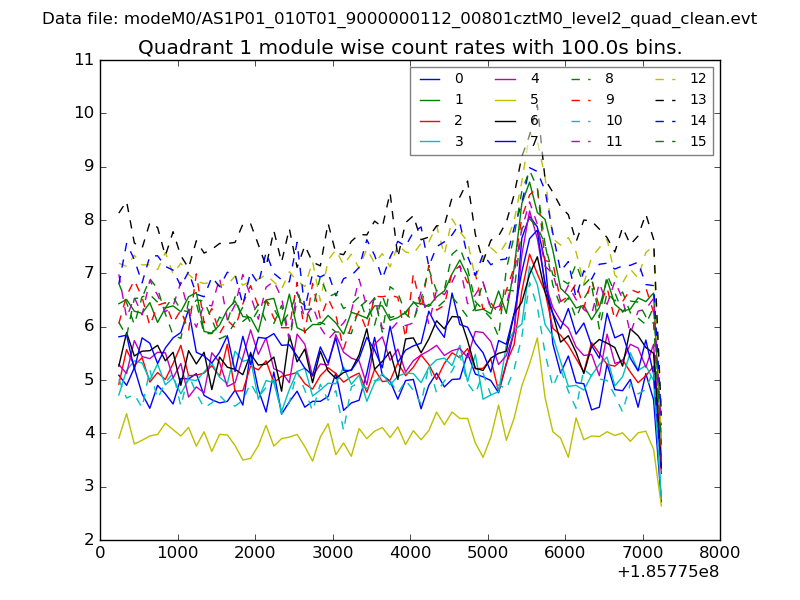
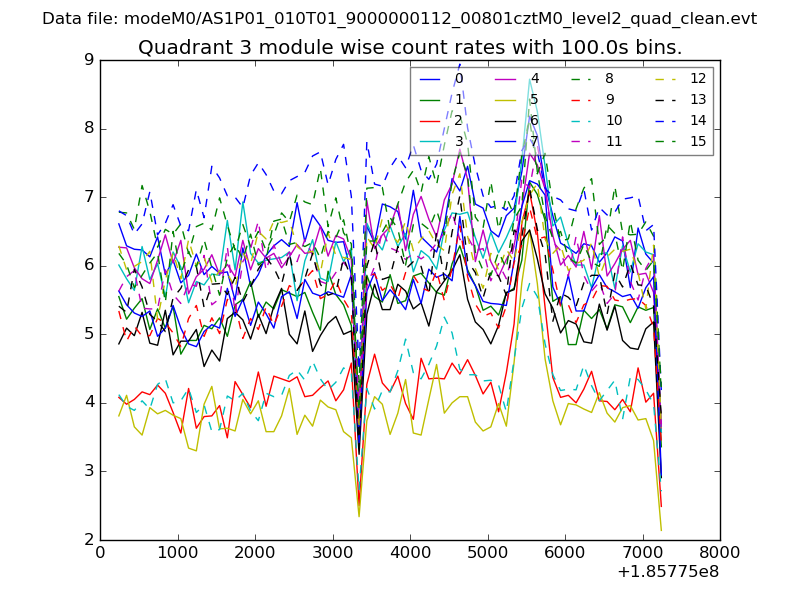
| Module-wise count rates for Quadrant A Data is divided into 100 sec bins |
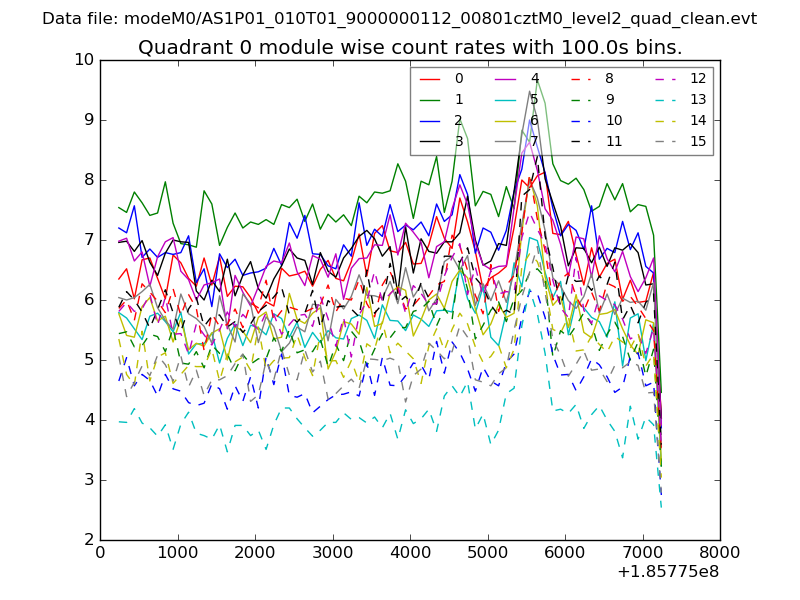 |
 |
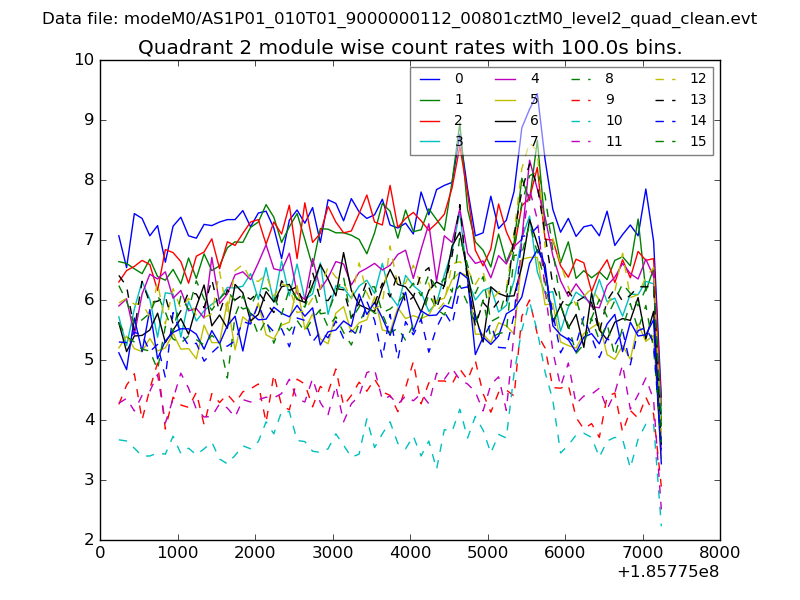
| Module-wise count rates for Quadrant B Data is divided into 100 sec bins |
 |
 |
| Module-wise count rates for Quadrant C Data is divided into 100 sec bins |
 |
 |
| Module-wise count rates for Quadrant D Data is divided into 100 sec bins |
 |
 |
| Parameter | Plot |
|---|---|
| CZT HV Monitor | 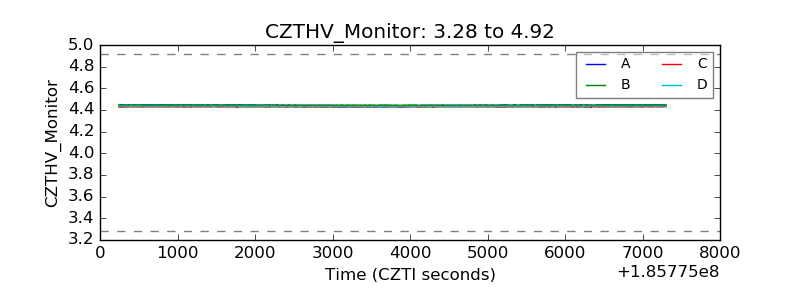 |
| D_VDD | 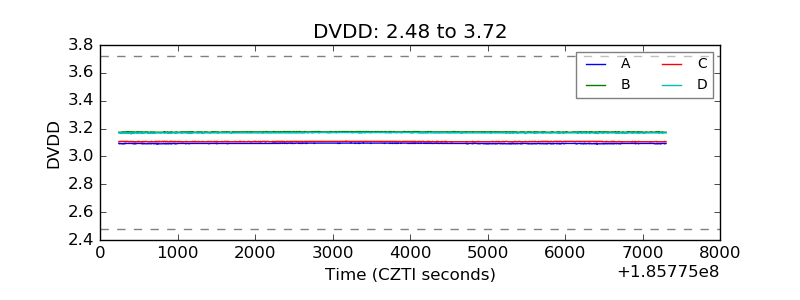 |
| Temperature 1 | 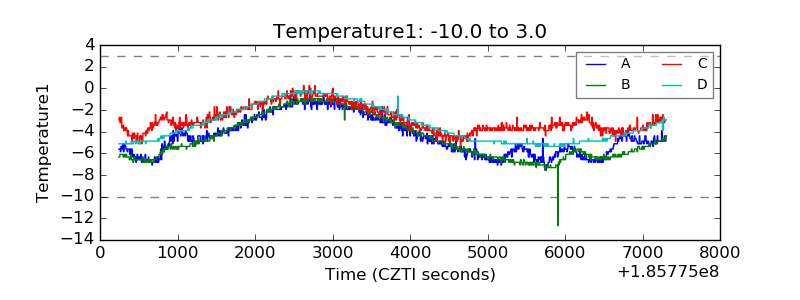 |
| Veto HV Monitor |  |
| Veto LLD | 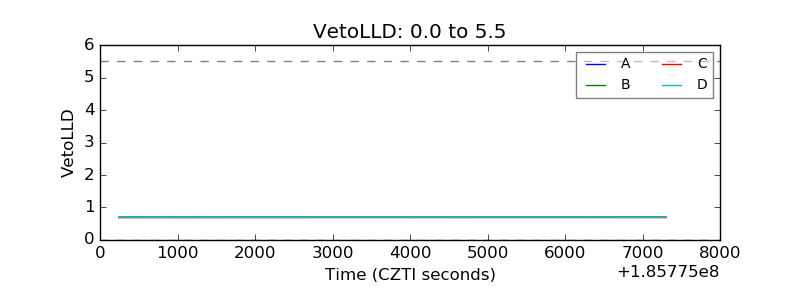 |
| Alpha Counter | 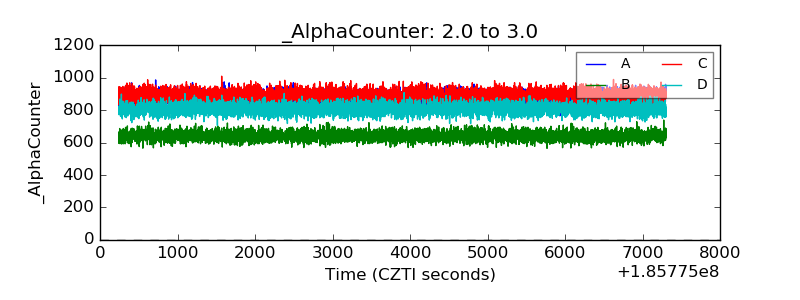 |
| _CPM_Rate | 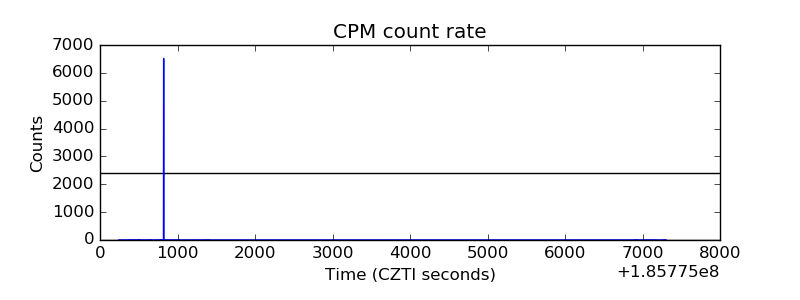 |
| CZT Counter |  |
| +2.5 Volts monitor |  |
| +5 Volts monitor |  |
| _ROLL_ROT | 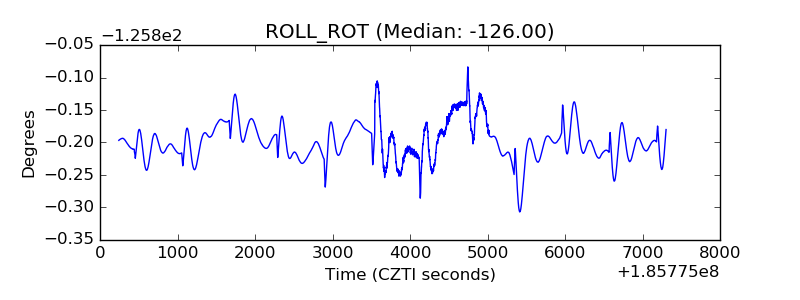 |
| _Roll_DEC | 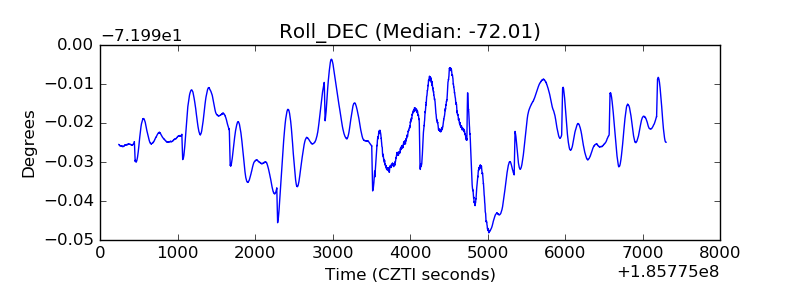 |
| _Roll_RA | 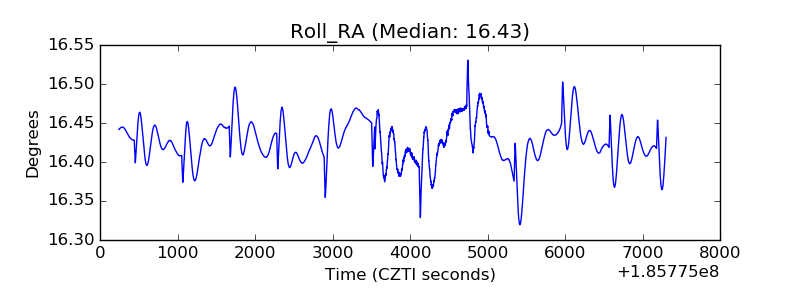 |
| Veto Counter | 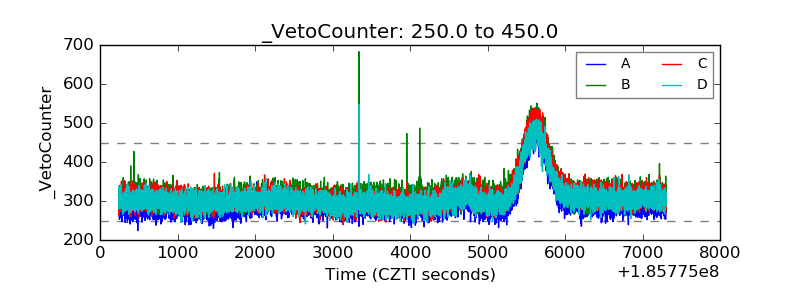 |