| Param | Original file | Final file |
|---|---|---|
| Filename | modeM0/AS1P01_010T01_9000000112_00802cztM0_level2.evt | modeM0/AS1P01_010T01_9000000112_00802cztM0_level2_quad_clean.evt |
| Size (bytes) | 1,146,196,800 | 102,905,280 |
| Size | 1.1 GB | 98.1 MB |
| Events in quadrant A | 8,829,852 | 659,436 |
| Events in quadrant B | 9,020,556 | 666,686 |
| Events in quadrant C | 8,406,702 | 658,906 |
| Events in quadrant D | 7,990,005 | 641,876 |
| Mode M9 | |||
|---|---|---|---|
| Quadrant | BADHDUFLAG | Total packets | Discarded packets |
| A | 0 | 2 | 0 |
| B | 0 | 2 | 0 |
| C | 0 | 2 | 0 |
| D | 0 | 2 | 0 |
| Mode M0 | |||
|---|---|---|---|
| Quadrant | BADHDUFLAG | Total packets | Discarded packets |
| A | 0 | 31235 | 0 |
| B | 0 | 31816 | 0 |
| C | 0 | 30013 | 0 |
| D | 0 | 28745 | 0 |
| Mode SS | |||
|---|---|---|---|
| Quadrant | BADHDUFLAG | Total packets | Discarded packets |
| A | 0 | 144 | 0 |
| B | 0 | 144 | 0 |
| C | 0 | 144 | 0 |
| D | 0 | 144 | 0 |
| Quadrant | Total seconds | Saturated seconds | Saturation percentage |
|---|---|---|---|
| A | 7019 | 138 | 1.966092% |
| B | 7019 | 142 | 2.023080% |
| C | 7019 | 112 | 1.595669% |
| D | 7020 | 151 | 2.150997% |
Noise dominated data is calculated using 1-second bins in cleaned event files. If a bin has >2000 counts, and if more than 50% of those come from <1% of pixels, then it is considered to be noise-dominated and hence unusable.
| Quadrant | # 1 sec bins | Bins with >0 counts | Bins with >2000 counts | High rate bins dominated by noise | Noise dominated (total time) | Noise dominated (detector-on time) | Marked lightcurve |
|---|---|---|---|---|---|---|---|
| A | 7294 | 7019 | 409 | 409 | 5.61% | 5.83% |  |
| B | 7294 | 7019 | 383 | 383 | 5.25% | 5.46% |  |
| C | 7294 | 7019 | 304 | 304 | 4.17% | 4.33% | 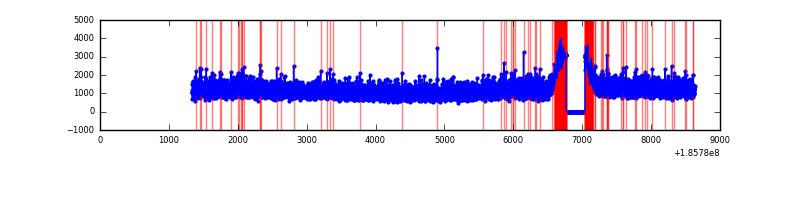 |
| D | 7295 | 7020 | 293 | 293 | 4.02% | 4.17% | 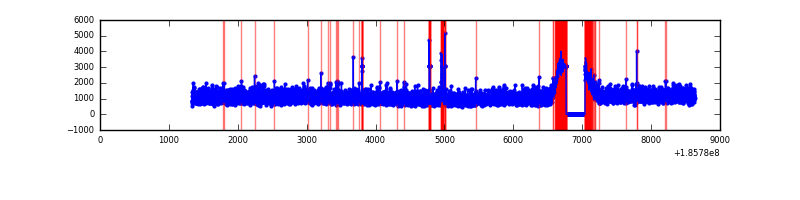 |
Top three noisy pixels from each quadrant. If the there are fewer than three noisy pixels in the level2.evt file, extra rows are filled as -1
| Pixel properties | Quadrant properties | ||||||
|---|---|---|---|---|---|---|---|
| Quadrant | DetID | PixID | Counts | Sigma | Mean | Median | Sigma |
| A | 14 | 79 | 177771 | 326.66 | 2209 | 2222 | 537.4 |
| A | 15 | 233 | 131759 | 241.04 | 2209 | 2222 | 537.4 |
| A | 15 | 171 | 30296 | 52.24 | 2209 | 2222 | 537.4 |
| B | 15 | 22 | 61943 | 110.28 | 2287 | 2297 | 540.9 |
| B | 0 | 23 | 58831 | 104.52 | 2287 | 2297 | 540.9 |
| B | 0 | 187 | 49405 | 87.1 | 2287 | 2297 | 540.9 |
| C | 15 | 241 | 52114 | 84.26 | 2110 | 2182 | 592.6 |
| C | 3 | 111 | 35824 | 56.77 | 2110 | 2182 | 592.6 |
| C | 3 | 79 | 30445 | 47.69 | 2110 | 2182 | 592.6 |
| D | 13 | 25 | 155203 | 240.88 | 2040 | 2110 | 635.6 |
| D | 1 | 4 | 93282 | 143.45 | 2040 | 2110 | 635.6 |
| D | 13 | 170 | 49158 | 74.03 | 2040 | 2110 | 635.6 |
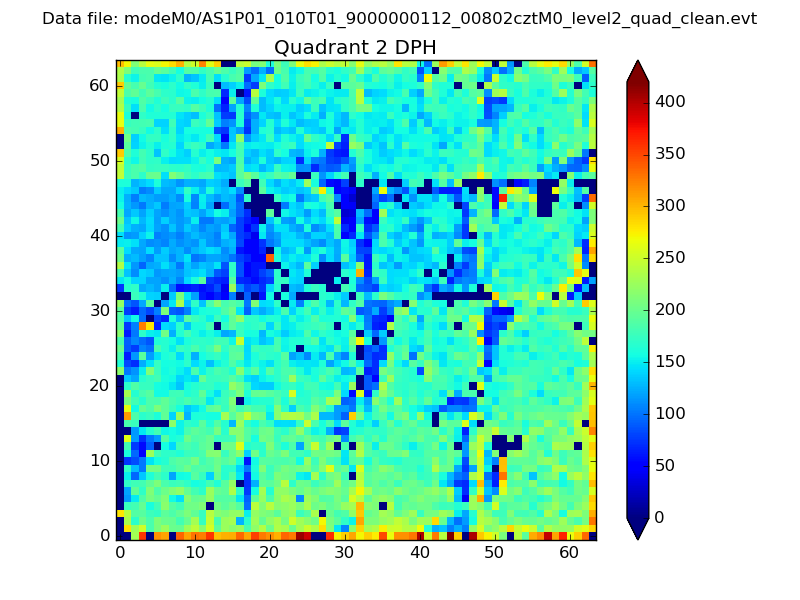
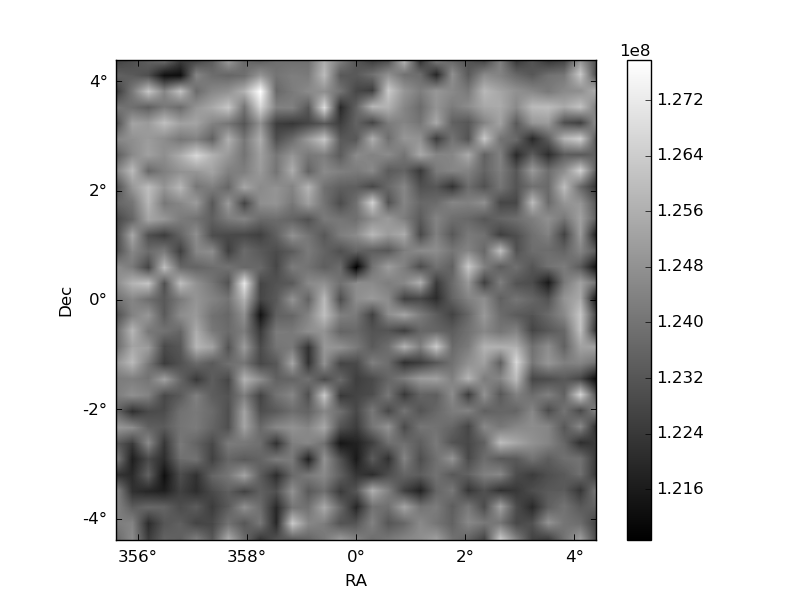
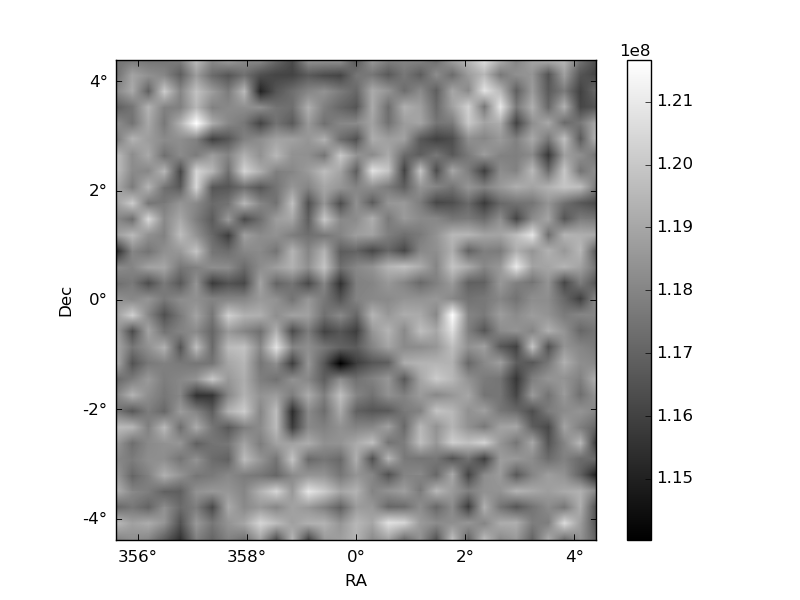
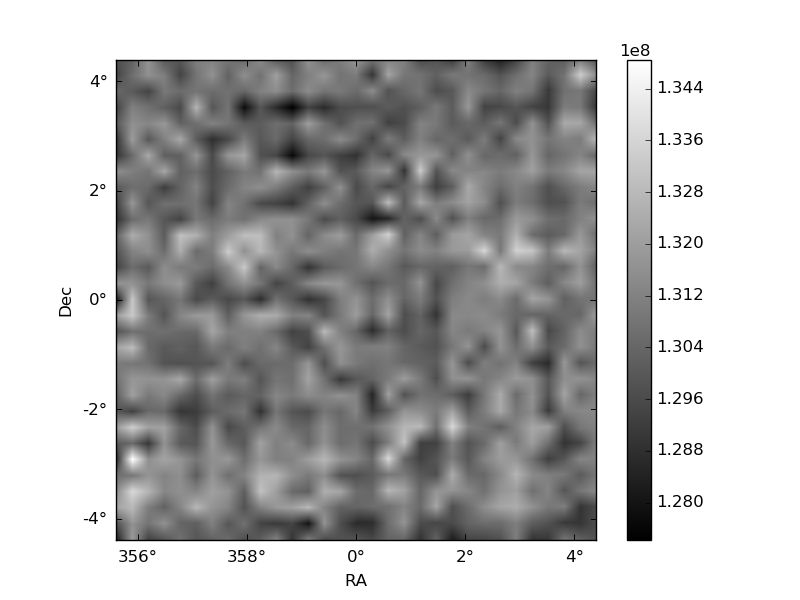
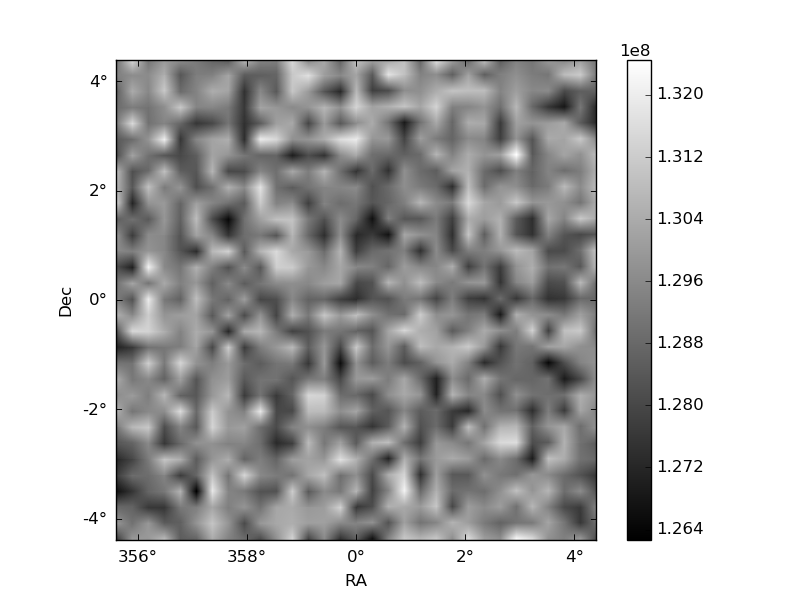
Histogram calculated using DETX and DETY for each event in the final _common_clean file
| Quadrant A | 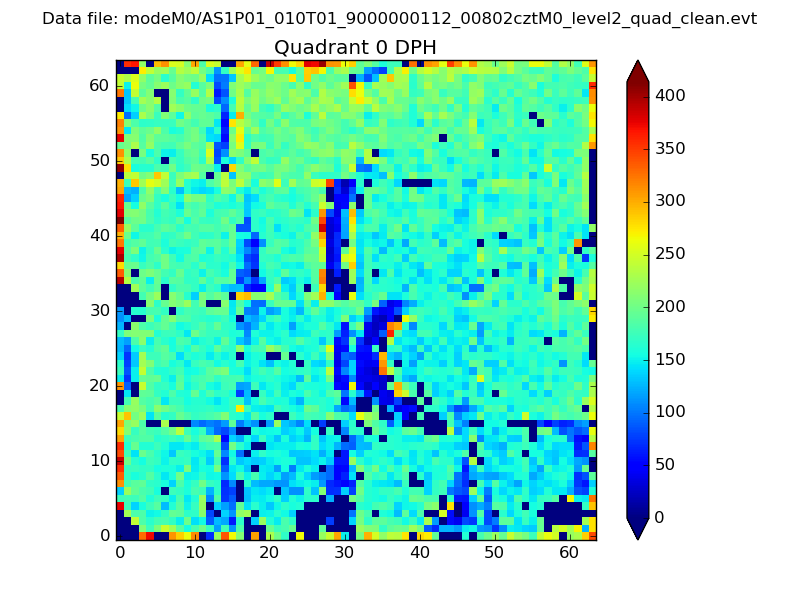 |
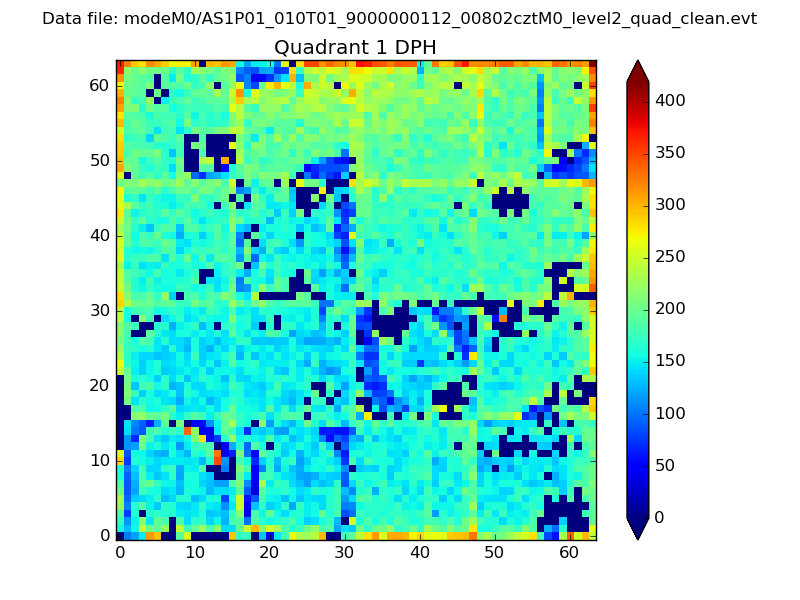 |
Quadrant B |
|---|---|---|---|
| Quadrant D | 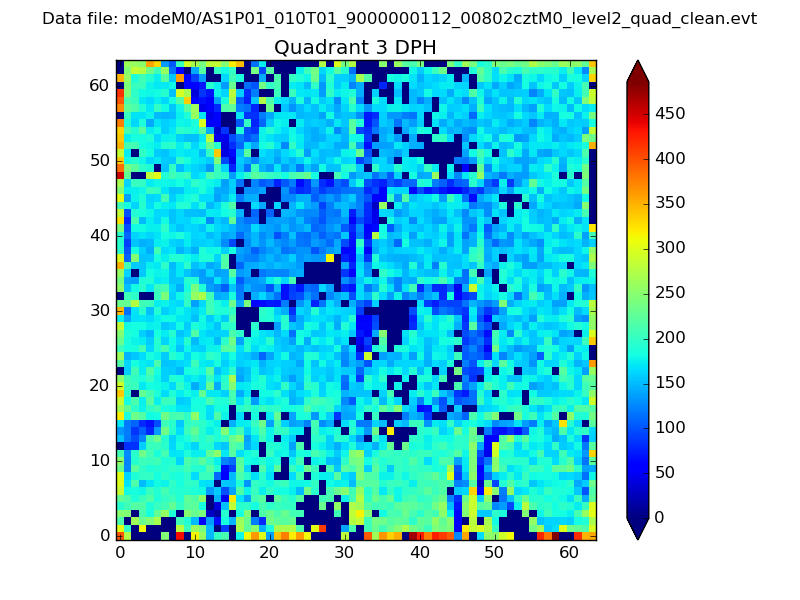 |
 |
Quadrant C |
| Plot type | Count rate plots | Images |
|---|---|---|
| Comparison with Poisson distribution Blue bars denote a histogram of data divided into 1 sec bins. Red curve is a Poisson curve with rate = median count rate of data. |
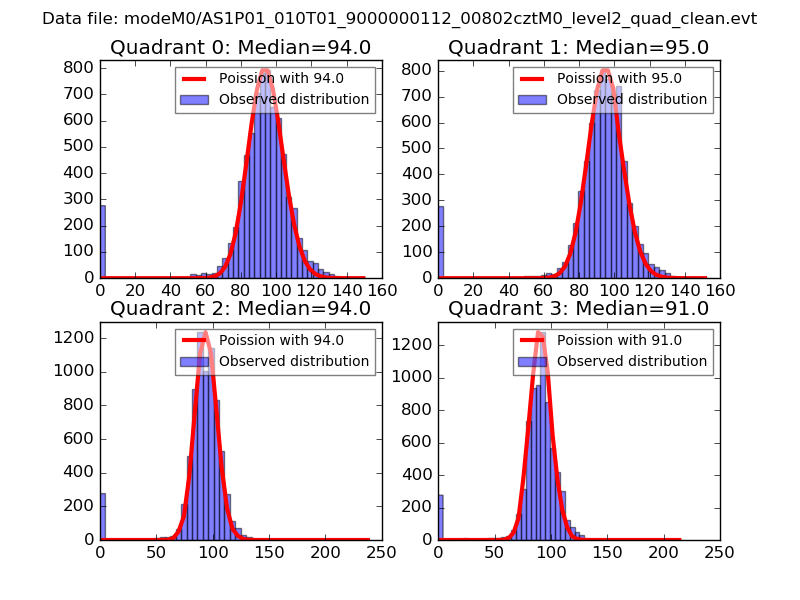 |
 |
| Quadrant-wise count rates Data is divided into 100 sec bins |
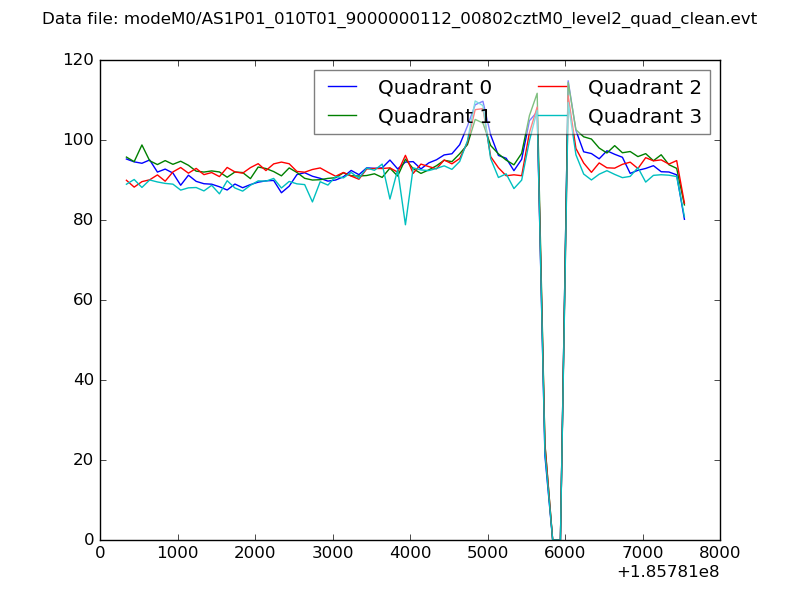 |
|
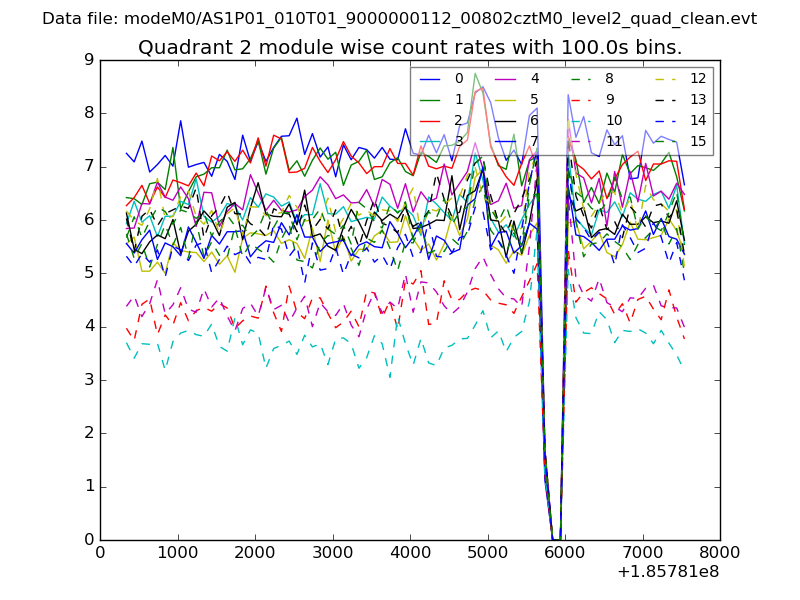
| Module-wise count rates for Quadrant A Data is divided into 100 sec bins |
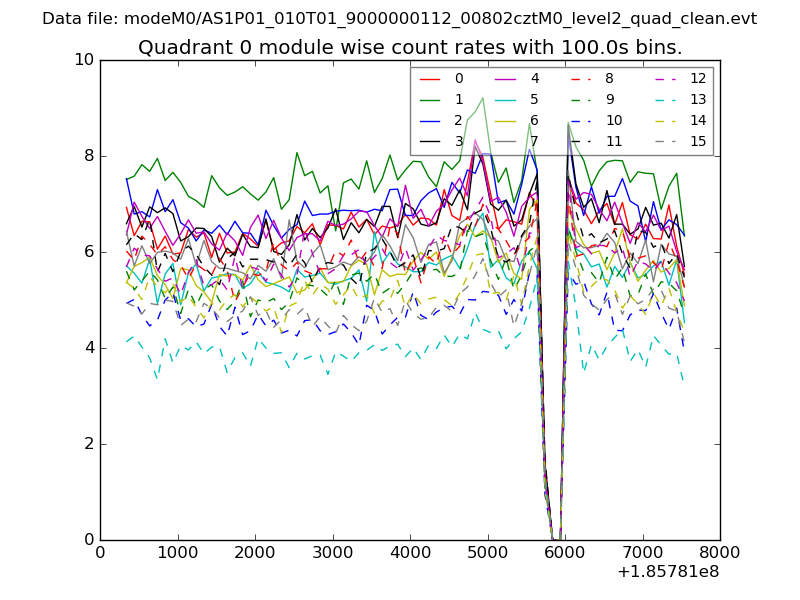 |
 |
| Module-wise count rates for Quadrant B Data is divided into 100 sec bins |
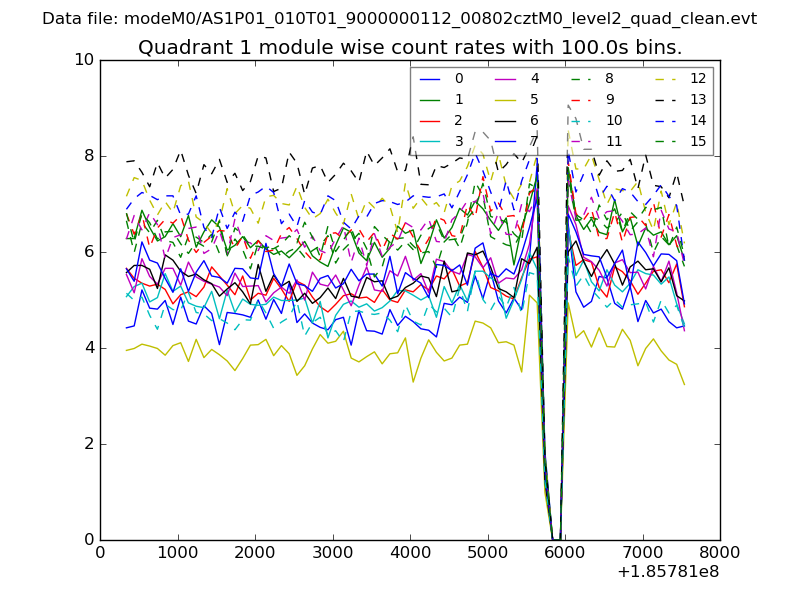 |
 |
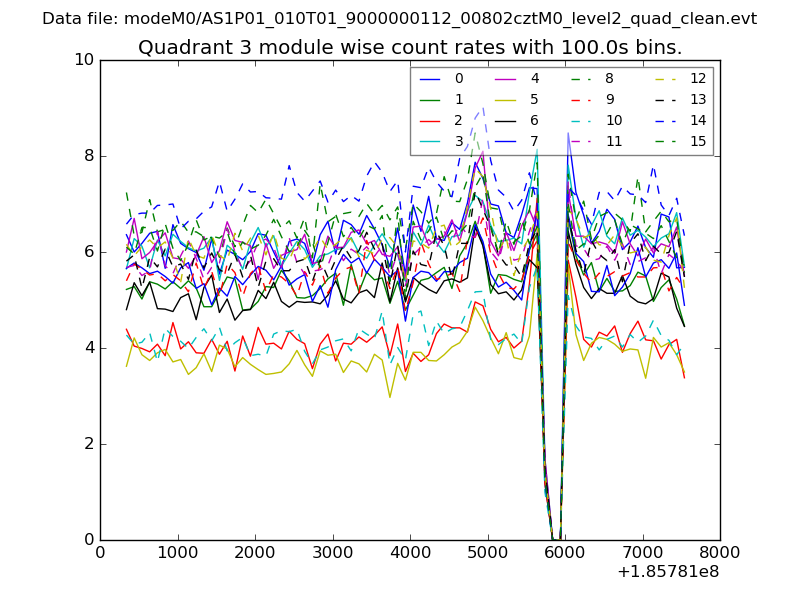
| Module-wise count rates for Quadrant C Data is divided into 100 sec bins |
 |
 |
| Module-wise count rates for Quadrant D Data is divided into 100 sec bins |
 |
 |
| Parameter | Plot |
|---|---|
| CZT HV Monitor | 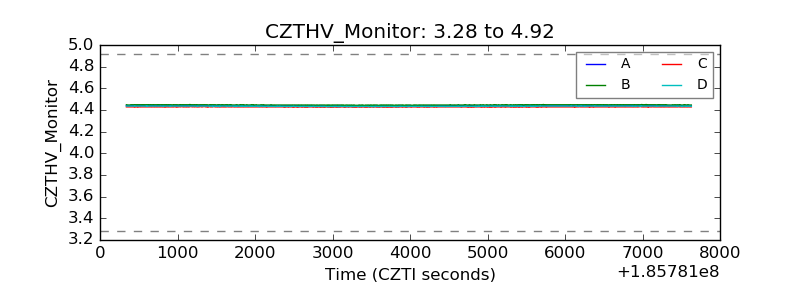 |
| D_VDD |  |
| Temperature 1 | 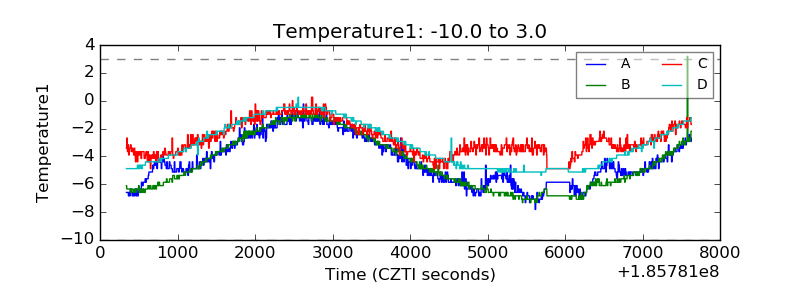 |
| Veto HV Monitor |  |
| Veto LLD | 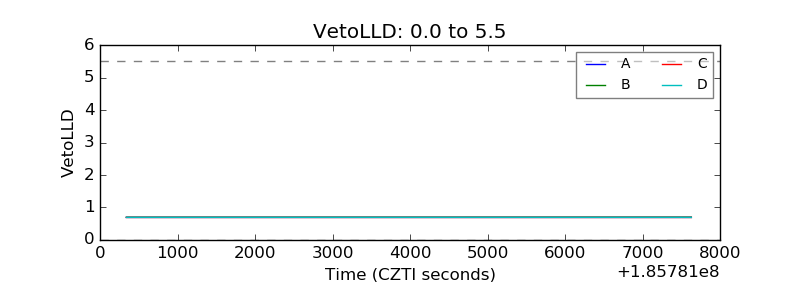 |
| Alpha Counter | 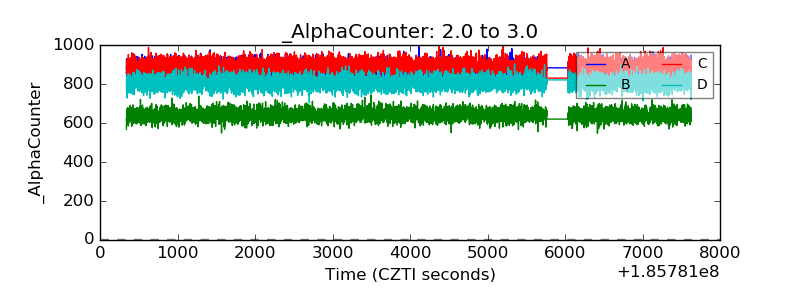 |
| _CPM_Rate | 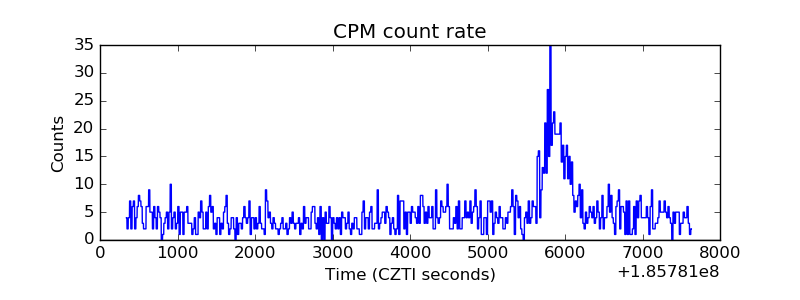 |
| CZT Counter | 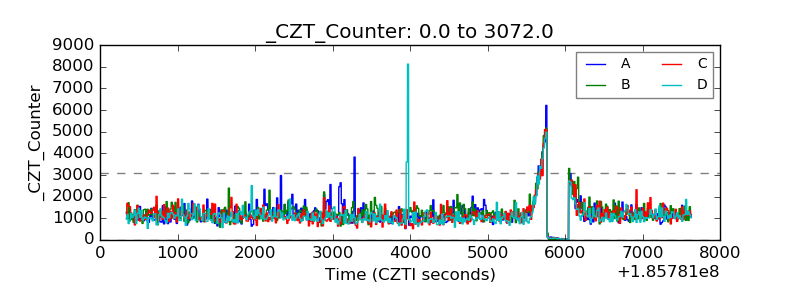 |
| +2.5 Volts monitor |  |
| +5 Volts monitor |  |
| _ROLL_ROT | 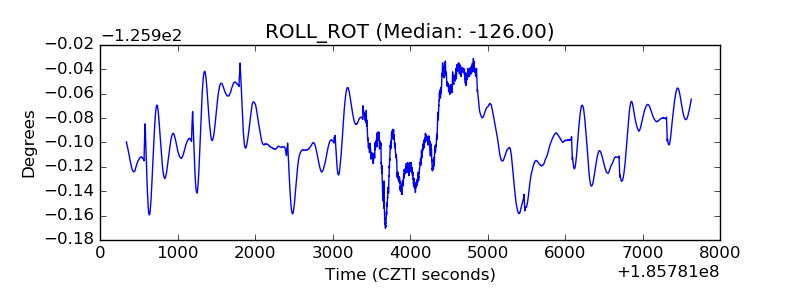 |
| _Roll_DEC | 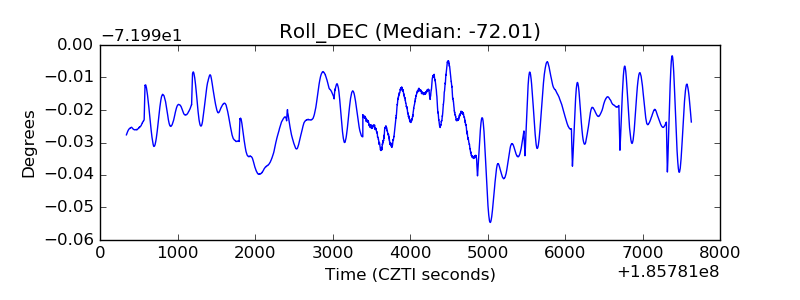 |
| _Roll_RA | 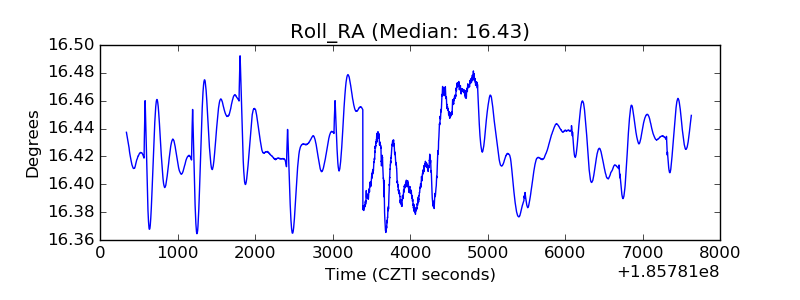 |
| Veto Counter | 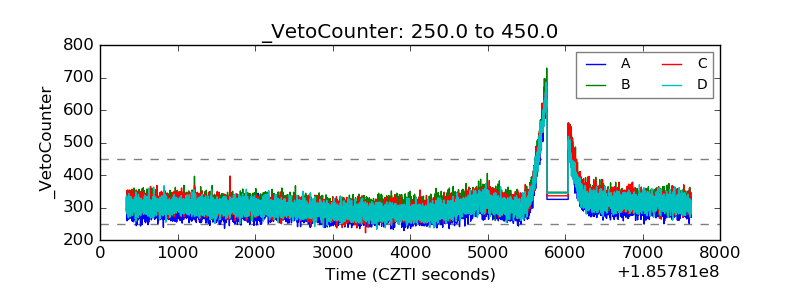 |