| Param | Original file | Final file |
|---|---|---|
| Filename | modeM0/AS1P01_010T01_9000000112_00803cztM0_level2.evt | modeM0/AS1P01_010T01_9000000112_00803cztM0_level2_quad_clean.evt |
| Size (bytes) | 543,251,520 | 45,141,120 |
| Size | 518.1 MB | 43.0 MB |
| Events in quadrant A | 3,710,716 | 290,523 |
| Events in quadrant B | 5,459,062 | 275,622 |
| Events in quadrant C | 3,444,086 | 294,086 |
| Events in quadrant D | 3,625,196 | 279,354 |
| Mode M0 | |||
|---|---|---|---|
| Quadrant | BADHDUFLAG | Total packets | Discarded packets |
| A | 0 | 13274 | 0 |
| B | 0 | 18517 | 0 |
| C | 0 | 12533 | 0 |
| D | 0 | 13076 | 0 |
| Mode SS | |||
|---|---|---|---|
| Quadrant | BADHDUFLAG | Total packets | Discarded packets |
| A | 0 | 64 | 0 |
| B | 0 | 64 | 0 |
| C | 0 | 64 | 0 |
| D | 0 | 64 | 0 |
| Quadrant | Total seconds | Saturated seconds | Saturation percentage |
|---|---|---|---|
| A | 3191 | 6 | 0.188029% |
| B | 3191 | 284 | 8.900031% |
| C | 3191 | 5 | 0.156691% |
| D | 3192 | 160 | 5.012531% |
Noise dominated data is calculated using 1-second bins in cleaned event files. If a bin has >2000 counts, and if more than 50% of those come from <1% of pixels, then it is considered to be noise-dominated and hence unusable.
| Quadrant | # 1 sec bins | Bins with >0 counts | Bins with >2000 counts | High rate bins dominated by noise | Noise dominated (total time) | Noise dominated (detector-on time) | Marked lightcurve |
|---|---|---|---|---|---|---|---|
| A | 3191 | 3191 | 47 | 47 | 1.47% | 1.47% | 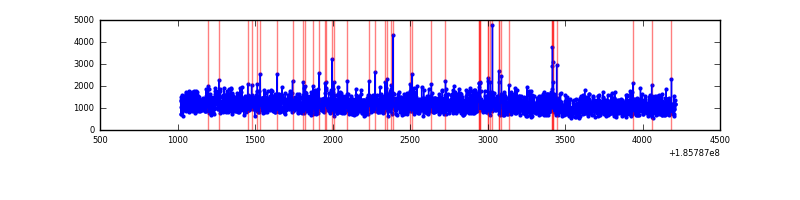 |
| B | 3191 | 3191 | 1107 | 1107 | 34.69% | 34.69% | 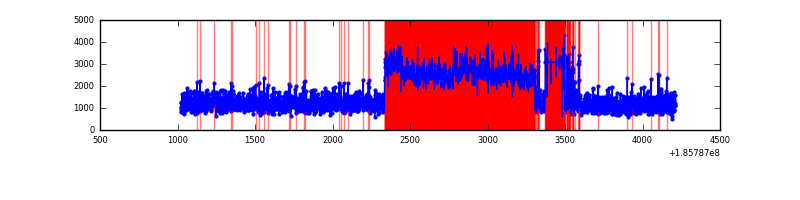 |
| C | 3191 | 3191 | 26 | 26 | 0.81% | 0.81% | 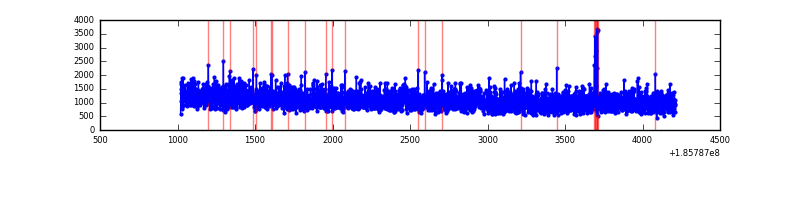 |
| D | 3192 | 3192 | 171 | 171 | 5.36% | 5.36% | 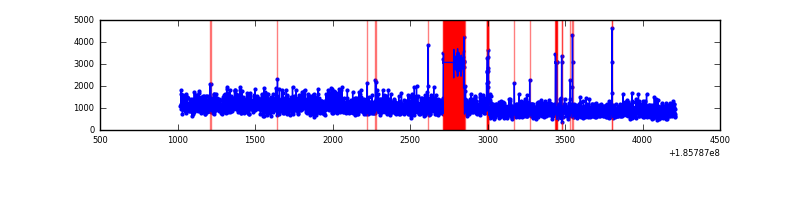 |
Top three noisy pixels from each quadrant. If the there are fewer than three noisy pixels in the level2.evt file, extra rows are filled as -1
| Pixel properties | Quadrant properties | ||||||
|---|---|---|---|---|---|---|---|
| Quadrant | DetID | PixID | Counts | Sigma | Mean | Median | Sigma |
| A | 14 | 79 | 33391 | 142.4 | 941 | 950 | 227.8 |
| A | 15 | 233 | 32292 | 137.58 | 941 | 950 | 227.8 |
| A | 8 | 192 | 22957 | 96.6 | 941 | 950 | 227.8 |
| B | 15 | 223 | 1330457 | 5912.4 | 930 | 935 | 224.9 |
| B | 5 | 191 | 450961 | 2001.27 | 930 | 935 | 224.9 |
| B | 15 | 22 | 52622 | 229.85 | 930 | 935 | 224.9 |
| C | 9 | 52 | 52995 | 219.63 | 844 | 871 | 237.3 |
| C | 15 | 241 | 27214 | 111.0 | 844 | 871 | 237.3 |
| C | 3 | 79 | 23489 | 95.3 | 844 | 871 | 237.3 |
| D | 11 | 131 | 342785 | 1306.43 | 825 | 851 | 261.7 |
| D | 13 | 25 | 73991 | 279.45 | 825 | 851 | 261.7 |
| D | 1 | 4 | 40786 | 152.58 | 825 | 851 | 261.7 |
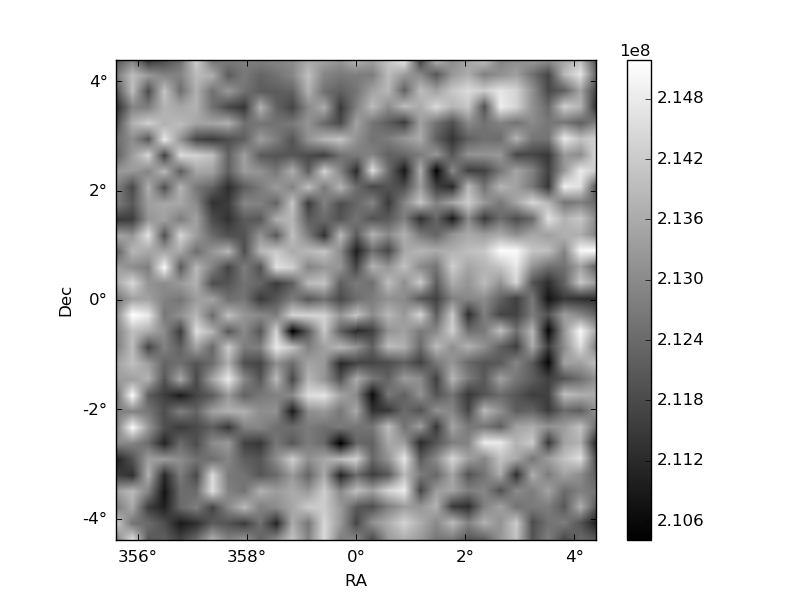
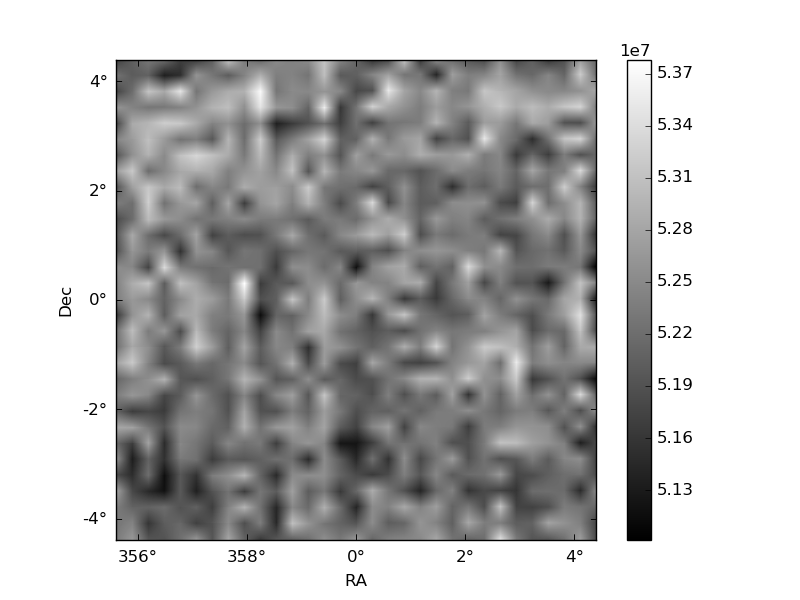
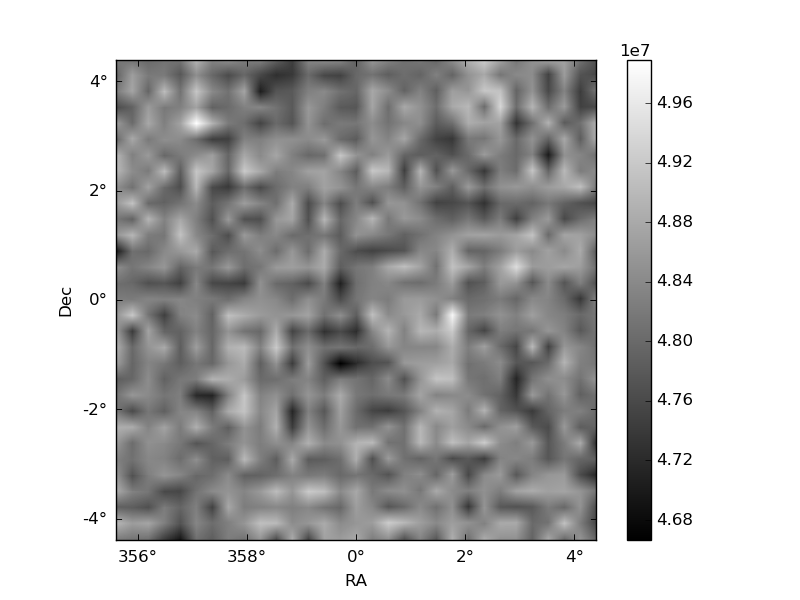
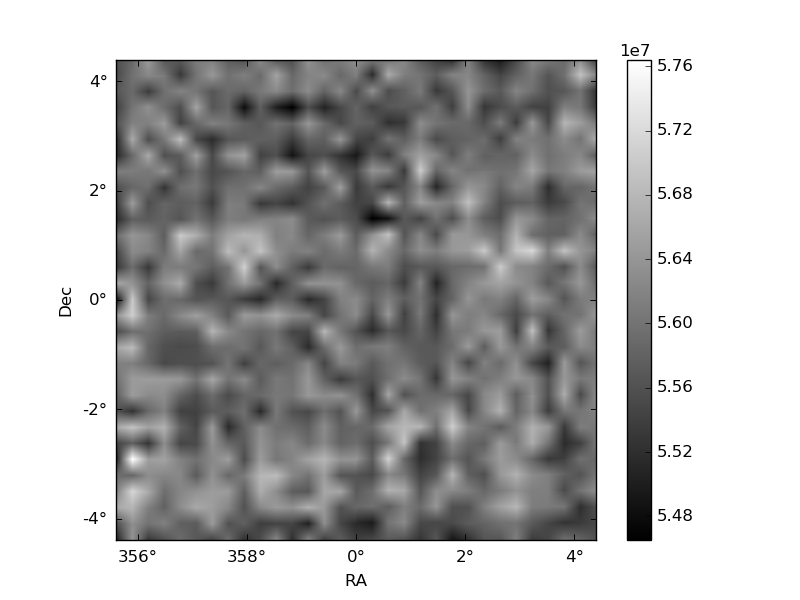
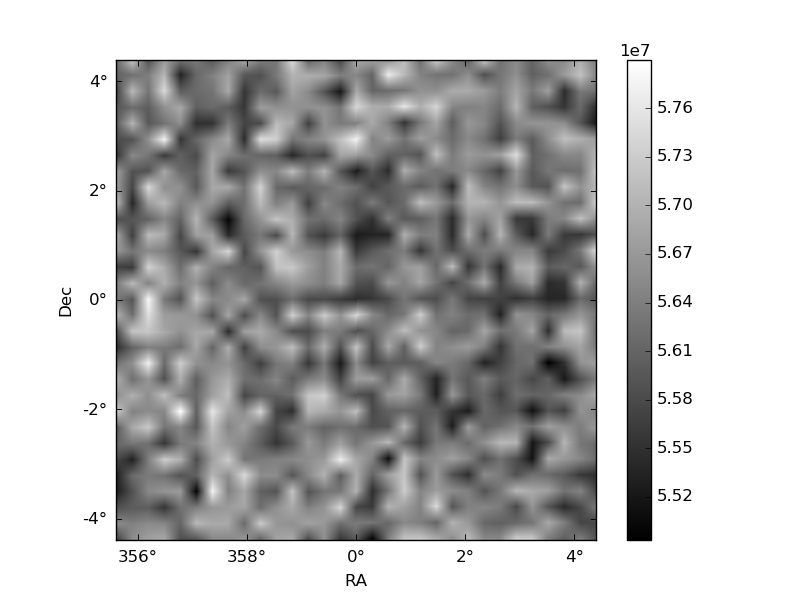
Histogram calculated using DETX and DETY for each event in the final _common_clean file
| Quadrant A | 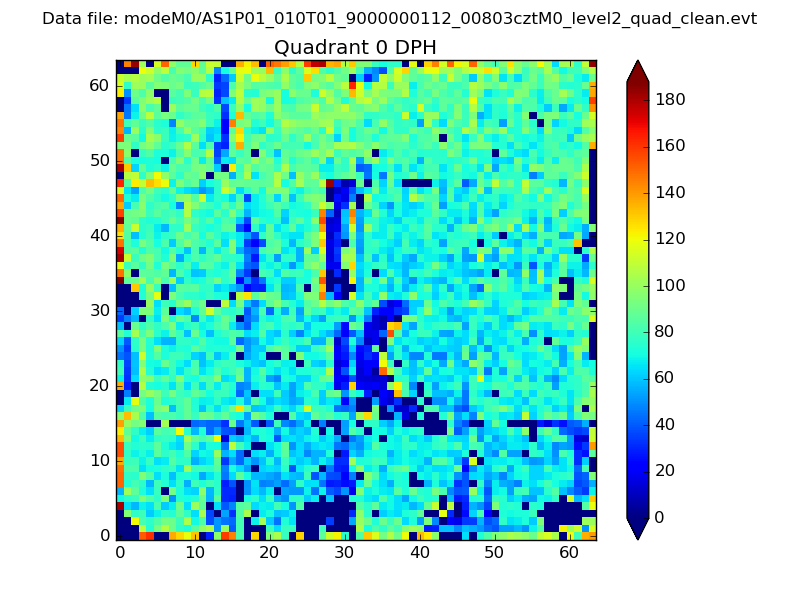 |
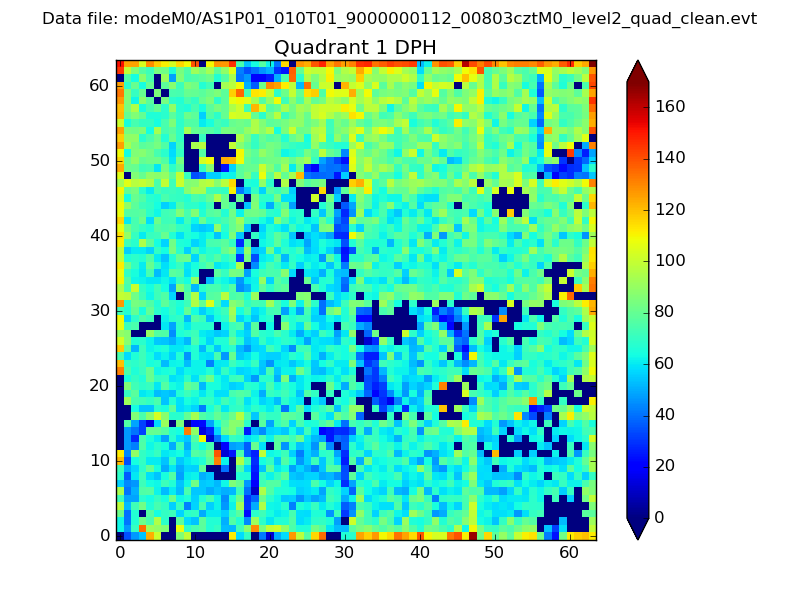 |
Quadrant B |
|---|---|---|---|
| Quadrant D | 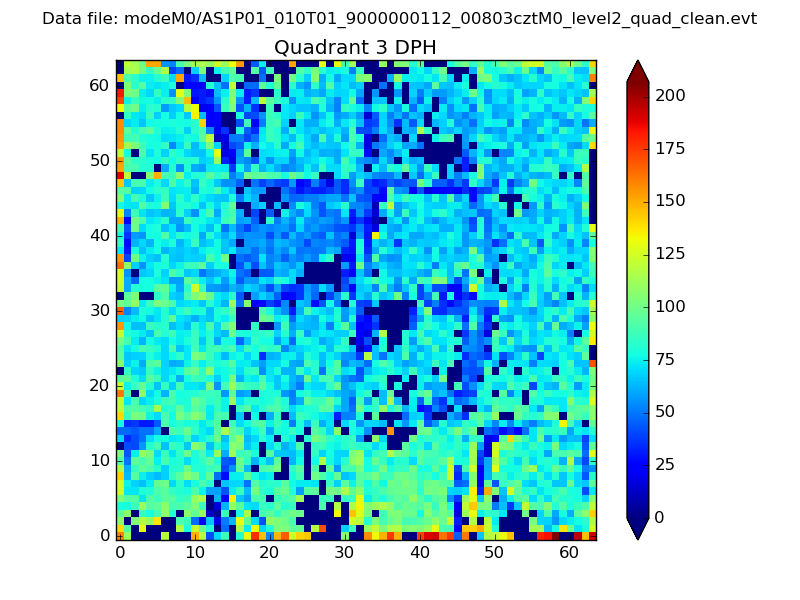 |
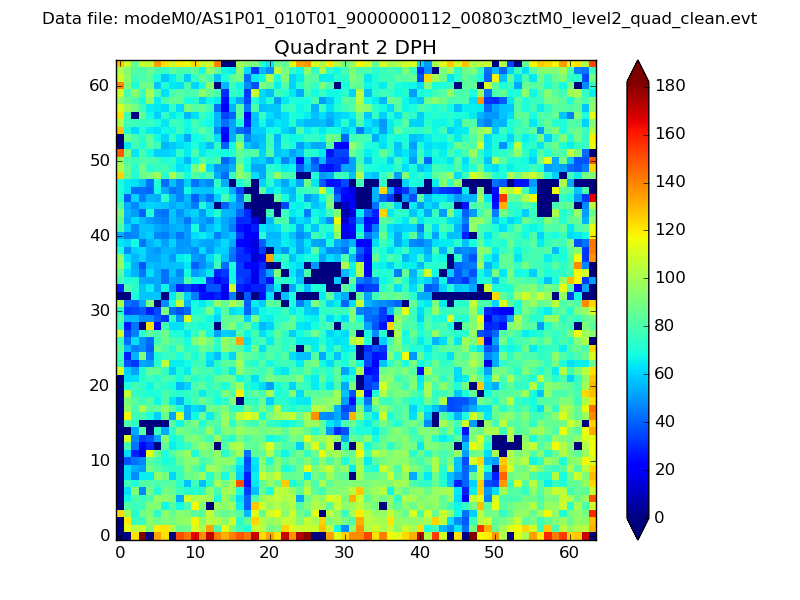 |
Quadrant C |
| Plot type | Count rate plots | Images |
|---|---|---|
| Comparison with Poisson distribution Blue bars denote a histogram of data divided into 1 sec bins. Red curve is a Poisson curve with rate = median count rate of data. |
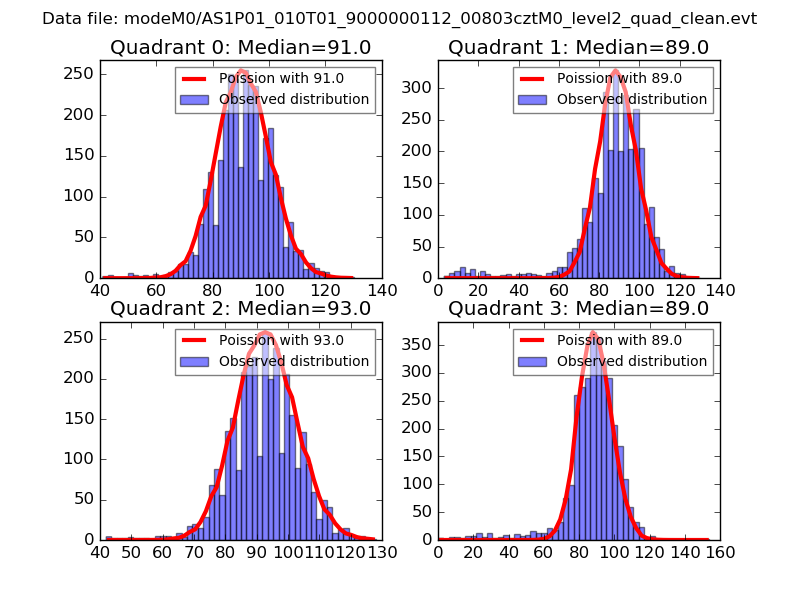 |
 |
| Quadrant-wise count rates Data is divided into 100 sec bins |
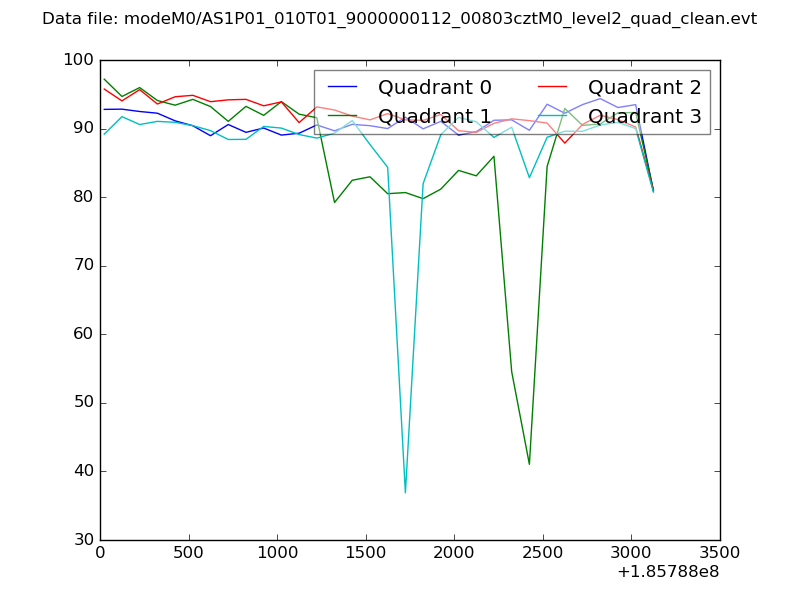 |
|
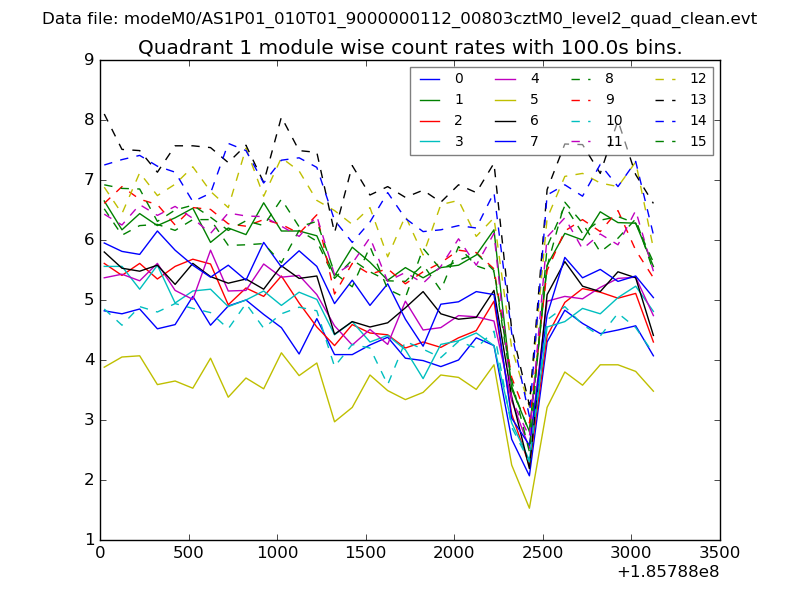
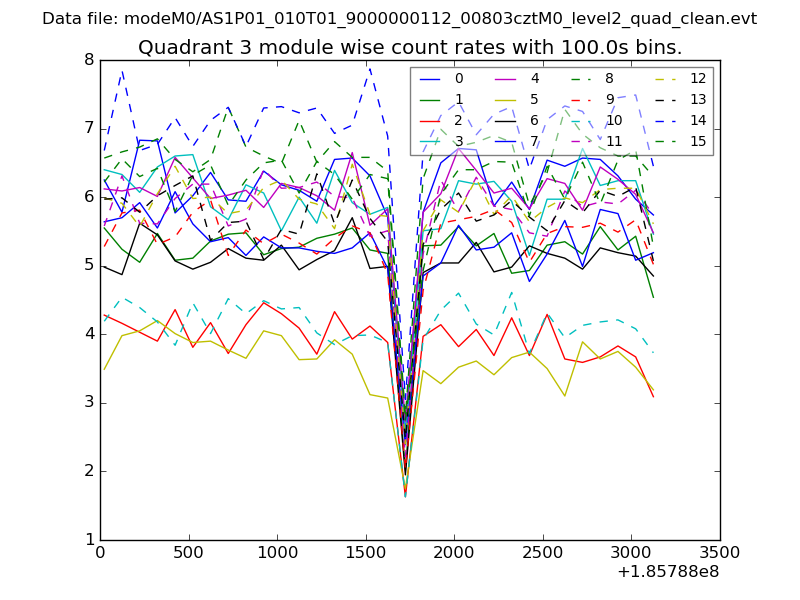
| Module-wise count rates for Quadrant A Data is divided into 100 sec bins |
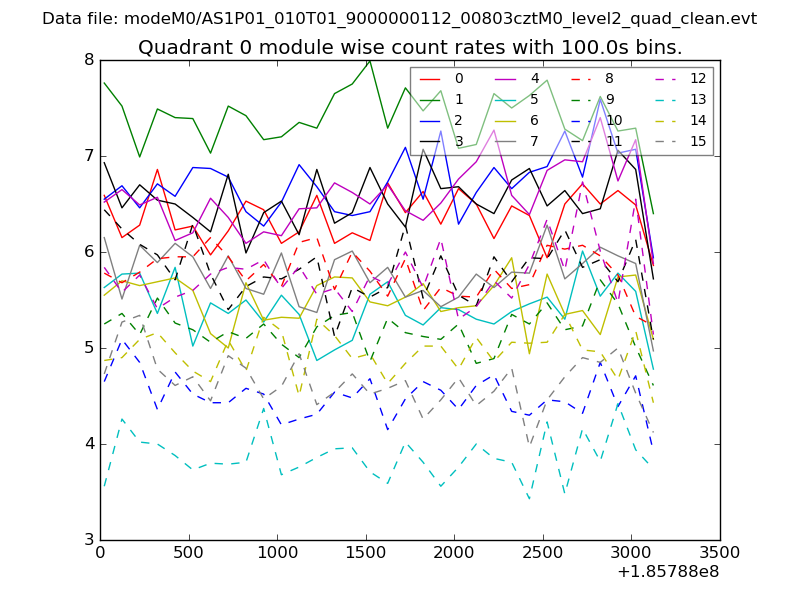 |
 |
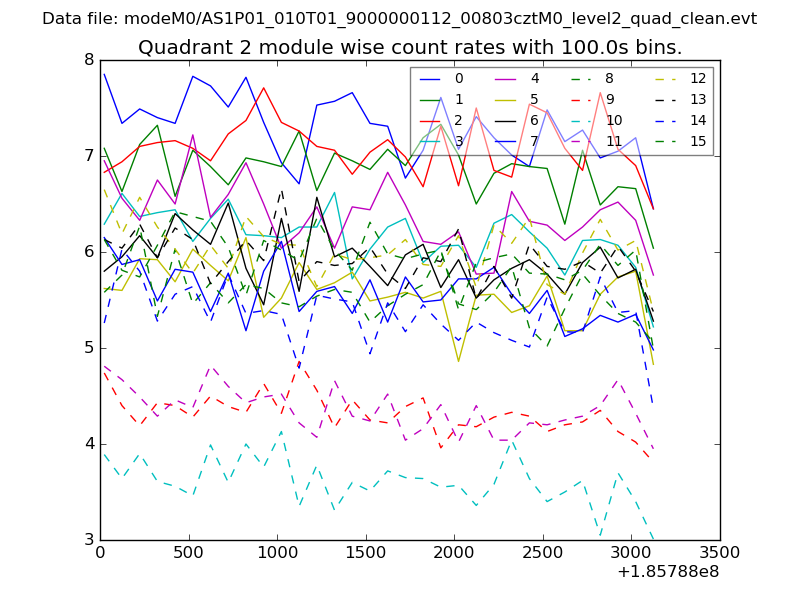
| Module-wise count rates for Quadrant B Data is divided into 100 sec bins |
 |
 |
| Module-wise count rates for Quadrant C Data is divided into 100 sec bins |
 |
 |
| Module-wise count rates for Quadrant D Data is divided into 100 sec bins |
 |
 |
| Parameter | Plot |
|---|---|
| CZT HV Monitor | 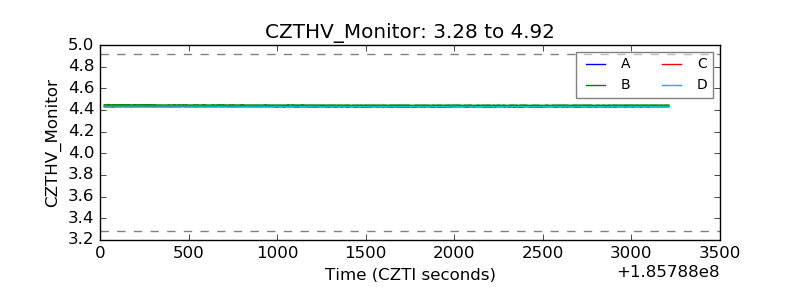 |
| D_VDD | 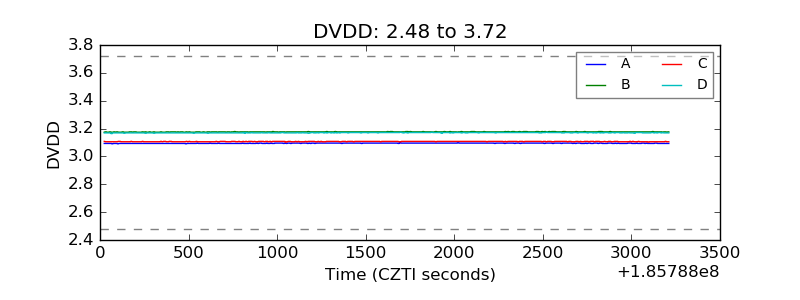 |
| Temperature 1 |  |
| Veto HV Monitor | 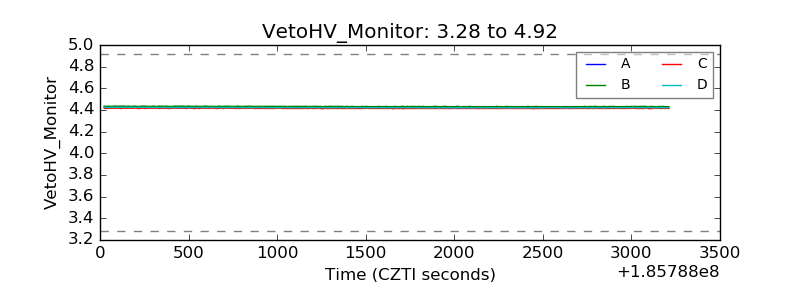 |
| Veto LLD | 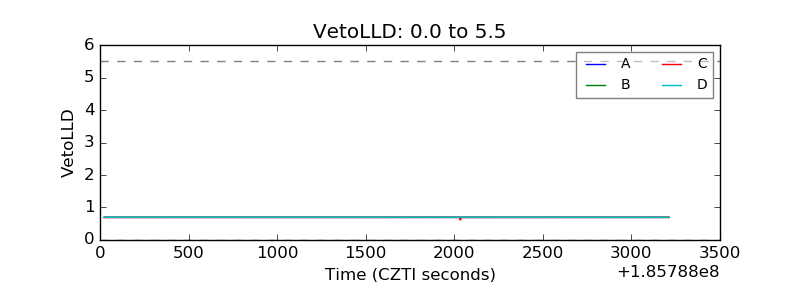 |
| Alpha Counter | 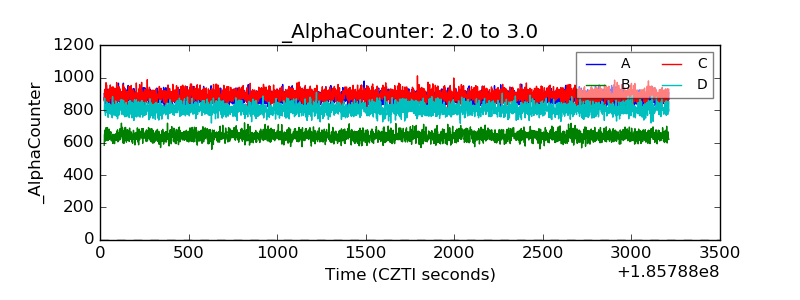 |
| _CPM_Rate | 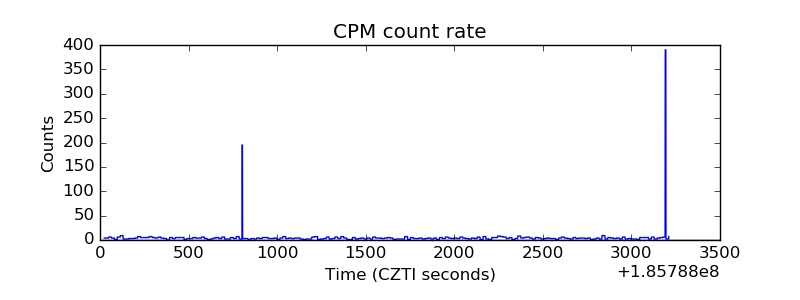 |
| CZT Counter | 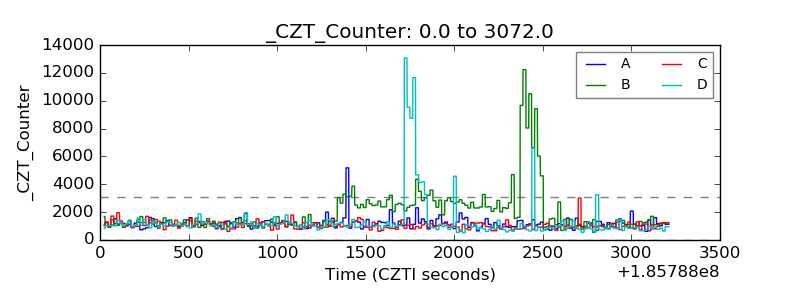 |
| +2.5 Volts monitor |  |
| +5 Volts monitor |  |
| _ROLL_ROT | 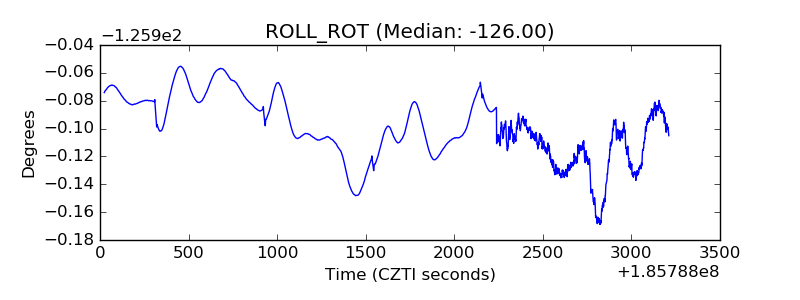 |
| _Roll_DEC | 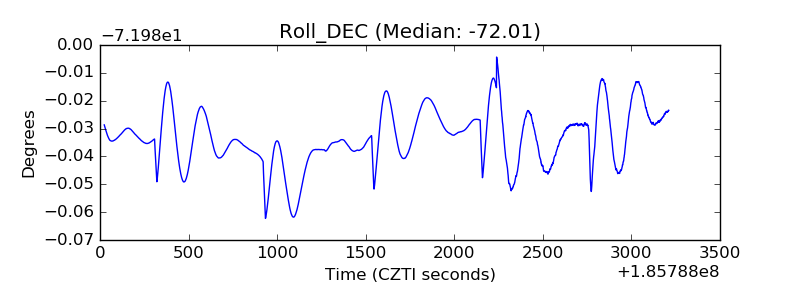 |
| _Roll_RA | 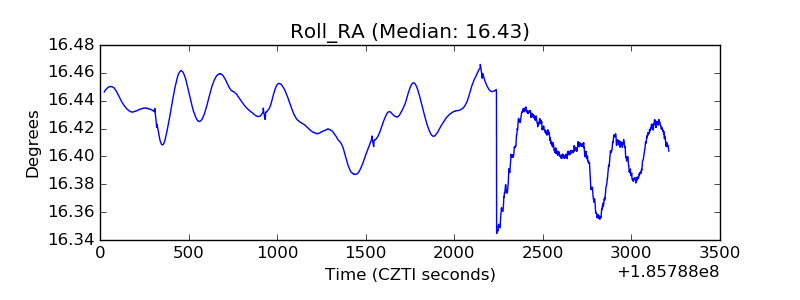 |
| Veto Counter | 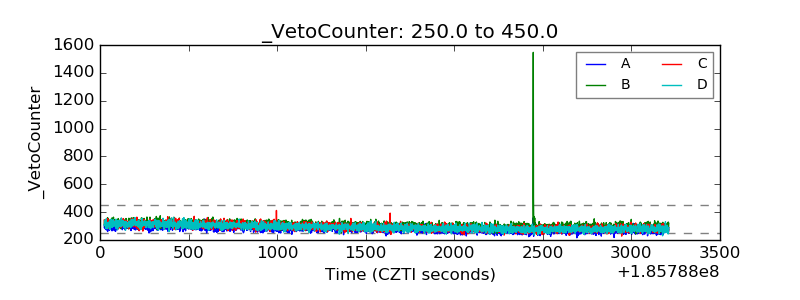 |