| Param | Original file | Final file |
|---|---|---|
| Filename | modeM0/AS1P01_010T01_9000000112_00804cztM0_level2.evt | modeM0/AS1P01_010T01_9000000112_00804cztM0_level2_quad_clean.evt |
| Size (bytes) | 1,074,049,920 | 101,773,440 |
| Size | 1.0 GB | 97.1 MB |
| Events in quadrant A | 8,090,761 | 660,936 |
| Events in quadrant B | 8,634,673 | 654,888 |
| Events in quadrant C | 7,867,687 | 649,398 |
| Events in quadrant D | 7,473,357 | 632,987 |
| Mode M9 | |||
|---|---|---|---|
| Quadrant | BADHDUFLAG | Total packets | Discarded packets |
| A | 0 | 6 | 0 |
| B | 0 | 6 | 0 |
| C | 0 | 6 | 0 |
| D | 0 | 6 | 0 |
| Mode M0 | |||
|---|---|---|---|
| Quadrant | BADHDUFLAG | Total packets | Discarded packets |
| A | 0 | 28941 | 0 |
| B | 0 | 30558 | 0 |
| C | 0 | 28356 | 0 |
| D | 0 | 27201 | 0 |
| Mode SS | |||
|---|---|---|---|
| Quadrant | BADHDUFLAG | Total packets | Discarded packets |
| A | 0 | 140 | 0 |
| B | 0 | 140 | 0 |
| C | 0 | 140 | 0 |
| D | 0 | 140 | 0 |
| Quadrant | Total seconds | Saturated seconds | Saturation percentage |
|---|---|---|---|
| A | 6950 | 57 | 0.820144% |
| B | 6951 | 73 | 1.050209% |
| C | 6951 | 58 | 0.834412% |
| D | 6951 | 144 | 2.071644% |
Noise dominated data is calculated using 1-second bins in cleaned event files. If a bin has >2000 counts, and if more than 50% of those come from <1% of pixels, then it is considered to be noise-dominated and hence unusable.
| Quadrant | # 1 sec bins | Bins with >0 counts | Bins with >2000 counts | High rate bins dominated by noise | Noise dominated (total time) | Noise dominated (detector-on time) | Marked lightcurve |
|---|---|---|---|---|---|---|---|
| A | 7515 | 6951 | 207 | 207 | 2.75% | 2.98% | 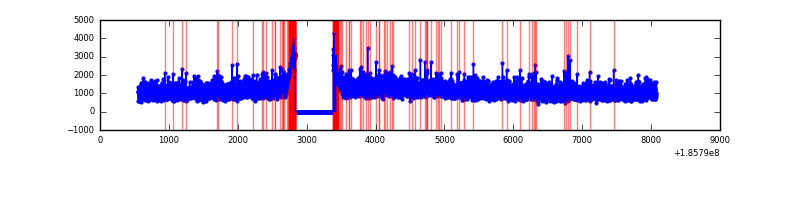 |
| B | 7516 | 6952 | 262 | 262 | 3.49% | 3.77% | 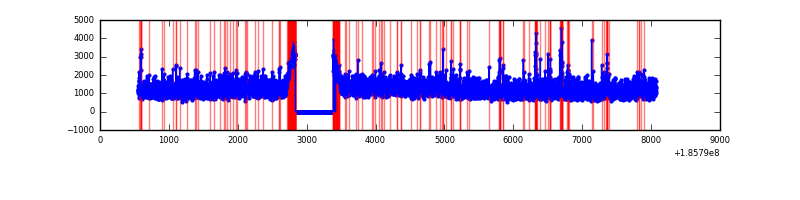 |
| C | 7516 | 6952 | 196 | 196 | 2.61% | 2.82% | 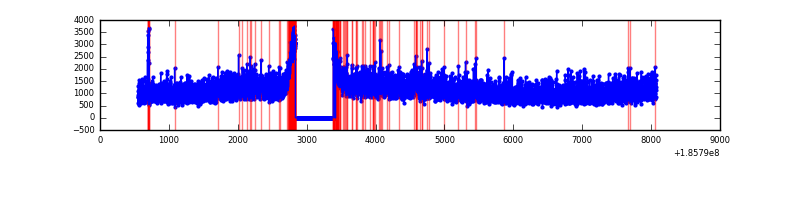 |
| D | 7516 | 6953 | 244 | 244 | 3.25% | 3.51% | 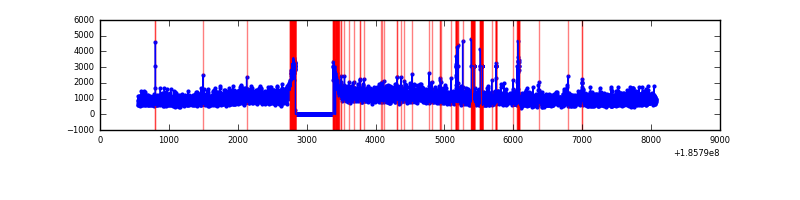 |
Top three noisy pixels from each quadrant. If the there are fewer than three noisy pixels in the level2.evt file, extra rows are filled as -1
| Pixel properties | Quadrant properties | ||||||
|---|---|---|---|---|---|---|---|
| Quadrant | DetID | PixID | Counts | Sigma | Mean | Median | Sigma |
| A | 14 | 79 | 80318 | 155.55 | 2078 | 2094 | 502.9 |
| A | 0 | 214 | 13313 | 22.31 | 2078 | 2094 | 502.9 |
| A | 15 | 233 | 13260 | 22.2 | 2078 | 2094 | 502.9 |
| B | 5 | 191 | 77958 | 147.01 | 2193 | 2200 | 515.3 |
| B | 0 | 23 | 74360 | 140.02 | 2193 | 2200 | 515.3 |
| B | 15 | 22 | 49002 | 90.82 | 2193 | 2200 | 515.3 |
| C | 15 | 241 | 52422 | 92.05 | 1954 | 2018 | 547.6 |
| C | 3 | 111 | 41960 | 72.94 | 1954 | 2018 | 547.6 |
| C | 3 | 79 | 40314 | 69.94 | 1954 | 2018 | 547.6 |
| D | 13 | 25 | 244158 | 412.14 | 1874 | 1936 | 587.7 |
| D | 12 | 188 | 110096 | 184.04 | 1874 | 1936 | 587.7 |
| D | 1 | 4 | 47961 | 78.31 | 1874 | 1936 | 587.7 |
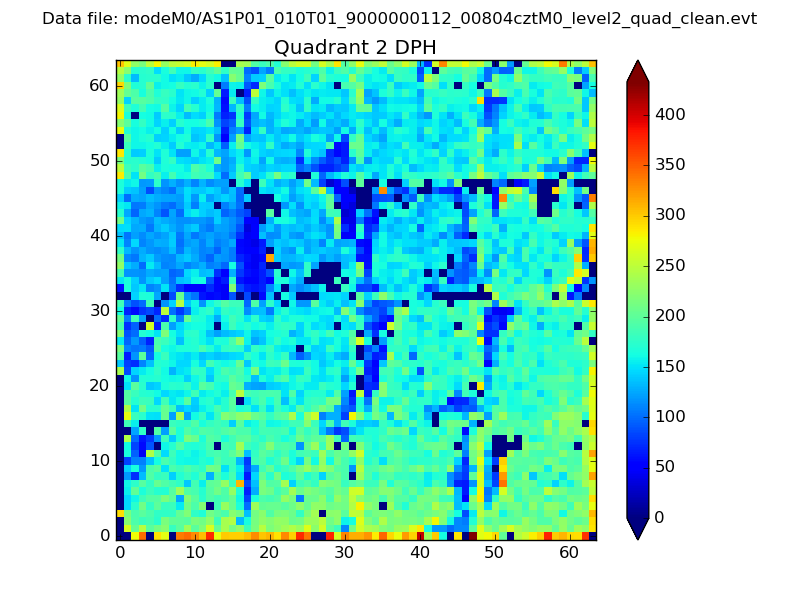
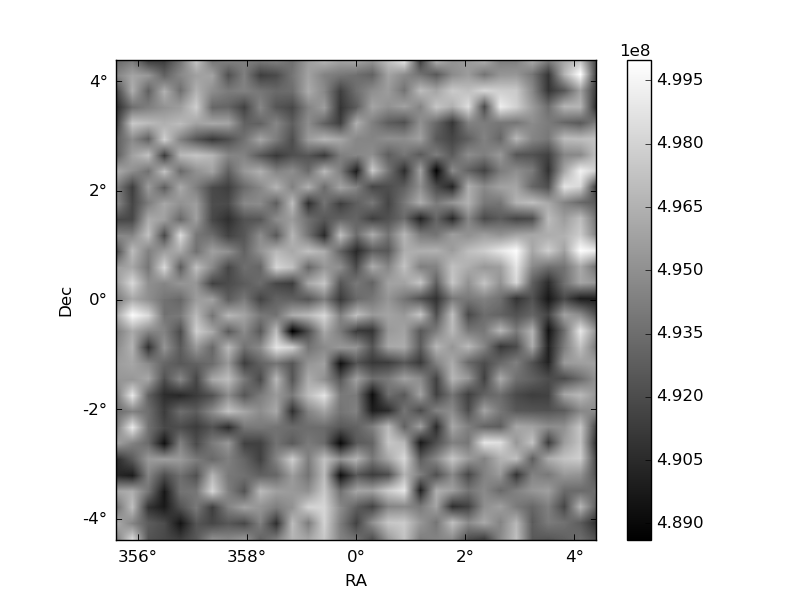
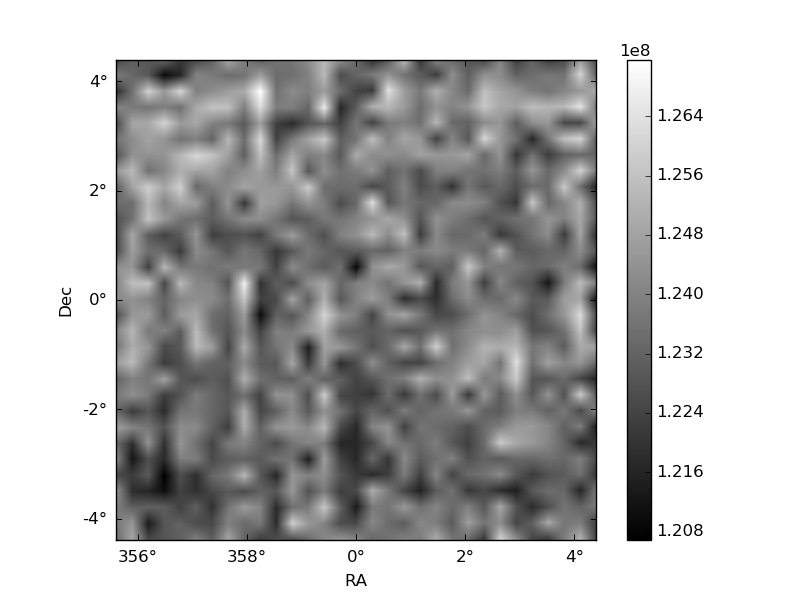
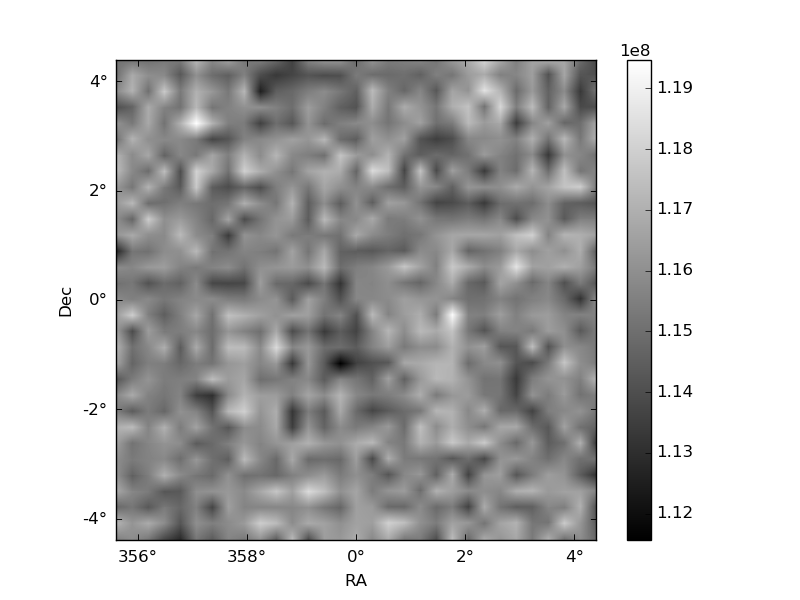
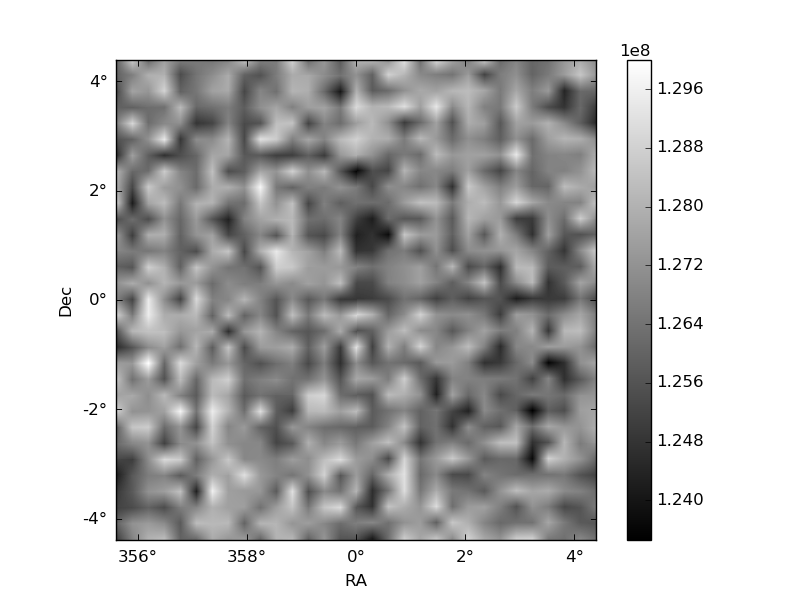
Histogram calculated using DETX and DETY for each event in the final _common_clean file
| Quadrant A | 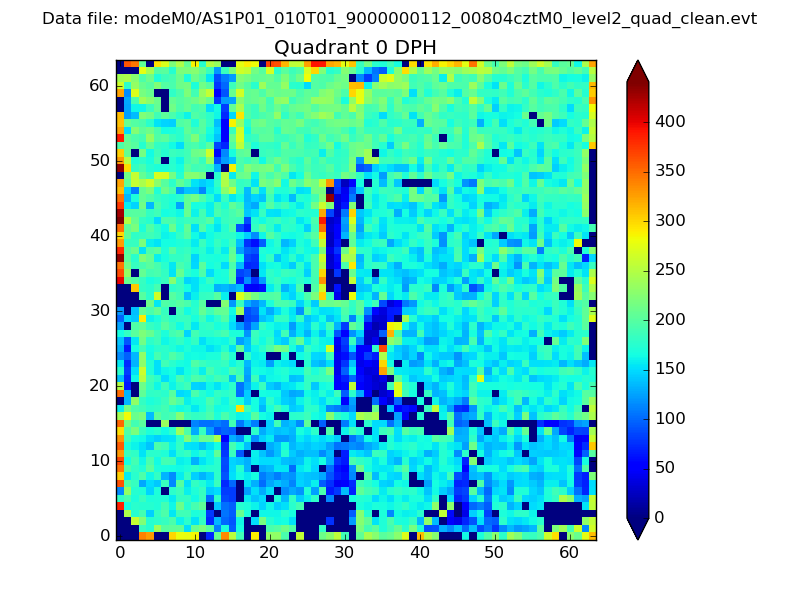 |
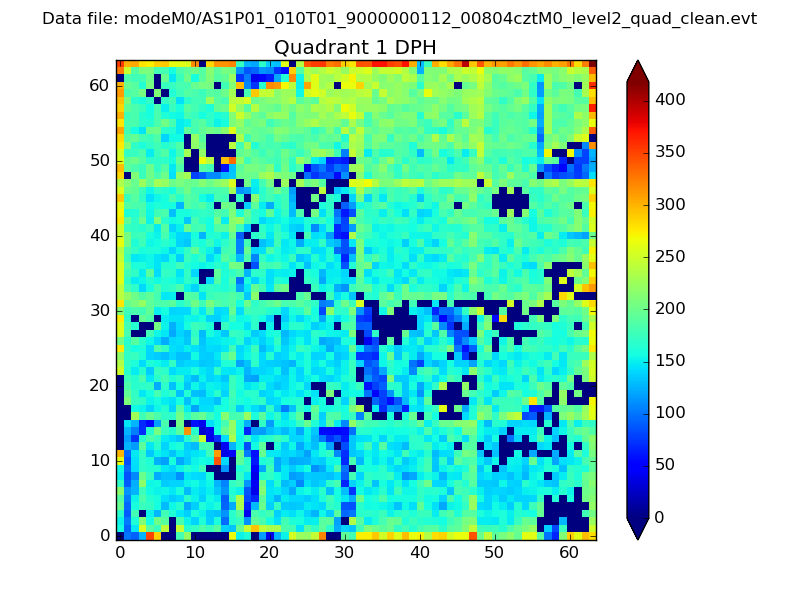 |
Quadrant B |
|---|---|---|---|
| Quadrant D | 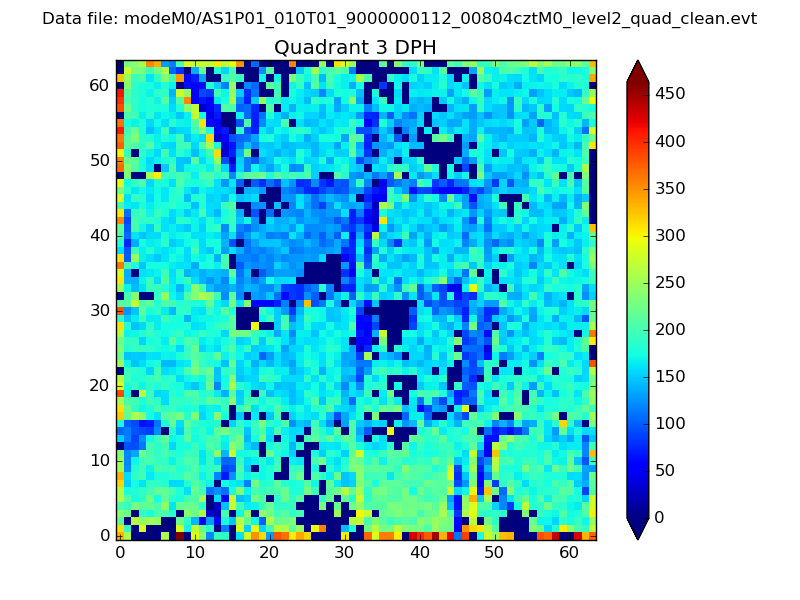 |
 |
Quadrant C |
| Plot type | Count rate plots | Images |
|---|---|---|
| Comparison with Poisson distribution Blue bars denote a histogram of data divided into 1 sec bins. Red curve is a Poisson curve with rate = median count rate of data. |
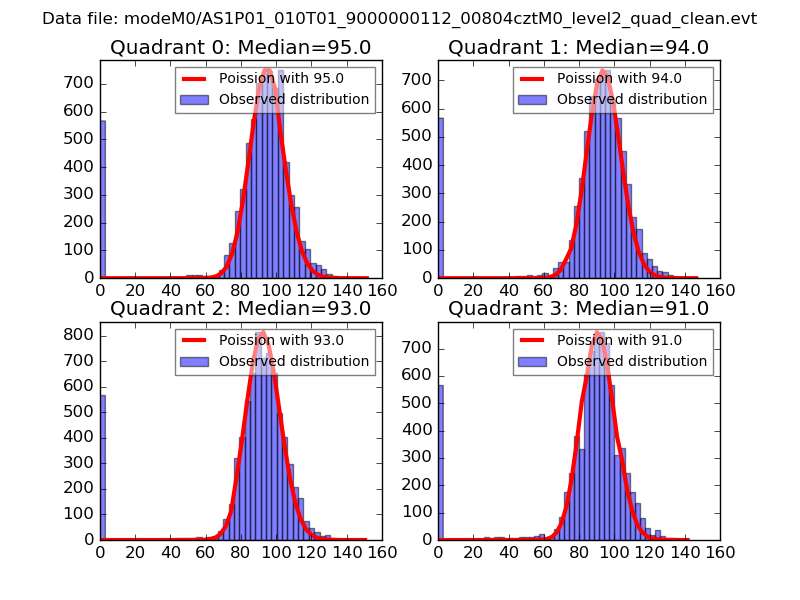 |
 |
| Quadrant-wise count rates Data is divided into 100 sec bins |
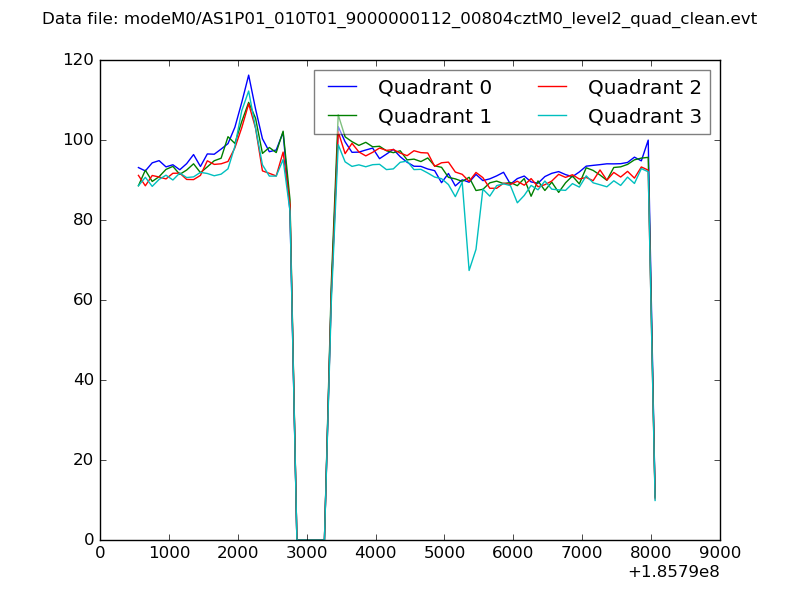 |
|
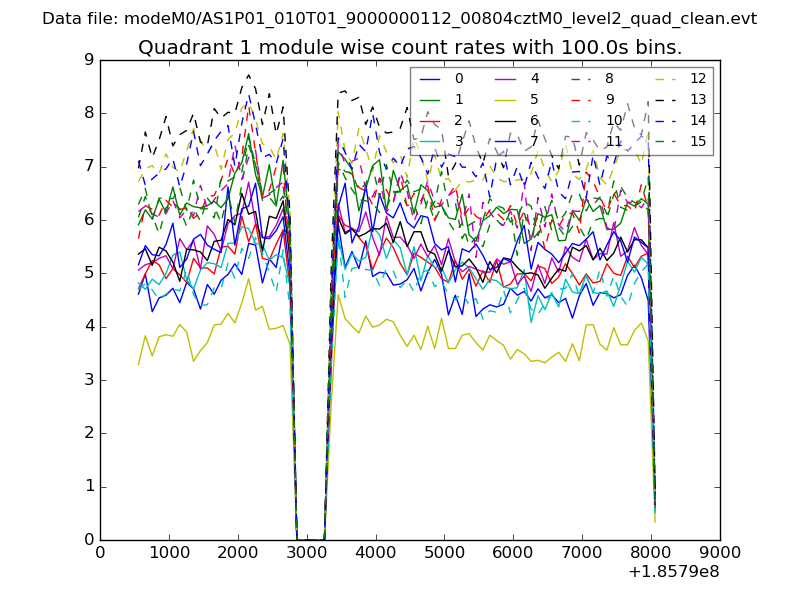
| Module-wise count rates for Quadrant A Data is divided into 100 sec bins |
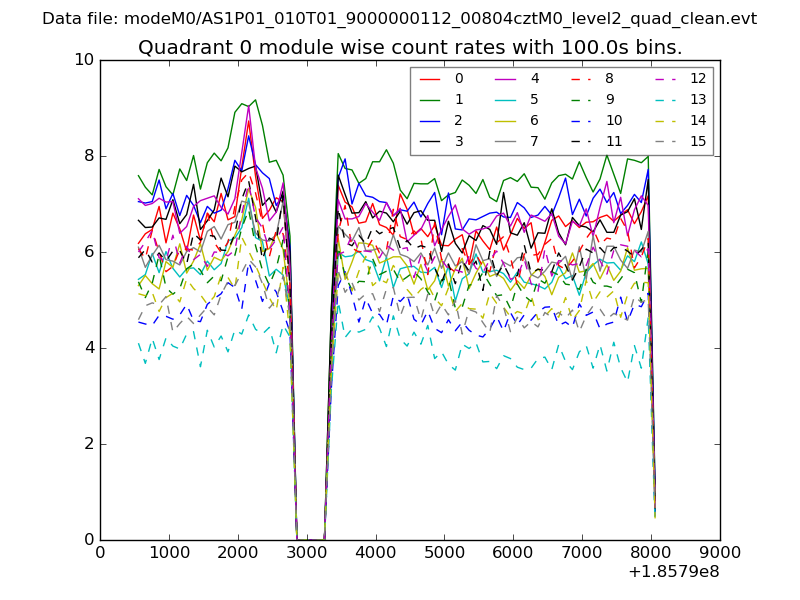 |
 |
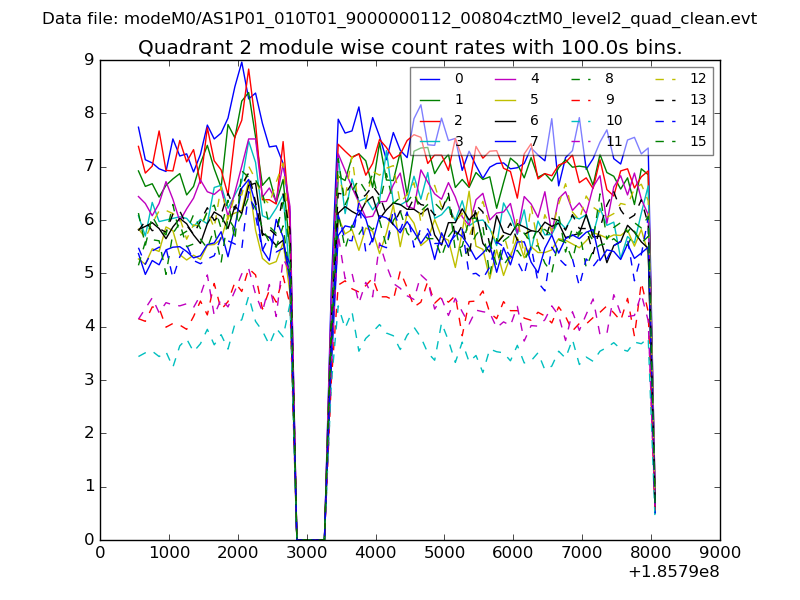
| Module-wise count rates for Quadrant B Data is divided into 100 sec bins |
 |
 |
| Module-wise count rates for Quadrant C Data is divided into 100 sec bins |
 |
 |
| Module-wise count rates for Quadrant D Data is divided into 100 sec bins |
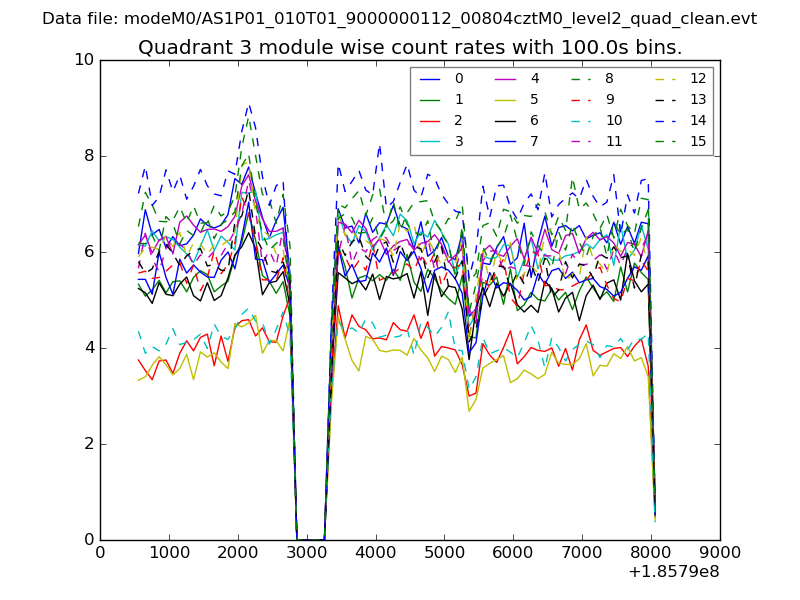 |
 |
| Parameter | Plot |
|---|---|
| CZT HV Monitor | 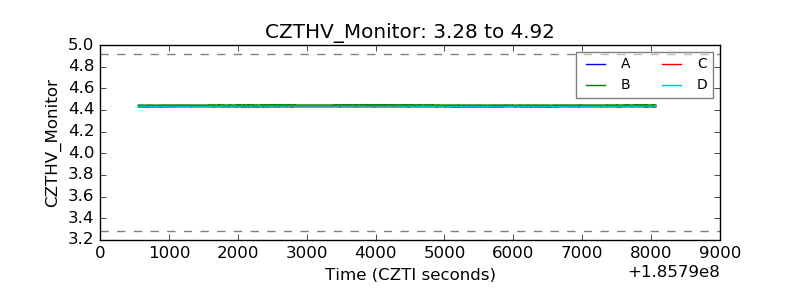 |
| D_VDD | 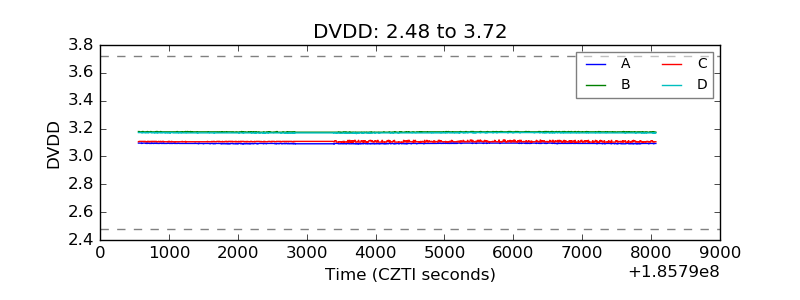 |
| Temperature 1 |  |
| Veto HV Monitor | 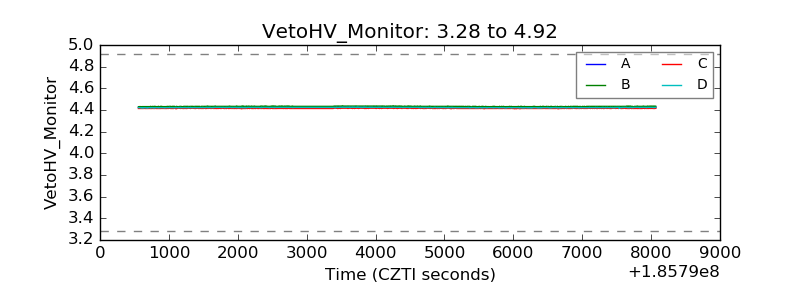 |
| Veto LLD | 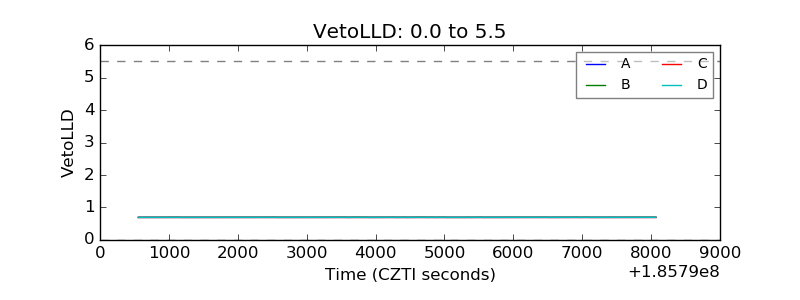 |
| Alpha Counter | 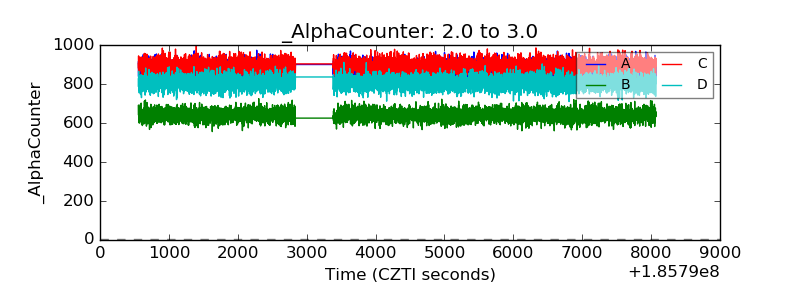 |
| _CPM_Rate | 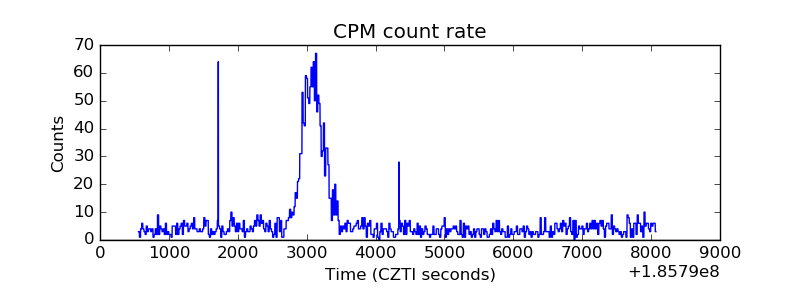 |
| CZT Counter | 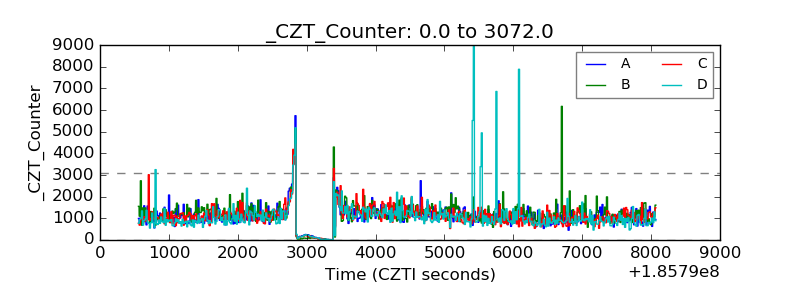 |
| +2.5 Volts monitor |  |
| +5 Volts monitor |  |
| _ROLL_ROT | 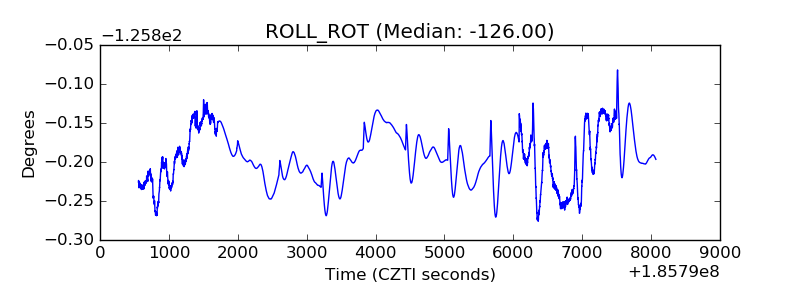 |
| _Roll_DEC |  |
| _Roll_RA | 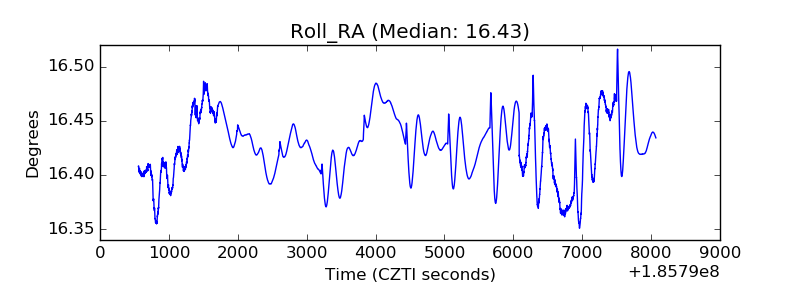 |
| Veto Counter | 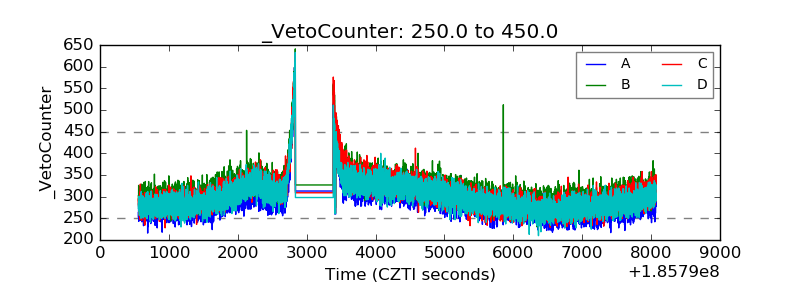 |