| Param | Original file | Final file |
|---|---|---|
| Filename | modeM0/AS1P01_010T01_9000000112_00805cztM0_level2.evt | modeM0/AS1P01_010T01_9000000112_00805cztM0_level2_quad_clean.evt |
| Size (bytes) | 1,352,695,680 | 127,523,520 |
| Size | 1.3 GB | 121.6 MB |
| Events in quadrant A | 10,221,262 | 828,953 |
| Events in quadrant B | 10,697,987 | 829,616 |
| Events in quadrant C | 10,102,003 | 812,570 |
| Events in quadrant D | 9,387,327 | 805,779 |
| Mode M9 | |||
|---|---|---|---|
| Quadrant | BADHDUFLAG | Total packets | Discarded packets |
| A | 0 | 16 | 0 |
| B | 0 | 16 | 0 |
| C | 0 | 16 | 0 |
| D | 0 | 16 | 0 |
| Mode M0 | |||
|---|---|---|---|
| Quadrant | BADHDUFLAG | Total packets | Discarded packets |
| A | 0 | 36346 | 0 |
| B | 0 | 37812 | 0 |
| C | 0 | 36032 | 0 |
| D | 0 | 33925 | 0 |
| Mode SS | |||
|---|---|---|---|
| Quadrant | BADHDUFLAG | Total packets | Discarded packets |
| A | 0 | 176 | 0 |
| B | 0 | 176 | 0 |
| C | 0 | 176 | 0 |
| D | 0 | 176 | 0 |
| Quadrant | Total seconds | Saturated seconds | Saturation percentage |
|---|---|---|---|
| A | 8417 | 65 | 0.772247% |
| B | 8417 | 62 | 0.736604% |
| C | 8417 | 70 | 0.831650% |
| D | 8417 | 61 | 0.724724% |
Noise dominated data is calculated using 1-second bins in cleaned event files. If a bin has >2000 counts, and if more than 50% of those come from <1% of pixels, then it is considered to be noise-dominated and hence unusable.
| Quadrant | # 1 sec bins | Bins with >0 counts | Bins with >2000 counts | High rate bins dominated by noise | Noise dominated (total time) | Noise dominated (detector-on time) | Marked lightcurve |
|---|---|---|---|---|---|---|---|
| A | 10127 | 8418 | 302 | 302 | 2.98% | 3.59% | 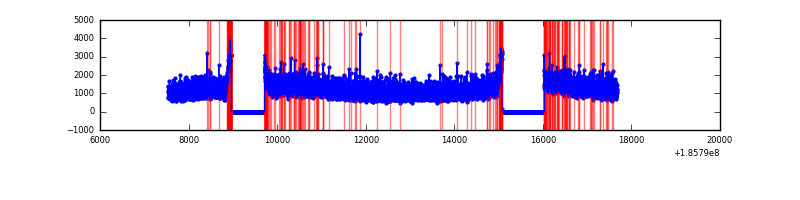 |
| B | 10127 | 8418 | 344 | 344 | 3.40% | 4.09% | 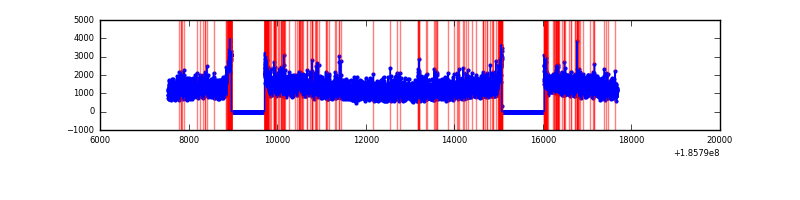 |
| C | 10127 | 8418 | 315 | 315 | 3.11% | 3.74% | 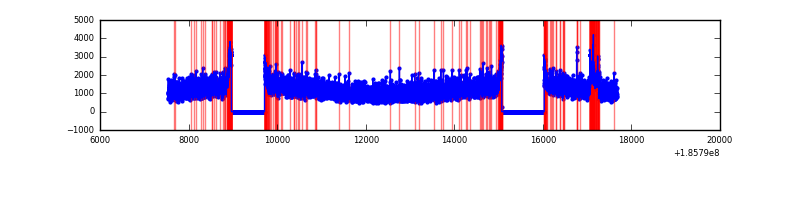 |
| D | 10127 | 8418 | 227 | 227 | 2.24% | 2.70% | 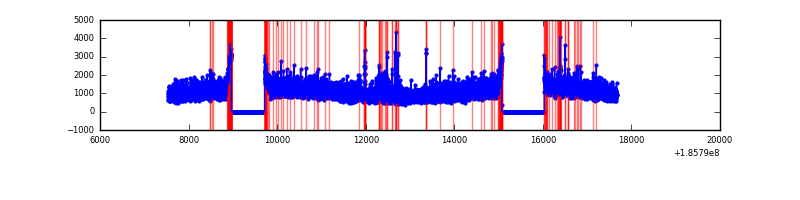 |
Top three noisy pixels from each quadrant. If the there are fewer than three noisy pixels in the level2.evt file, extra rows are filled as -1
| Pixel properties | Quadrant properties | ||||||
|---|---|---|---|---|---|---|---|
| Quadrant | DetID | PixID | Counts | Sigma | Mean | Median | Sigma |
| A | 15 | 17 | 28686 | 40.88 | 2634 | 2653 | 636.8 |
| A | 15 | 233 | 27209 | 38.56 | 2634 | 2653 | 636.8 |
| A | 14 | 79 | 24898 | 34.93 | 2634 | 2653 | 636.8 |
| B | 15 | 22 | 101964 | 153.2 | 2737 | 2747 | 647.6 |
| B | 0 | 23 | 49919 | 72.84 | 2737 | 2747 | 647.6 |
| B | 0 | 220 | 47060 | 68.42 | 2737 | 2747 | 647.6 |
| C | 9 | 52 | 178315 | 254.17 | 2482 | 2564 | 691.5 |
| C | 15 | 241 | 55129 | 76.02 | 2482 | 2564 | 691.5 |
| C | 9 | 83 | 49078 | 67.27 | 2482 | 2564 | 691.5 |
| D | 13 | 170 | 99954 | 130.26 | 2425 | 2511 | 748.0 |
| D | 1 | 4 | 55800 | 71.24 | 2425 | 2511 | 748.0 |
| D | 13 | 13 | 36813 | 45.86 | 2425 | 2511 | 748.0 |
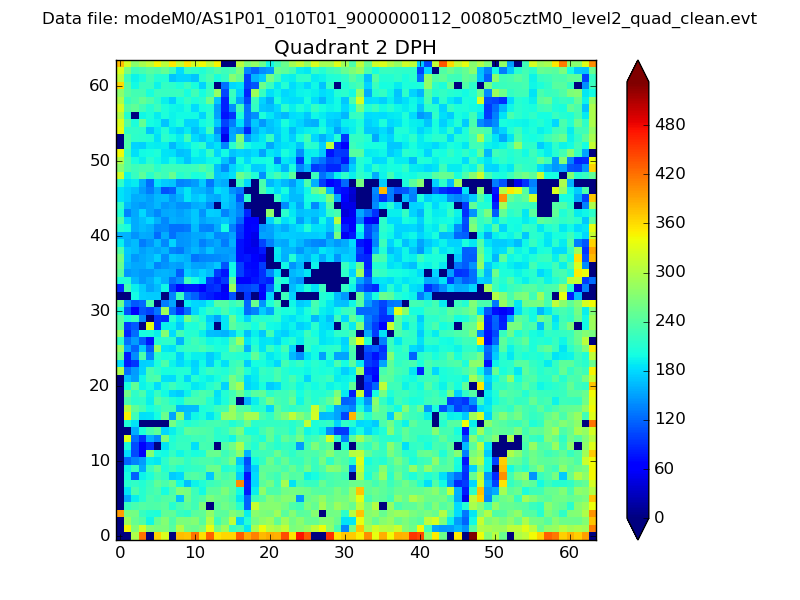
Histogram calculated using DETX and DETY for each event in the final _common_clean file
| Quadrant A | 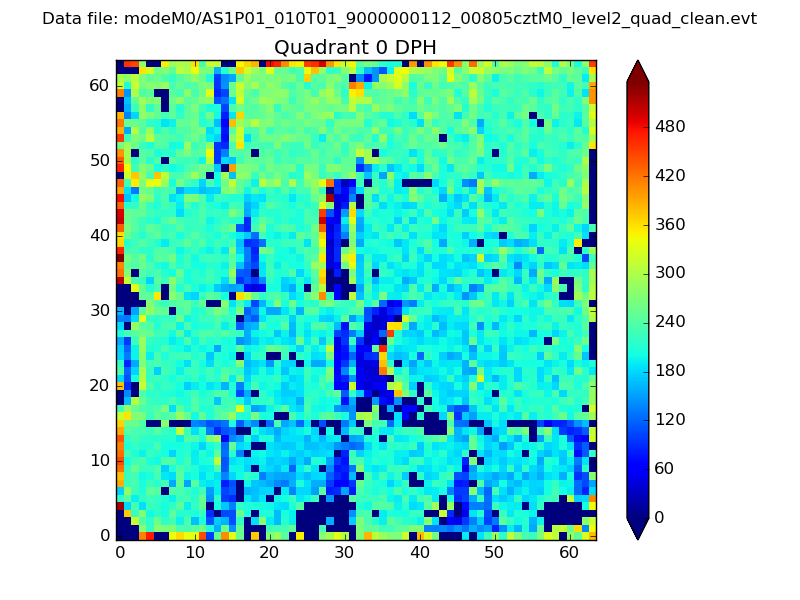 |
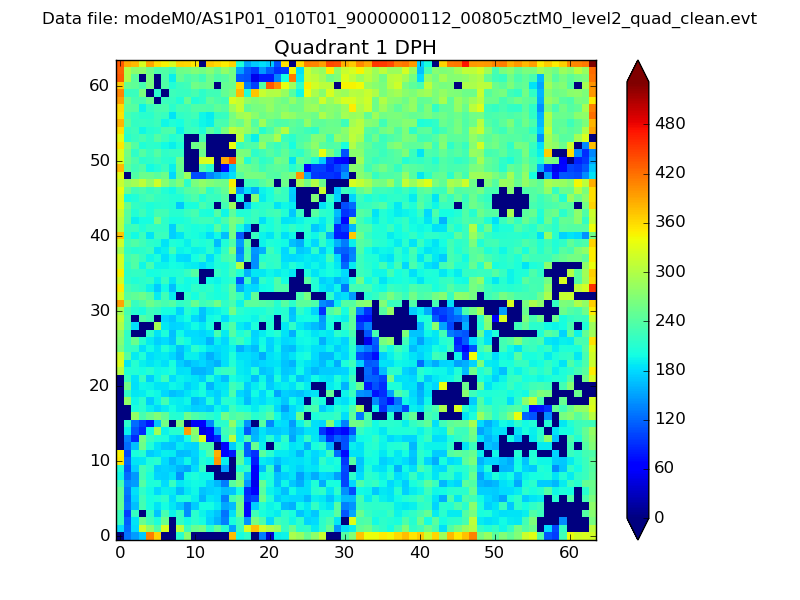 |
Quadrant B |
|---|---|---|---|
| Quadrant D | 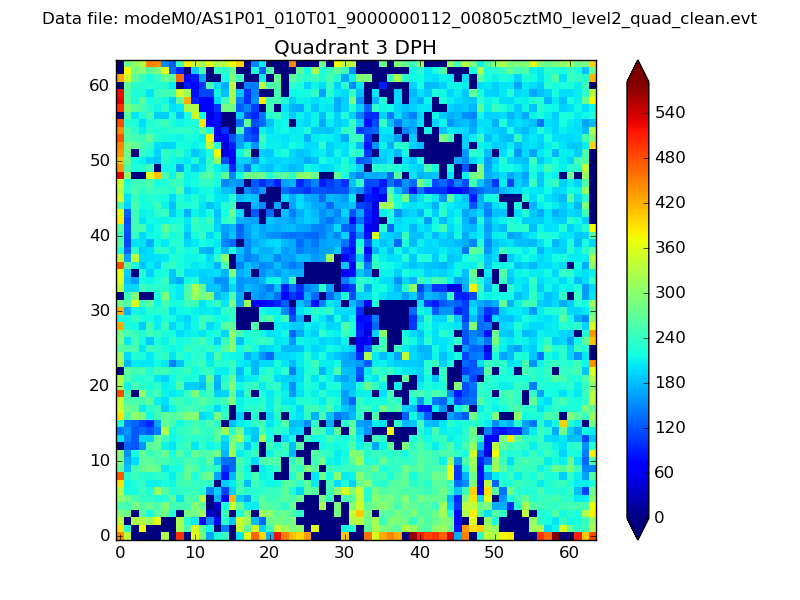 |
 |
Quadrant C |
| Plot type | Count rate plots | Images |
|---|---|---|
| Comparison with Poisson distribution Blue bars denote a histogram of data divided into 1 sec bins. Red curve is a Poisson curve with rate = median count rate of data. |
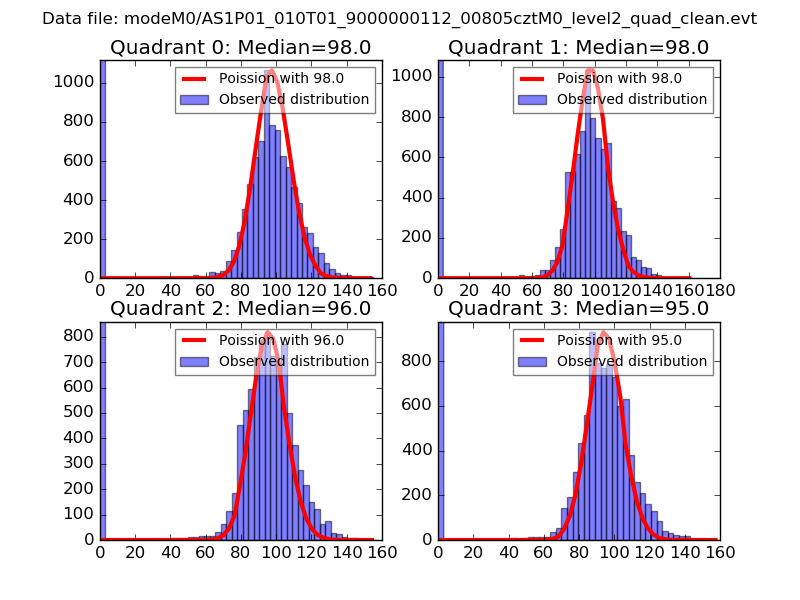 |
 |
| Quadrant-wise count rates Data is divided into 100 sec bins |
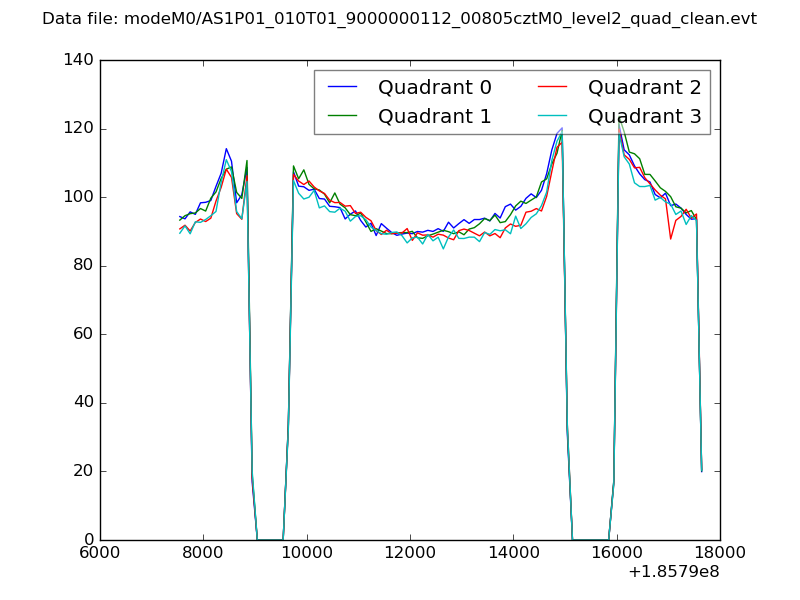 |
|
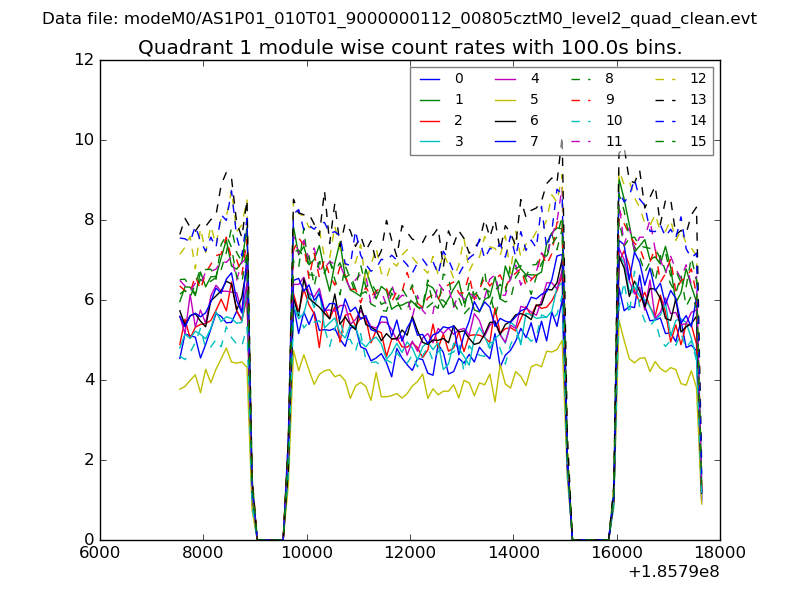
| Module-wise count rates for Quadrant A Data is divided into 100 sec bins |
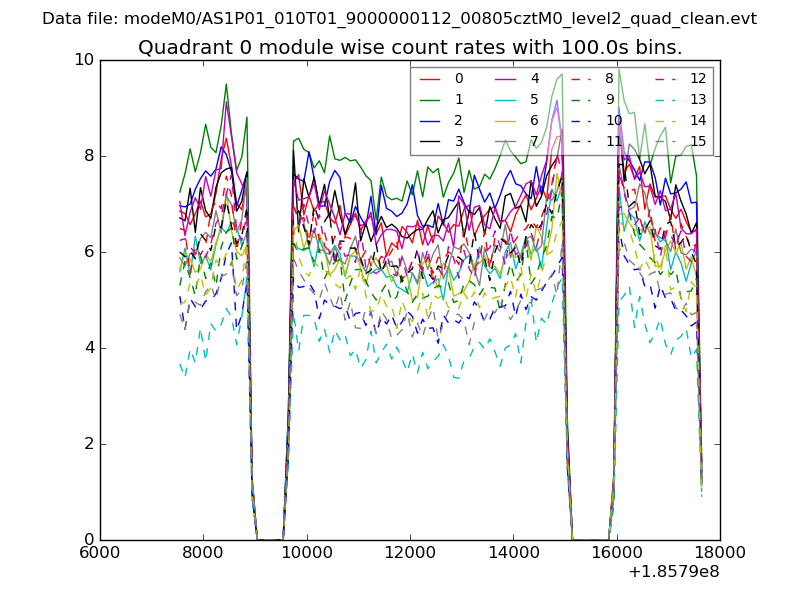 |
 |
| Module-wise count rates for Quadrant B Data is divided into 100 sec bins |
 |
 |
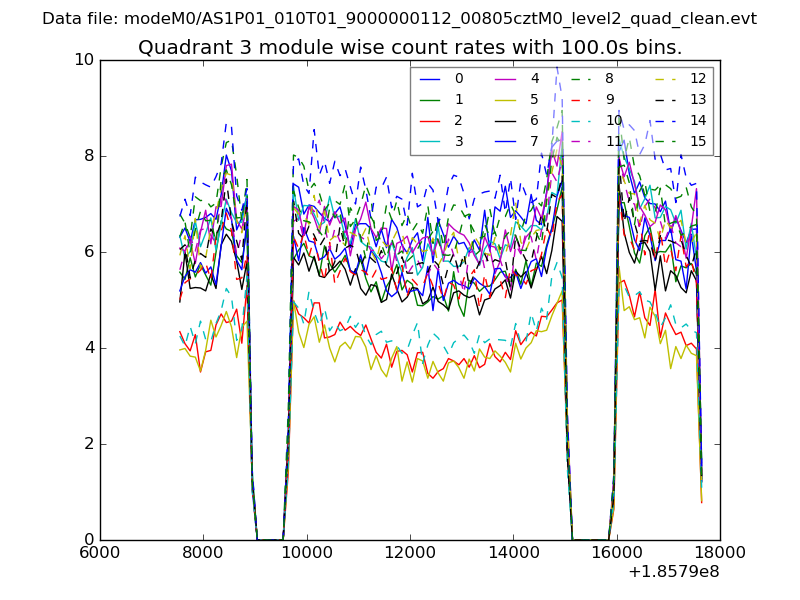
| Module-wise count rates for Quadrant C Data is divided into 100 sec bins |
 |
 |
| Module-wise count rates for Quadrant D Data is divided into 100 sec bins |
 |
 |
| Parameter | Plot |
|---|---|
| CZT HV Monitor | 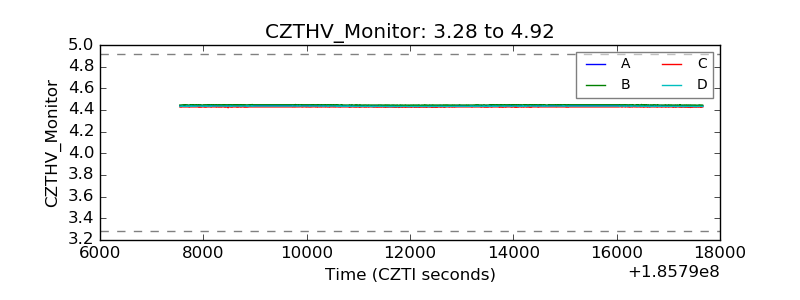 |
| D_VDD | 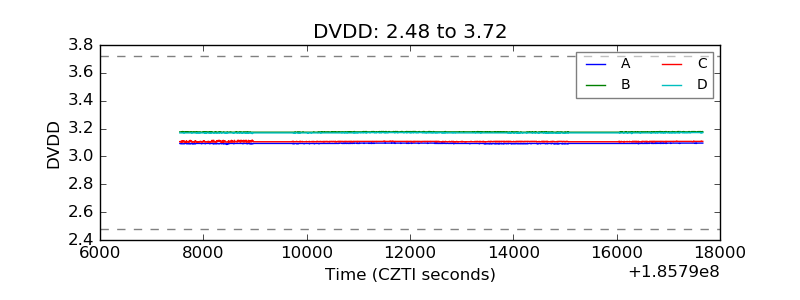 |
| Temperature 1 | 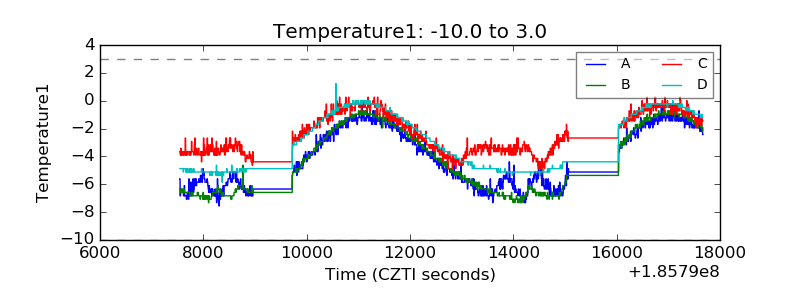 |
| Veto HV Monitor |  |
| Veto LLD | 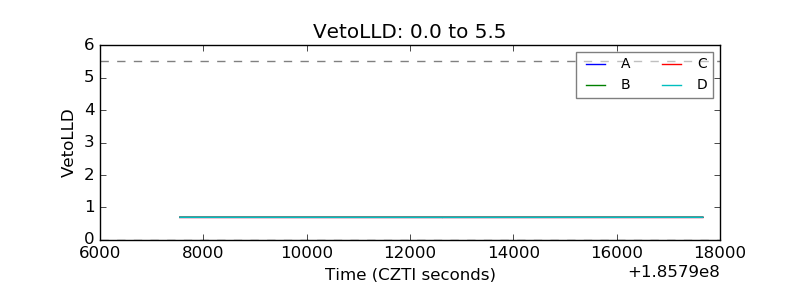 |
| Alpha Counter | 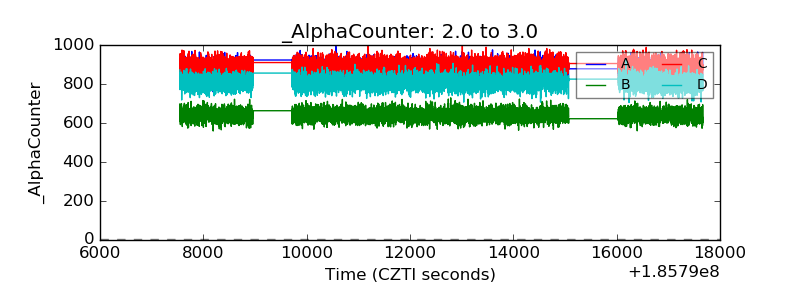 |
| _CPM_Rate | 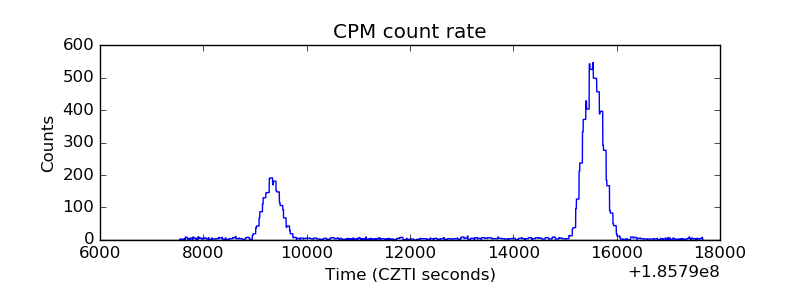 |
| CZT Counter | 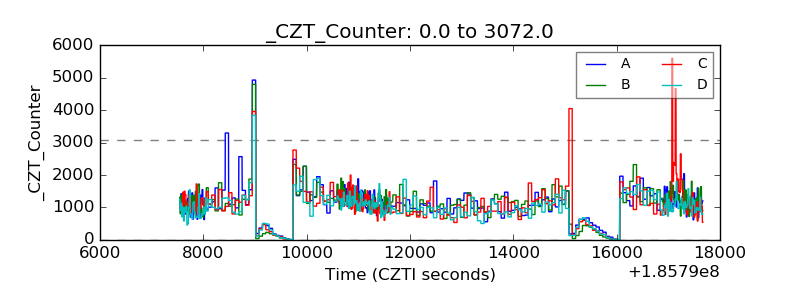 |
| +2.5 Volts monitor |  |
| +5 Volts monitor |  |
| _ROLL_ROT | 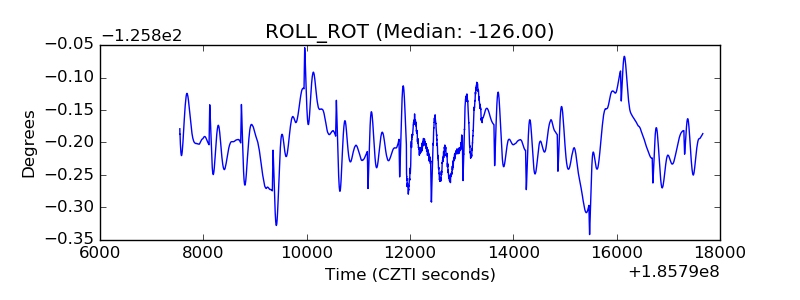 |
| _Roll_DEC | 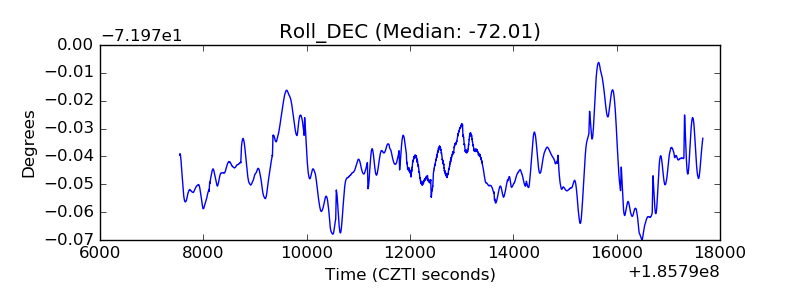 |
| _Roll_RA |  |
| Veto Counter | 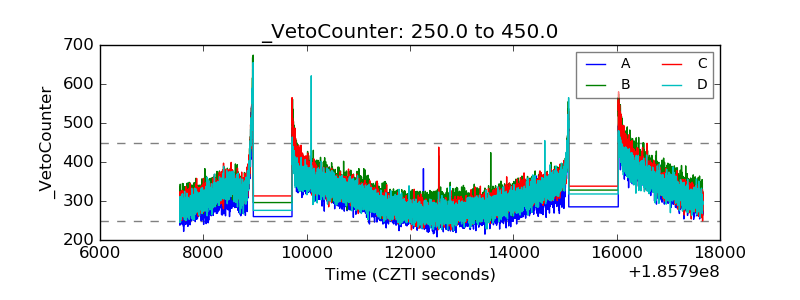 |