| Param | Original file | Final file |
|---|---|---|
| Filename | modeM0/AS1P01_010T01_9000000112_00807cztM0_level2.evt | modeM0/AS1P01_010T01_9000000112_00807cztM0_level2_quad_clean.evt |
| Size (bytes) | 942,220,800 | 93,427,200 |
| Size | 898.6 MB | 89.1 MB |
| Events in quadrant A | 7,111,743 | 610,985 |
| Events in quadrant B | 7,498,862 | 610,279 |
| Events in quadrant C | 6,959,142 | 593,865 |
| Events in quadrant D | 6,561,079 | 589,408 |
| Mode M9 | |||
|---|---|---|---|
| Quadrant | BADHDUFLAG | Total packets | Discarded packets |
| A | 0 | 11 | 0 |
| B | 0 | 11 | 0 |
| C | 0 | 11 | 0 |
| D | 0 | 11 | 0 |
| Mode M0 | |||
|---|---|---|---|
| Quadrant | BADHDUFLAG | Total packets | Discarded packets |
| A | 0 | 25460 | 0 |
| B | 0 | 26598 | 0 |
| C | 0 | 24977 | 0 |
| D | 0 | 23875 | 0 |
| Mode SS | |||
|---|---|---|---|
| Quadrant | BADHDUFLAG | Total packets | Discarded packets |
| A | 0 | 124 | 0 |
| B | 0 | 124 | 0 |
| C | 0 | 124 | 0 |
| D | 0 | 124 | 0 |
| Quadrant | Total seconds | Saturated seconds | Saturation percentage |
|---|---|---|---|
| A | 6084 | 20 | 0.328731% |
| B | 6084 | 24 | 0.394477% |
| C | 6084 | 29 | 0.476660% |
| D | 6084 | 31 | 0.509533% |
Noise dominated data is calculated using 1-second bins in cleaned event files. If a bin has >2000 counts, and if more than 50% of those come from <1% of pixels, then it is considered to be noise-dominated and hence unusable.
| Quadrant | # 1 sec bins | Bins with >0 counts | Bins with >2000 counts | High rate bins dominated by noise | Noise dominated (total time) | Noise dominated (detector-on time) | Marked lightcurve |
|---|---|---|---|---|---|---|---|
| A | 7169 | 6084 | 168 | 168 | 2.34% | 2.76% | 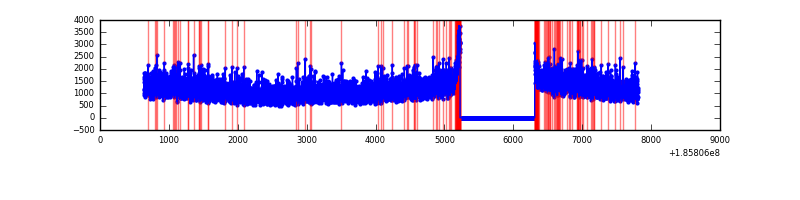 |
| B | 7169 | 6084 | 183 | 183 | 2.55% | 3.01% | 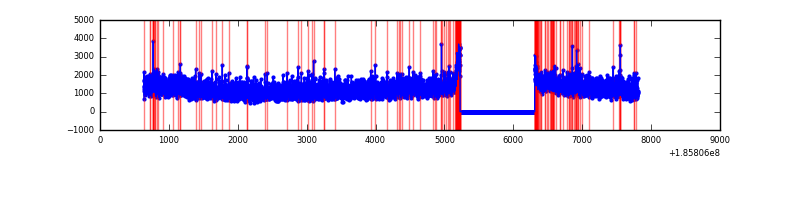 |
| C | 7169 | 6085 | 187 | 187 | 2.61% | 3.07% | 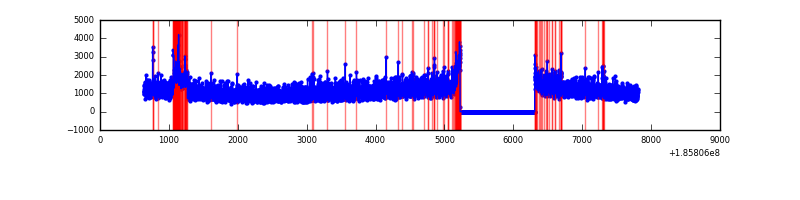 |
| D | 7169 | 6085 | 119 | 119 | 1.66% | 1.96% | 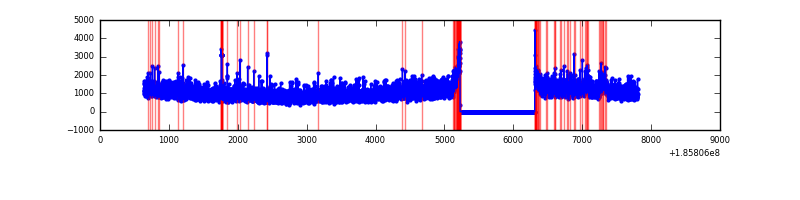 |
Top three noisy pixels from each quadrant. If the there are fewer than three noisy pixels in the level2.evt file, extra rows are filled as -1
| Pixel properties | Quadrant properties | ||||||
|---|---|---|---|---|---|---|---|
| Quadrant | DetID | PixID | Counts | Sigma | Mean | Median | Sigma |
| A | 0 | 214 | 46382 | 100.55 | 1835 | 1849 | 442.9 |
| A | 15 | 233 | 10411 | 19.33 | 1835 | 1849 | 442.9 |
| A | 15 | 17 | 9333 | 16.9 | 1835 | 1849 | 442.9 |
| B | 0 | 23 | 68235 | 146.71 | 1917 | 1927 | 452.0 |
| B | 0 | 220 | 51800 | 110.35 | 1917 | 1927 | 452.0 |
| B | 15 | 22 | 29895 | 61.88 | 1917 | 1927 | 452.0 |
| C | 9 | 52 | 166412 | 350.29 | 1694 | 1748 | 470.1 |
| C | 9 | 83 | 44975 | 91.96 | 1694 | 1748 | 470.1 |
| C | 15 | 241 | 36897 | 74.77 | 1694 | 1748 | 470.1 |
| D | 13 | 25 | 190783 | 370.82 | 1651 | 1709 | 509.9 |
| D | 1 | 4 | 59230 | 112.81 | 1651 | 1709 | 509.9 |
| D | 13 | 170 | 58523 | 111.43 | 1651 | 1709 | 509.9 |
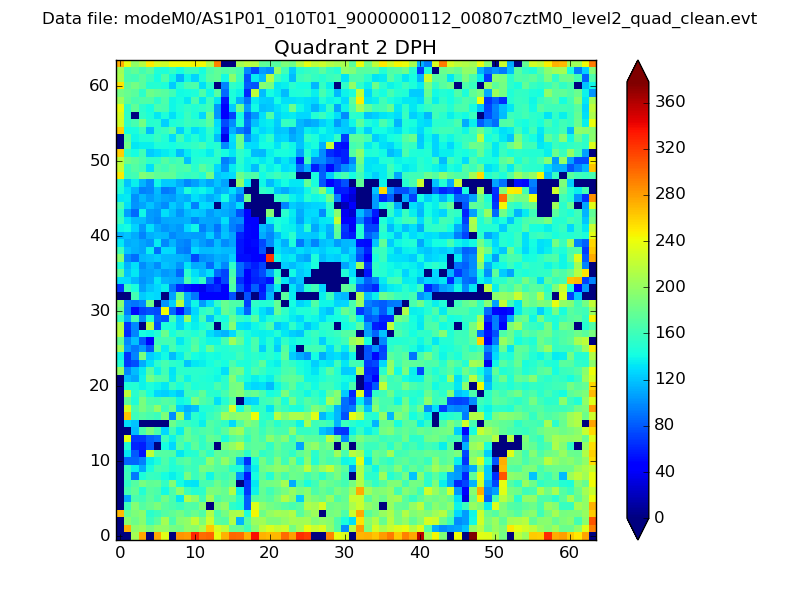
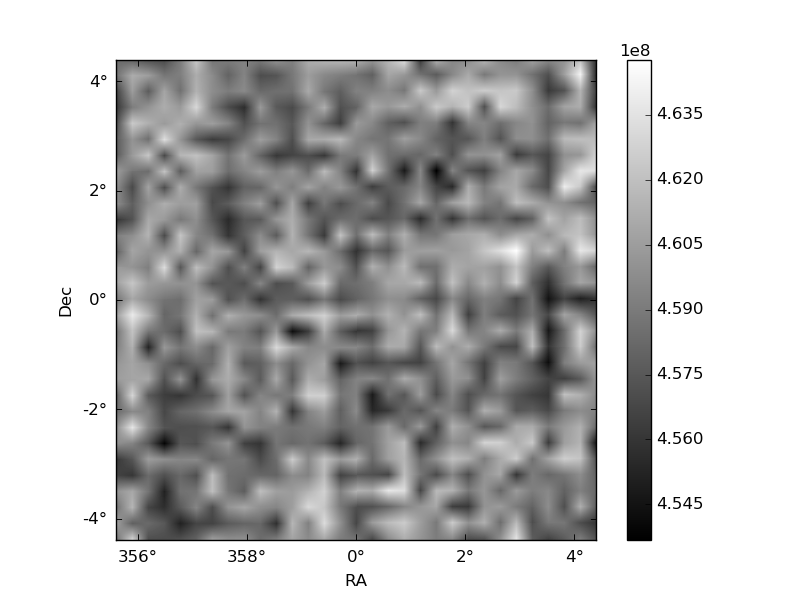
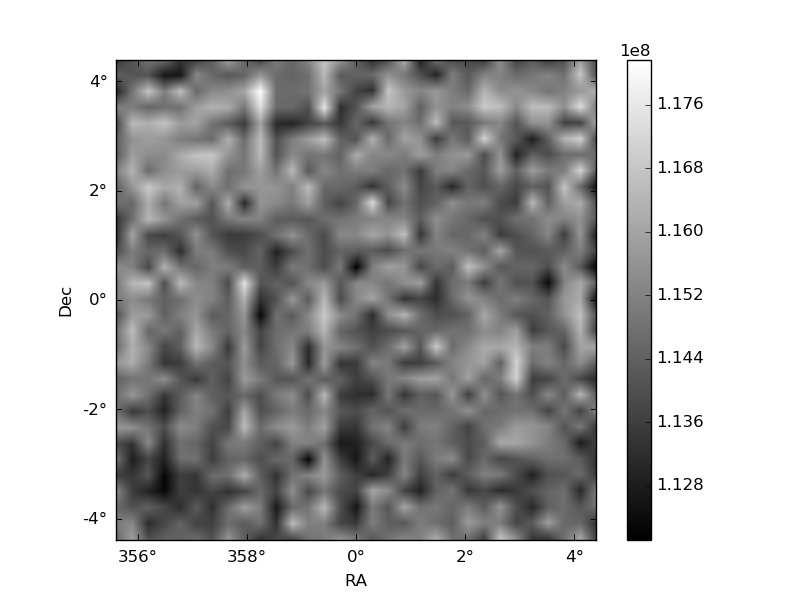
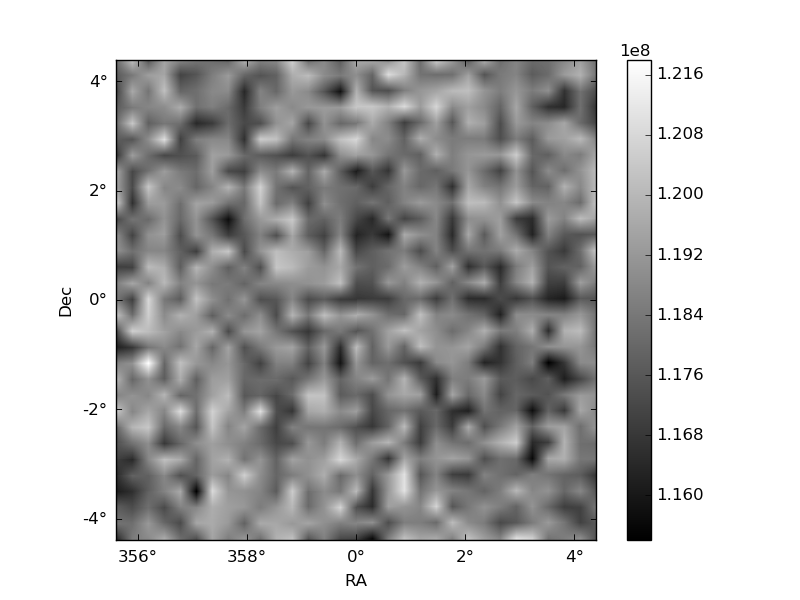
Histogram calculated using DETX and DETY for each event in the final _common_clean file
| Quadrant A | 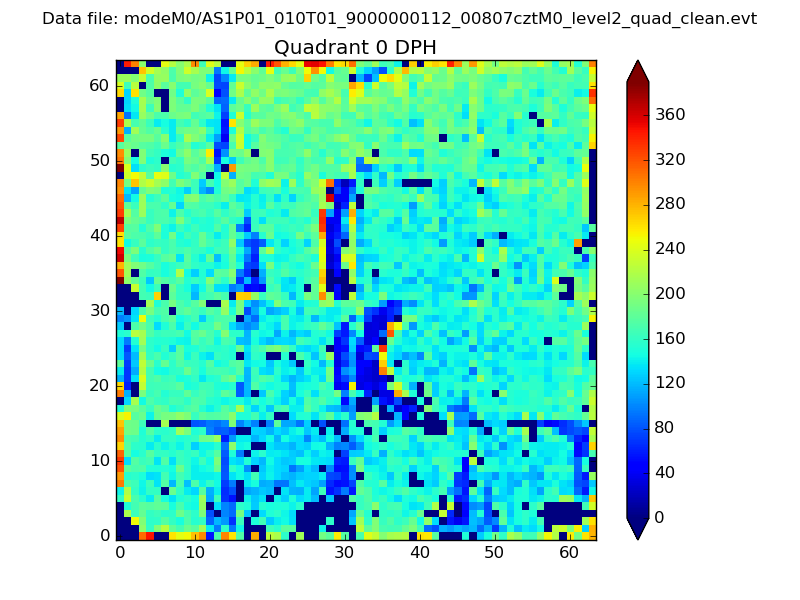 |
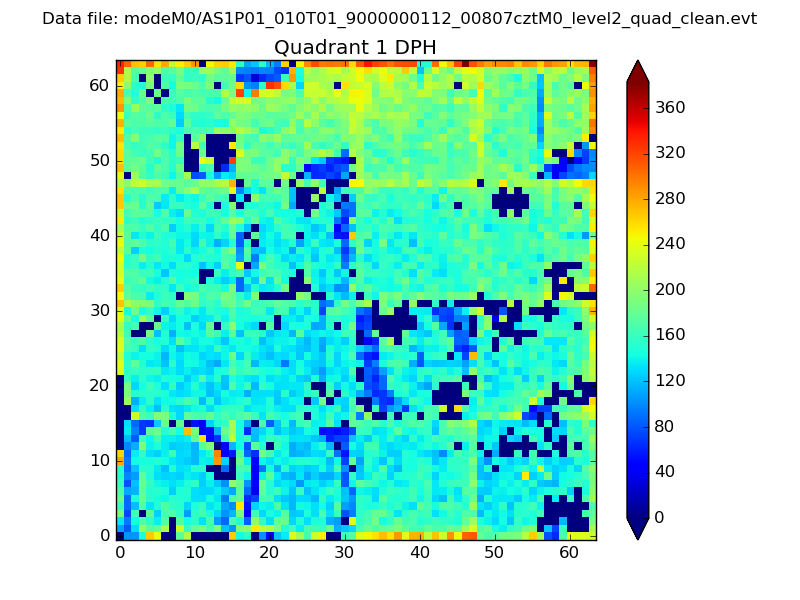 |
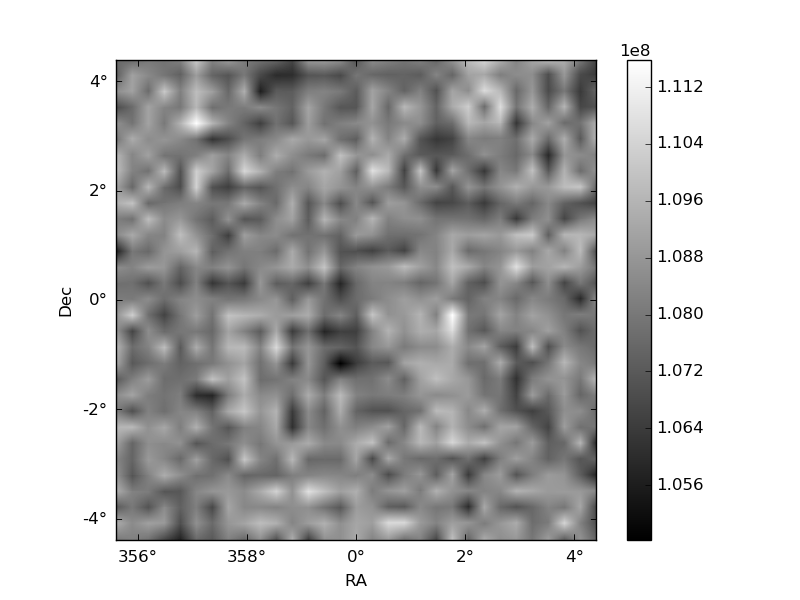
Quadrant B |
|---|---|---|---|
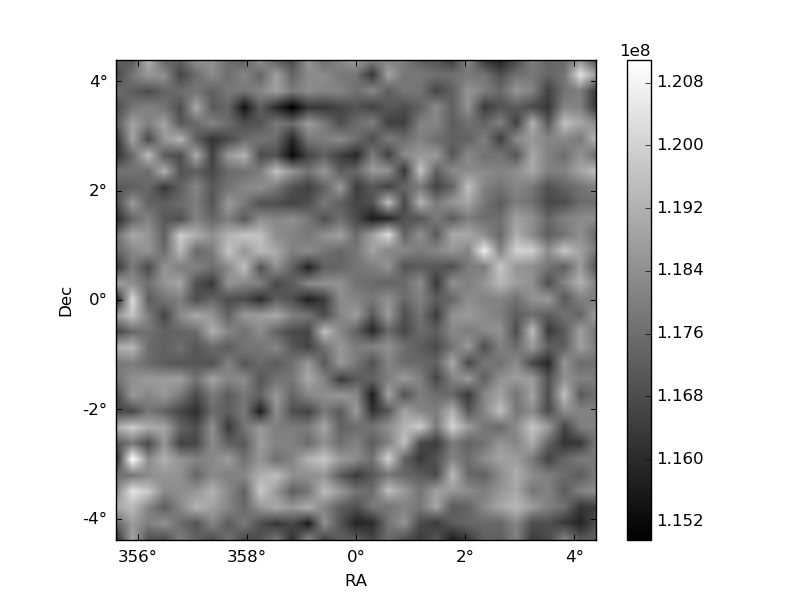
| Quadrant D | 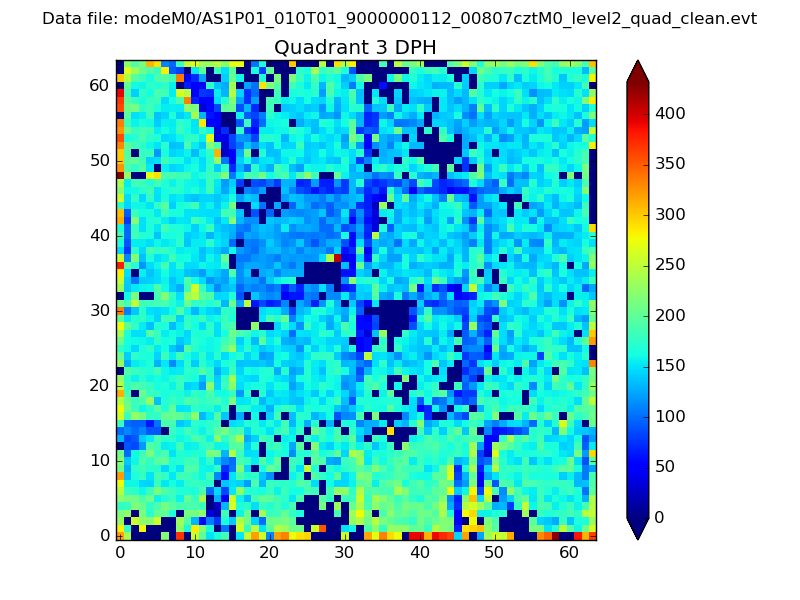 |
 |
Quadrant C |
| Plot type | Count rate plots | Images |
|---|---|---|
| Comparison with Poisson distribution Blue bars denote a histogram of data divided into 1 sec bins. Red curve is a Poisson curve with rate = median count rate of data. |
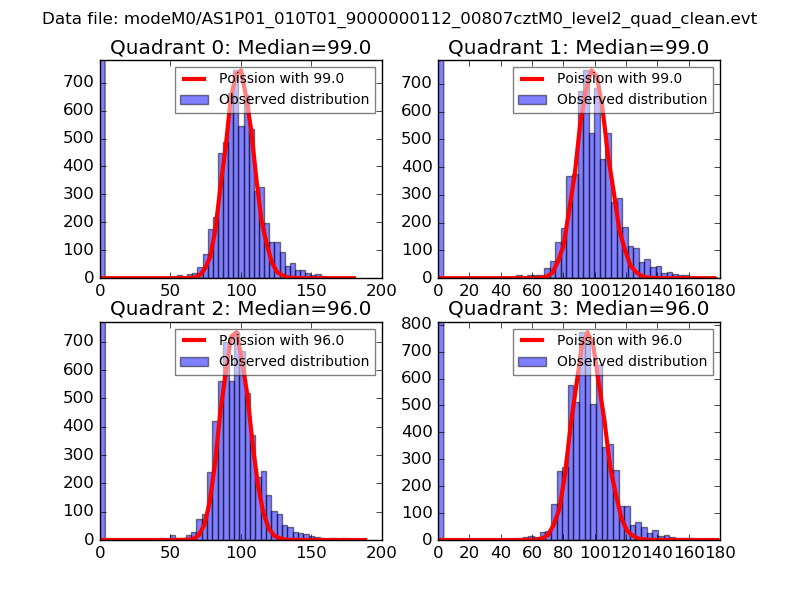 |
 |
| Quadrant-wise count rates Data is divided into 100 sec bins |
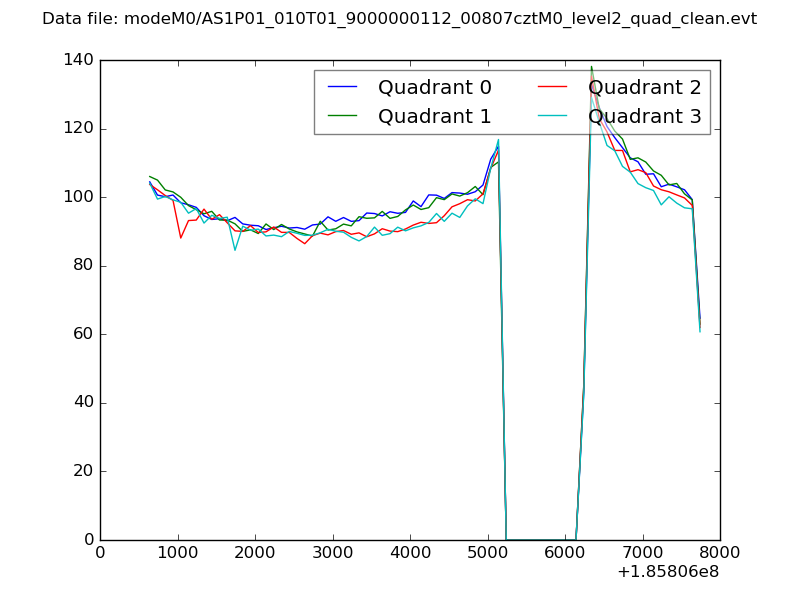 |
|
| Module-wise count rates for Quadrant A Data is divided into 100 sec bins |
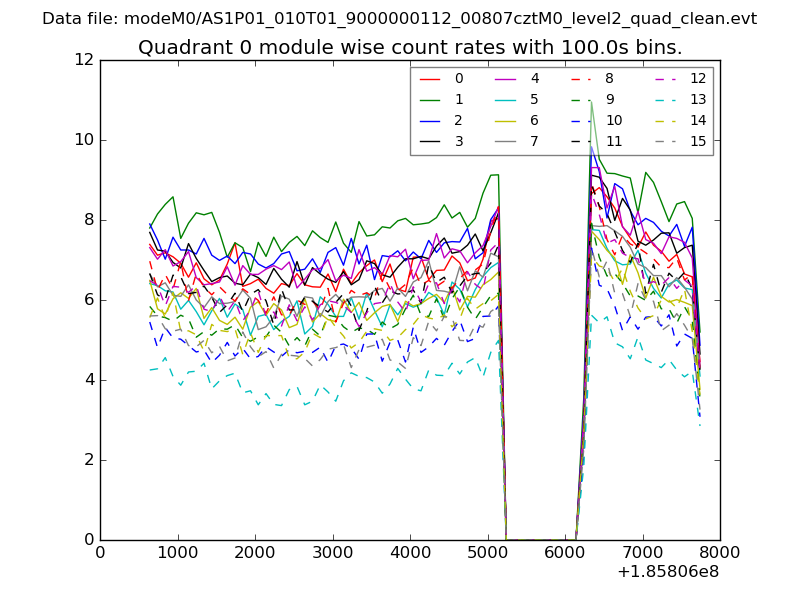 |
 |
| Module-wise count rates for Quadrant B Data is divided into 100 sec bins |
 |
 |
| Module-wise count rates for Quadrant C Data is divided into 100 sec bins |
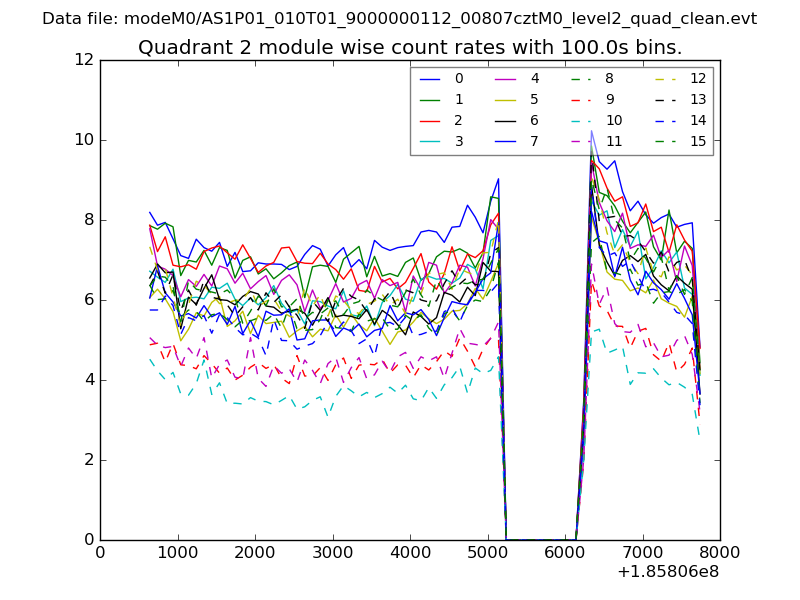 |
 |
| Module-wise count rates for Quadrant D Data is divided into 100 sec bins |
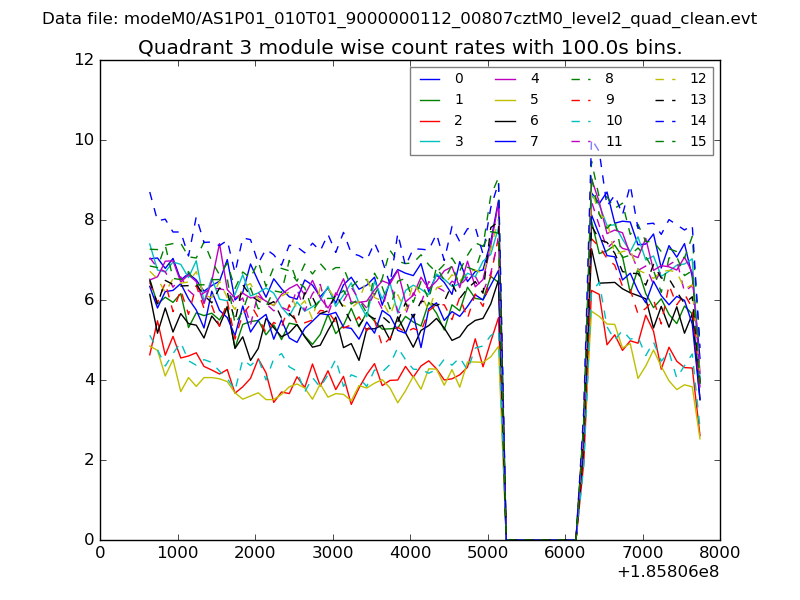 |
 |
| Parameter | Plot |
|---|---|
| CZT HV Monitor | 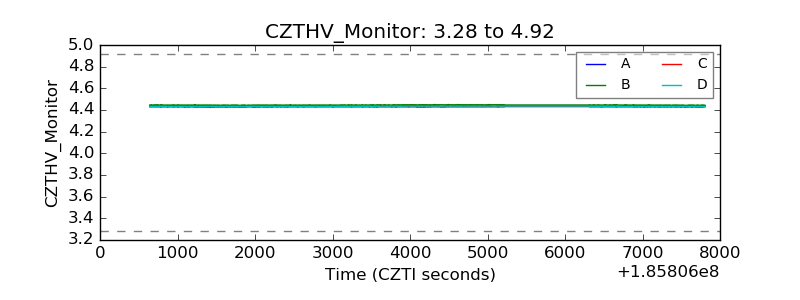 |
| D_VDD | 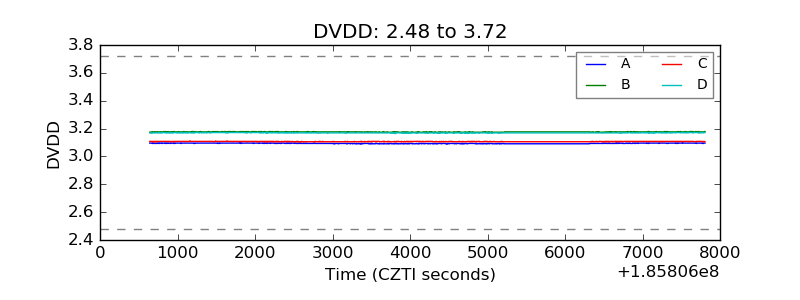 |
| Temperature 1 |  |
| Veto HV Monitor | 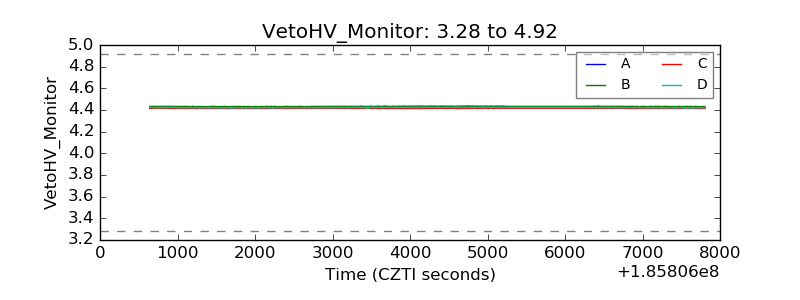 |
| Veto LLD | 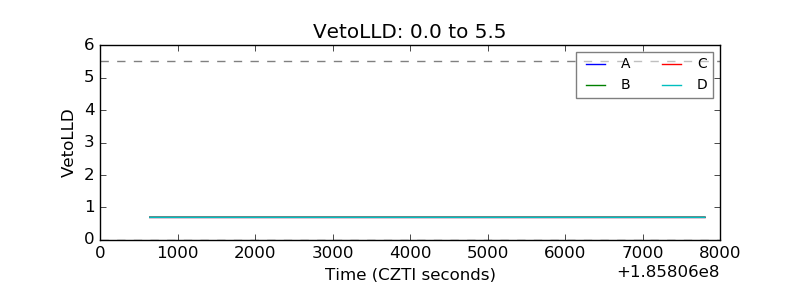 |
| Alpha Counter | 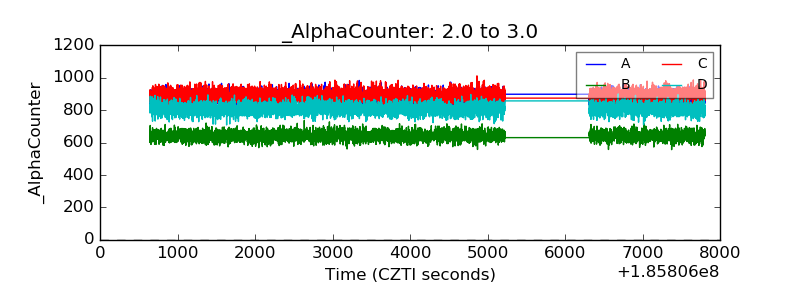 |
| _CPM_Rate | 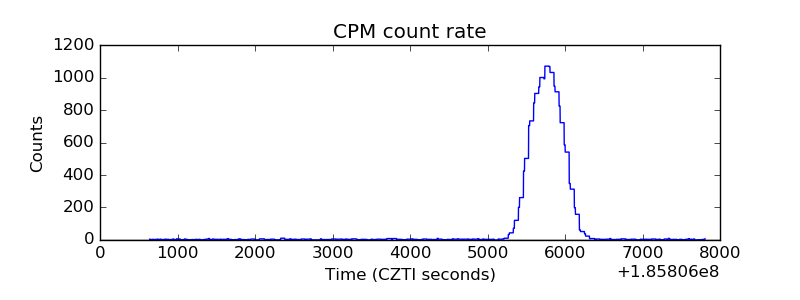 |
| CZT Counter | 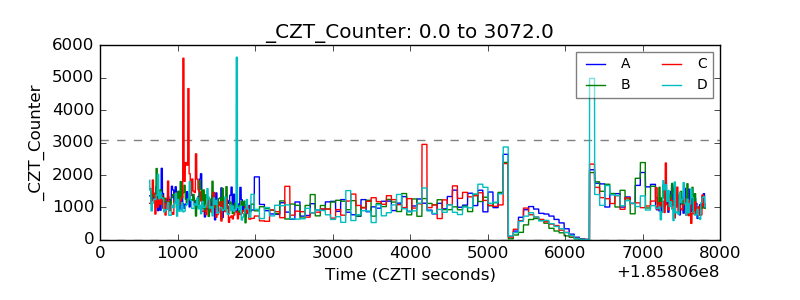 |
| +2.5 Volts monitor |  |
| +5 Volts monitor |  |
| _ROLL_ROT | 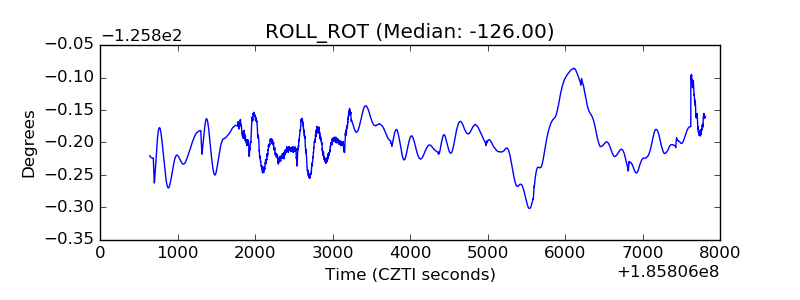 |
| _Roll_DEC |  |
| _Roll_RA | 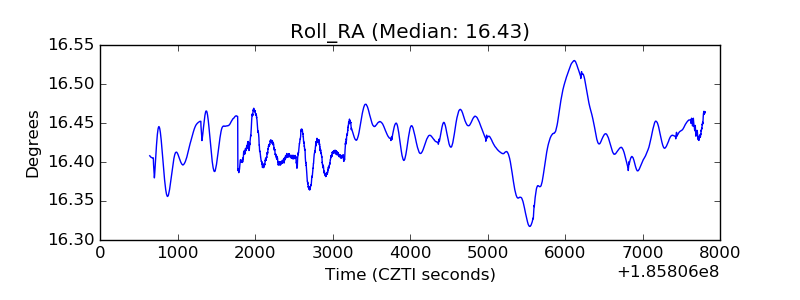 |
| Veto Counter | 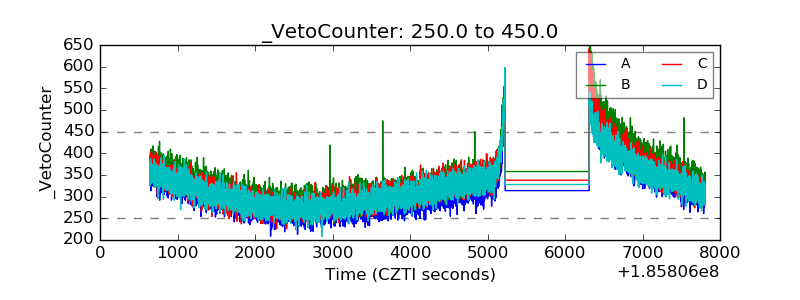 |