| Param | Original file | Final file |
|---|---|---|
| Filename | modeM0/AS1P01_010T01_9000000112_00808cztM0_level2.evt | modeM0/AS1P01_010T01_9000000112_00808cztM0_level2_quad_clean.evt |
| Size (bytes) | 975,611,520 | 99,132,480 |
| Size | 930.4 MB | 94.5 MB |
| Events in quadrant A | 7,384,588 | 653,540 |
| Events in quadrant B | 7,682,072 | 659,027 |
| Events in quadrant C | 6,989,853 | 633,695 |
| Events in quadrant D | 7,072,660 | 617,578 |
| Mode M9 | |||
|---|---|---|---|
| Quadrant | BADHDUFLAG | Total packets | Discarded packets |
| A | 0 | 12 | 0 |
| B | 0 | 12 | 0 |
| C | 0 | 12 | 0 |
| D | 0 | 12 | 0 |
| Mode M0 | |||
|---|---|---|---|
| Quadrant | BADHDUFLAG | Total packets | Discarded packets |
| A | 0 | 26422 | 0 |
| B | 0 | 27331 | 0 |
| C | 0 | 25299 | 0 |
| D | 0 | 25513 | 0 |
| Mode SS | |||
|---|---|---|---|
| Quadrant | BADHDUFLAG | Total packets | Discarded packets |
| A | 0 | 126 | 0 |
| B | 0 | 126 | 0 |
| C | 0 | 126 | 0 |
| D | 0 | 126 | 0 |
| Quadrant | Total seconds | Saturated seconds | Saturation percentage |
|---|---|---|---|
| A | 6287 | 41 | 0.652139% |
| B | 6287 | 25 | 0.397646% |
| C | 6287 | 19 | 0.302211% |
| D | 6287 | 78 | 1.240655% |
Noise dominated data is calculated using 1-second bins in cleaned event files. If a bin has >2000 counts, and if more than 50% of those come from <1% of pixels, then it is considered to be noise-dominated and hence unusable.
| Quadrant | # 1 sec bins | Bins with >0 counts | Bins with >2000 counts | High rate bins dominated by noise | Noise dominated (total time) | Noise dominated (detector-on time) | Marked lightcurve |
|---|---|---|---|---|---|---|---|
| A | 7457 | 6288 | 219 | 219 | 2.94% | 3.48% | 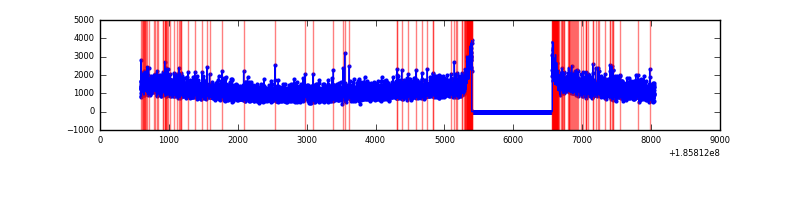 |
| B | 7457 | 6288 | 190 | 190 | 2.55% | 3.02% | 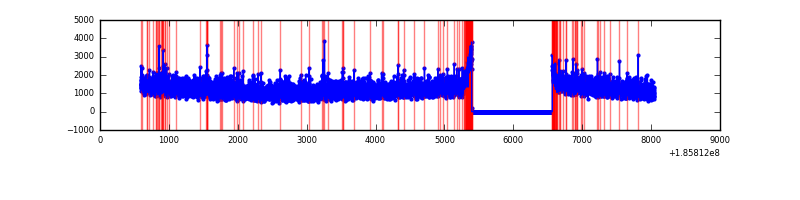 |
| C | 7457 | 6288 | 127 | 127 | 1.70% | 2.02% | 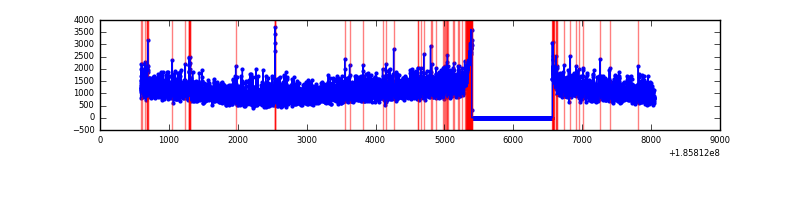 |
| D | 7457 | 6288 | 231 | 231 | 3.10% | 3.67% | 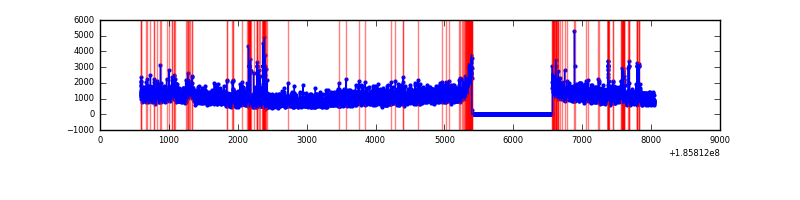 |
Top three noisy pixels from each quadrant. If the there are fewer than three noisy pixels in the level2.evt file, extra rows are filled as -1
| Pixel properties | Quadrant properties | ||||||
|---|---|---|---|---|---|---|---|
| Quadrant | DetID | PixID | Counts | Sigma | Mean | Median | Sigma |
| A | 15 | 233 | 52657 | 110.96 | 1904 | 1919 | 457.3 |
| A | 15 | 17 | 11511 | 20.98 | 1904 | 1919 | 457.3 |
| A | 13 | 17 | 10136 | 17.97 | 1904 | 1919 | 457.3 |
| B | 0 | 23 | 65270 | 135.75 | 1987 | 1997 | 466.1 |
| B | 0 | 245 | 19228 | 36.97 | 1987 | 1997 | 466.1 |
| B | 5 | 176 | 14974 | 27.84 | 1987 | 1997 | 466.1 |
| C | 15 | 241 | 33066 | 64.19 | 1754 | 1811 | 486.9 |
| C | 3 | 111 | 30473 | 58.86 | 1754 | 1811 | 486.9 |
| C | 3 | 79 | 26954 | 51.64 | 1754 | 1811 | 486.9 |
| D | 13 | 25 | 293417 | 554.4 | 1708 | 1771 | 526.1 |
| D | 2 | 16 | 86929 | 161.88 | 1708 | 1771 | 526.1 |
| D | 1 | 4 | 74255 | 137.79 | 1708 | 1771 | 526.1 |
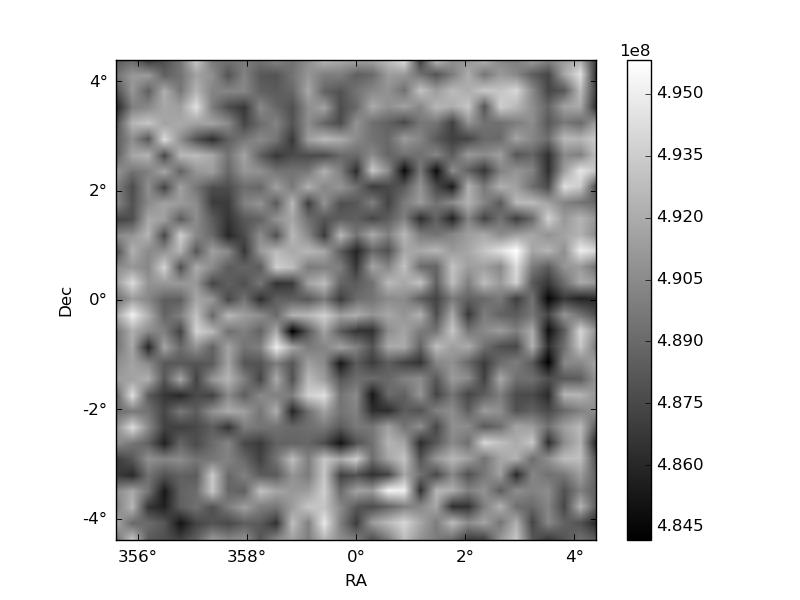
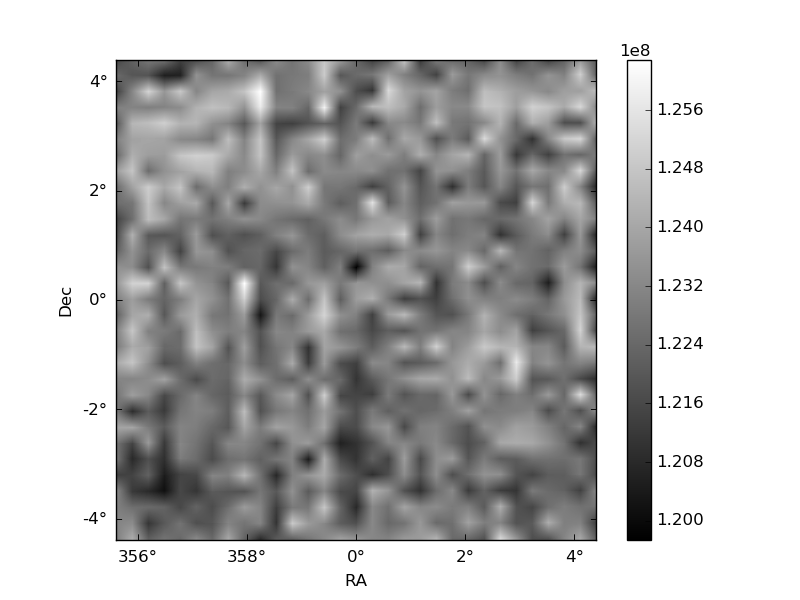
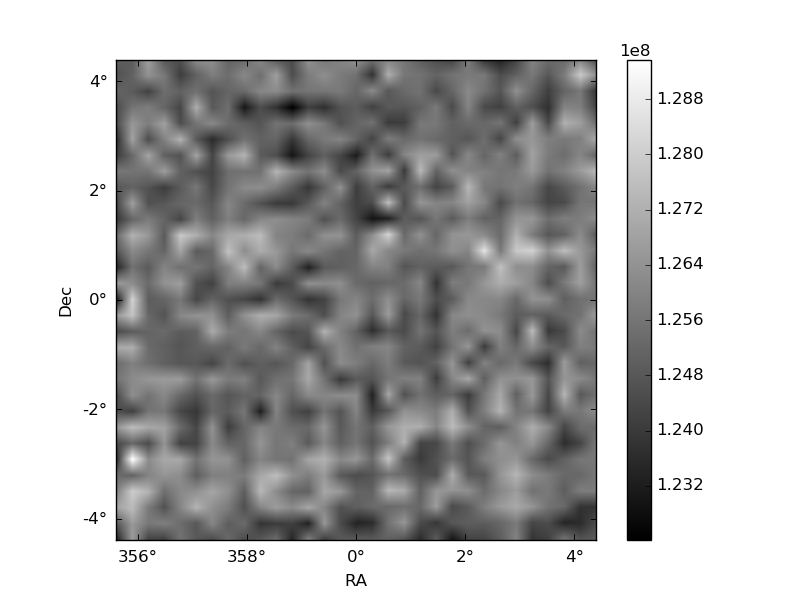
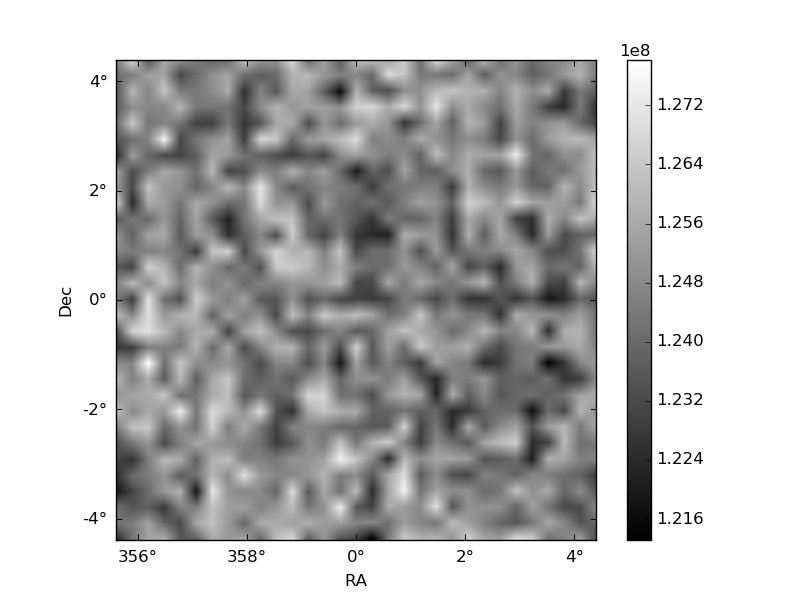
Histogram calculated using DETX and DETY for each event in the final _common_clean file
| Quadrant A | 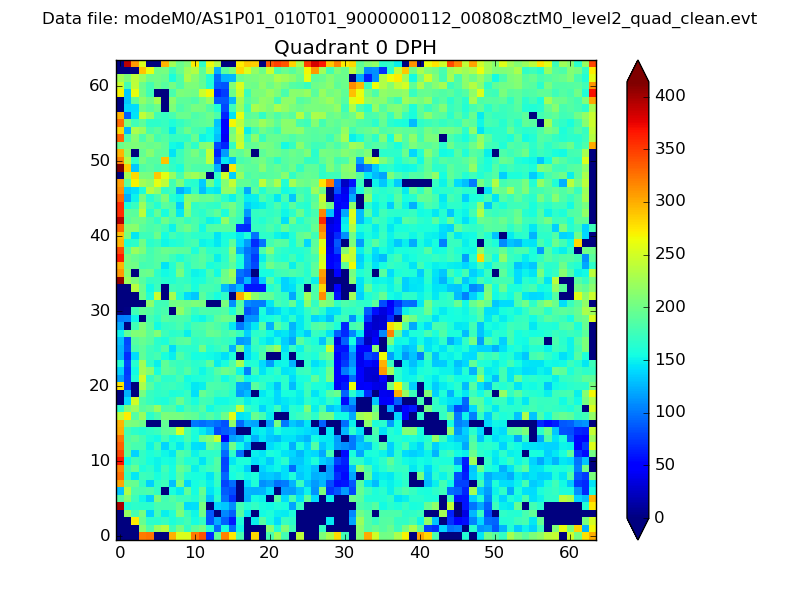 |
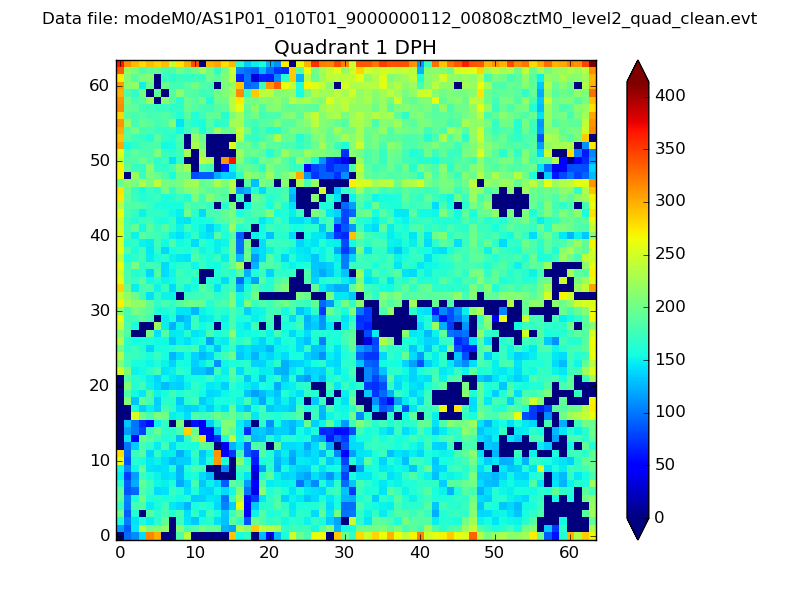 |
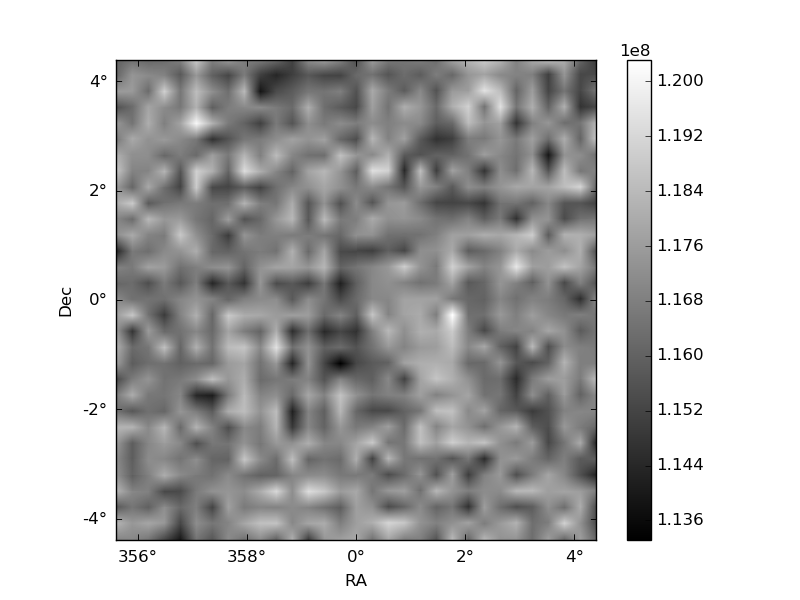
Quadrant B |
|---|---|---|---|
| Quadrant D | 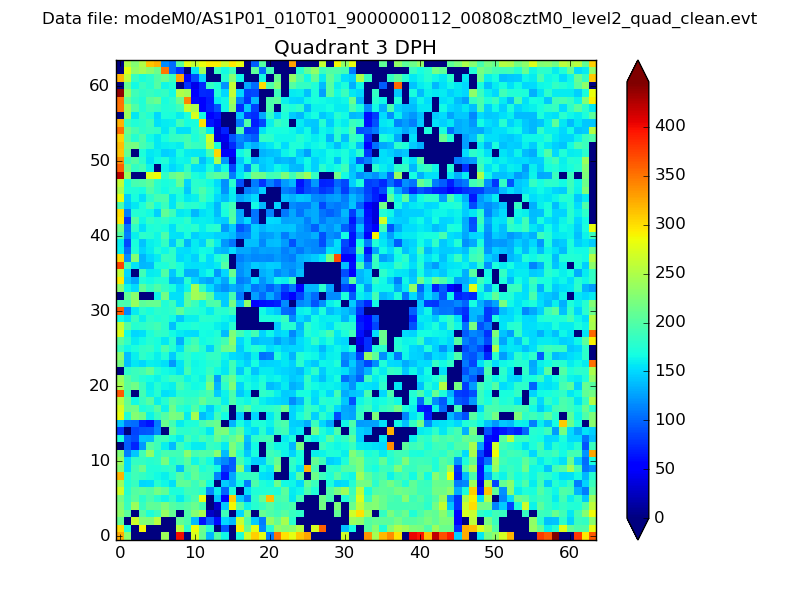 |
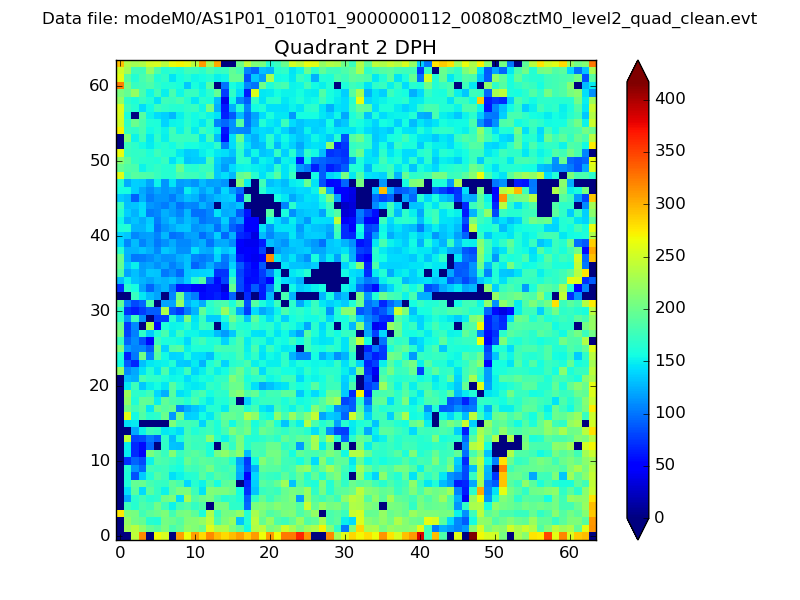 |
Quadrant C |
| Plot type | Count rate plots | Images |
|---|---|---|
| Comparison with Poisson distribution Blue bars denote a histogram of data divided into 1 sec bins. Red curve is a Poisson curve with rate = median count rate of data. |
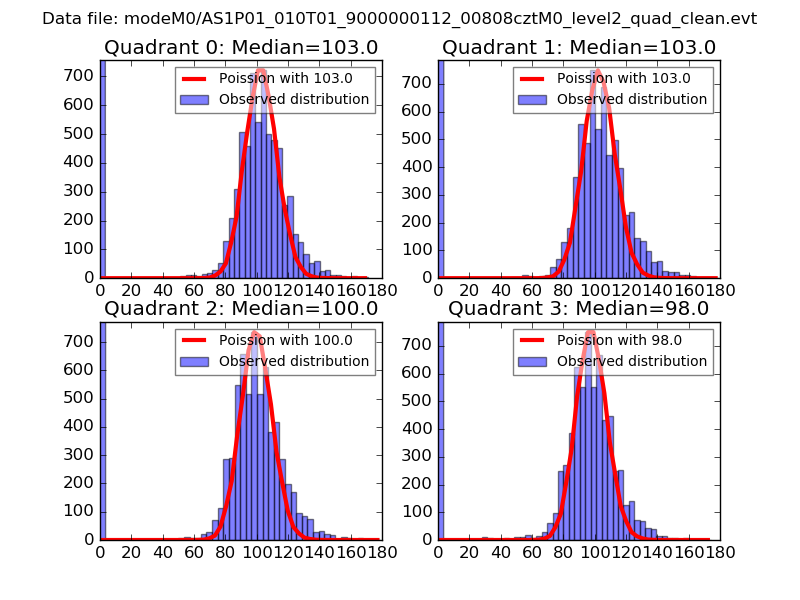 |
 |
| Quadrant-wise count rates Data is divided into 100 sec bins |
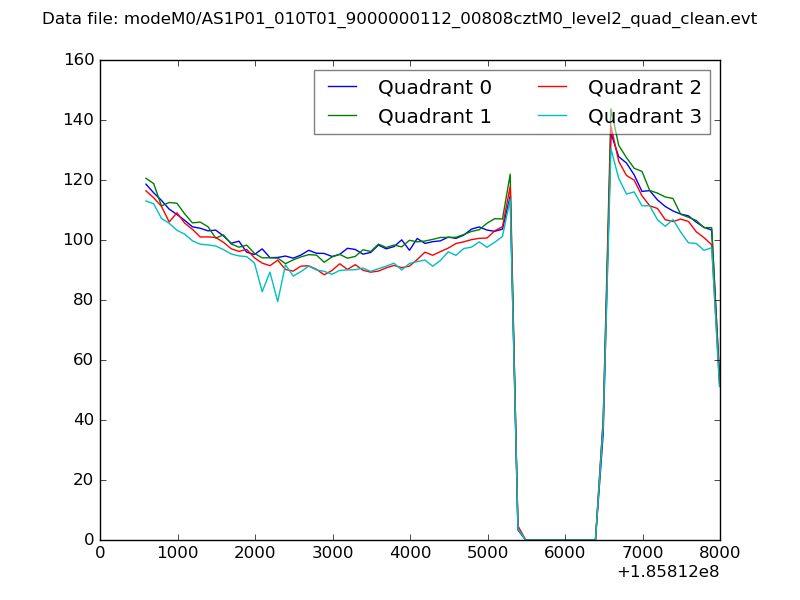 |
|
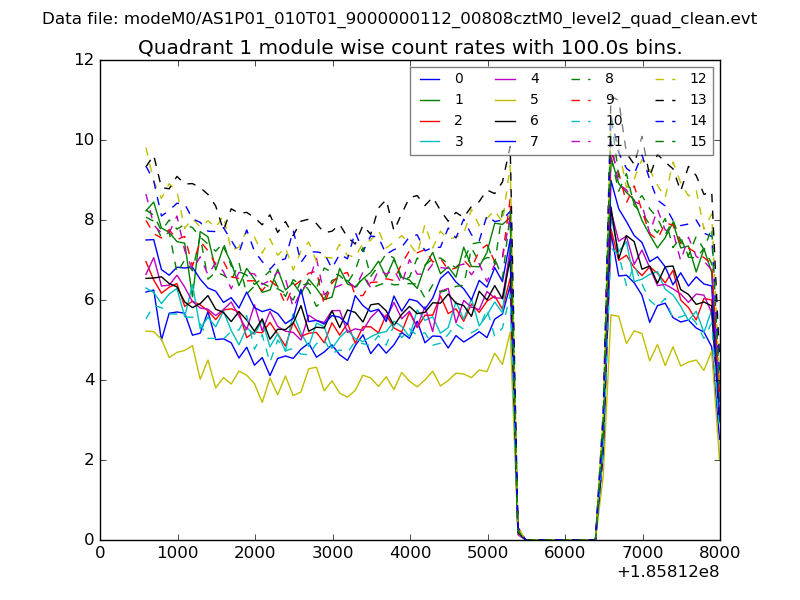
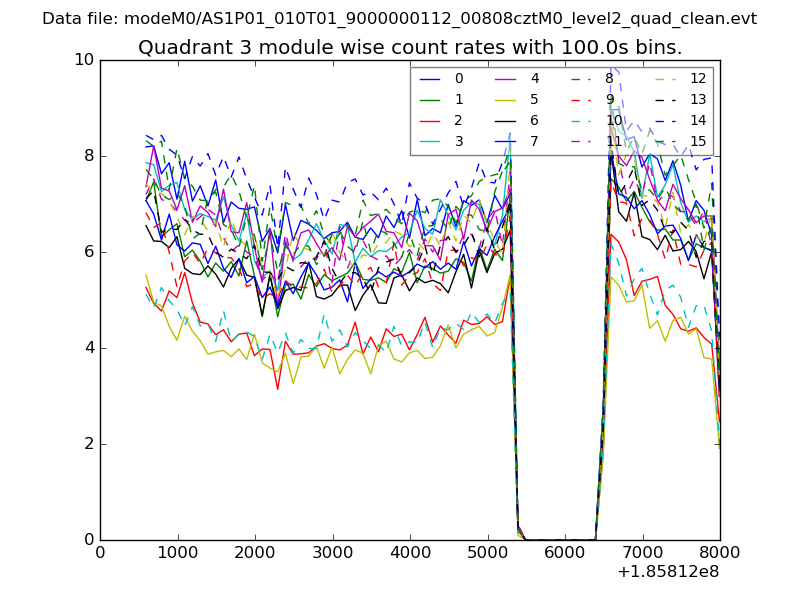
| Module-wise count rates for Quadrant A Data is divided into 100 sec bins |
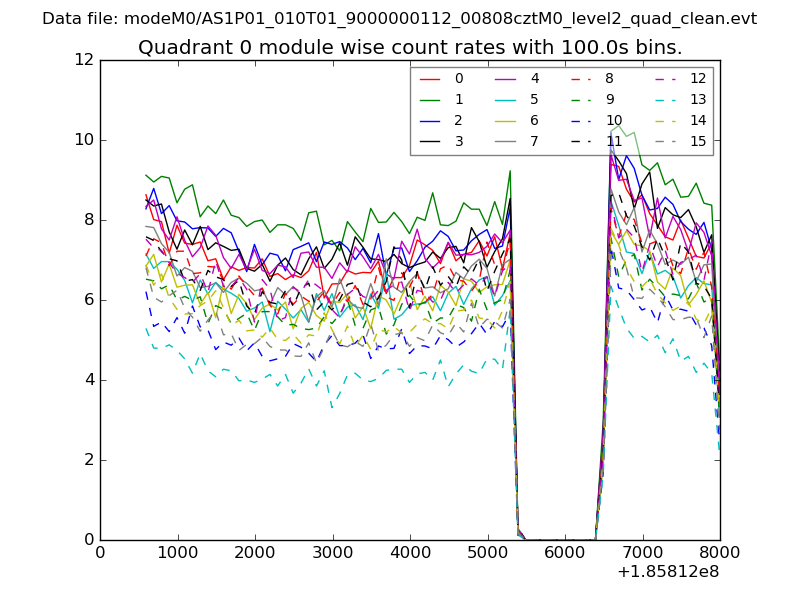 |
 |
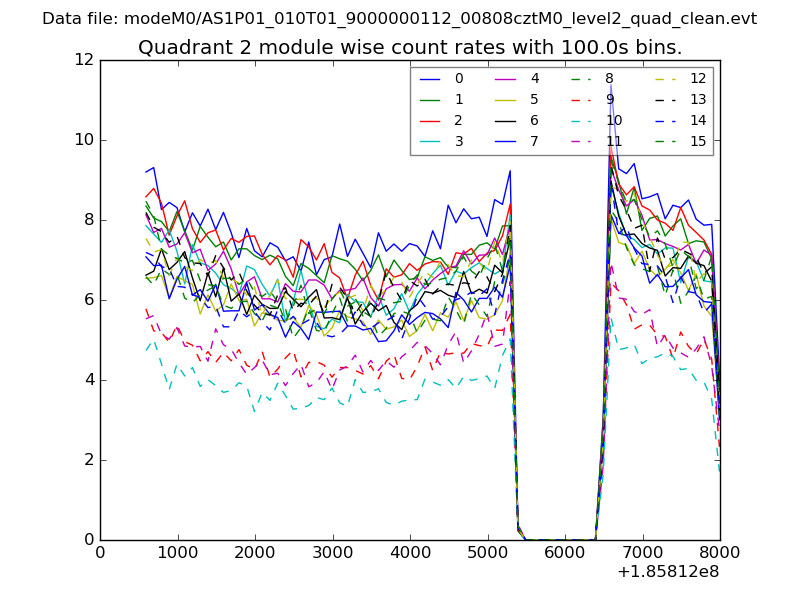
| Module-wise count rates for Quadrant B Data is divided into 100 sec bins |
 |
 |
| Module-wise count rates for Quadrant C Data is divided into 100 sec bins |
 |
 |
| Module-wise count rates for Quadrant D Data is divided into 100 sec bins |
 |
 |
| Parameter | Plot |
|---|---|
| CZT HV Monitor | 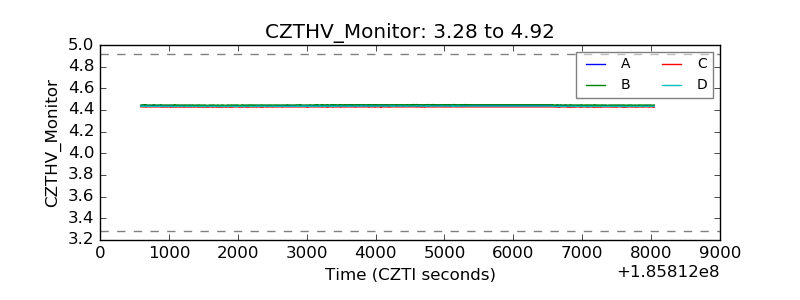 |
| D_VDD | 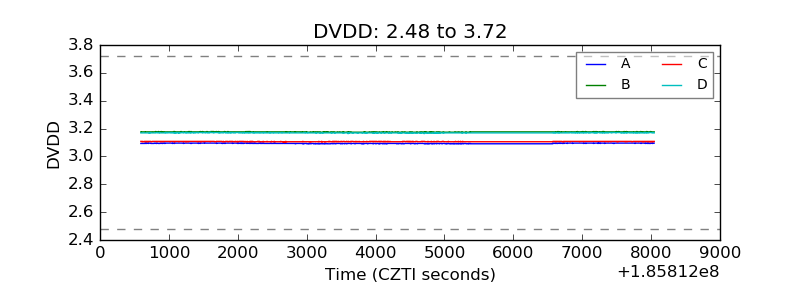 |
| Temperature 1 |  |
| Veto HV Monitor | 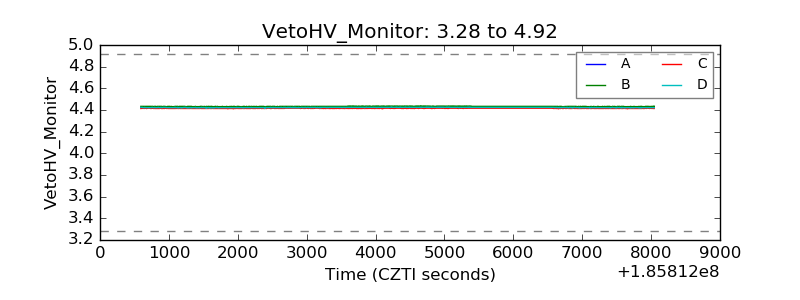 |
| Veto LLD |  |
| Alpha Counter | 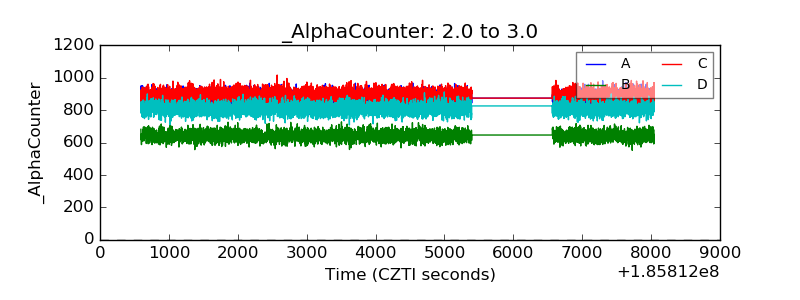 |
| _CPM_Rate | 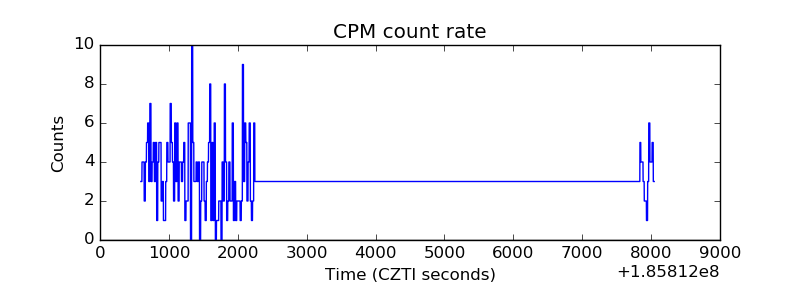 |
| CZT Counter | 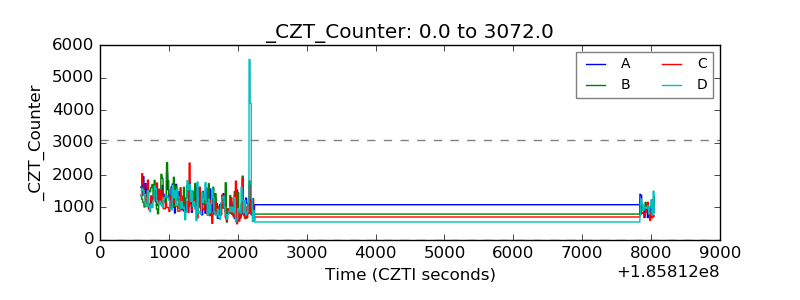 |
| +2.5 Volts monitor |  |
| +5 Volts monitor | 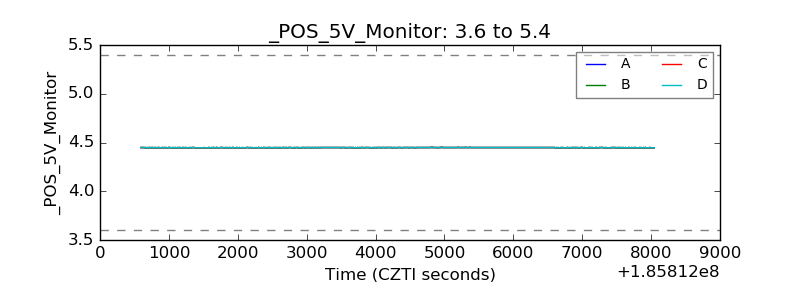 |
| _ROLL_ROT | 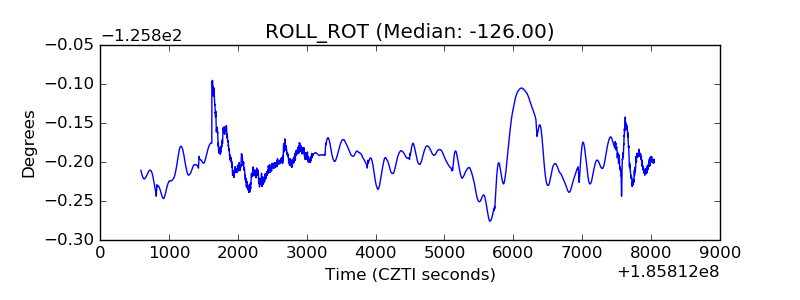 |
| _Roll_DEC | 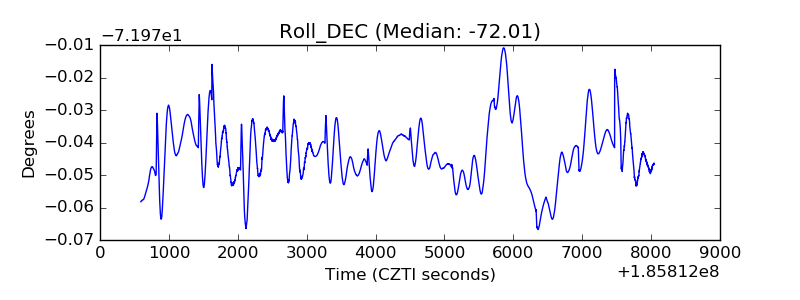 |
| _Roll_RA | 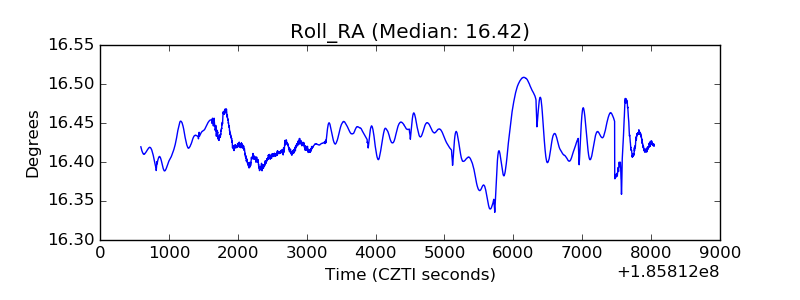 |
| Veto Counter | 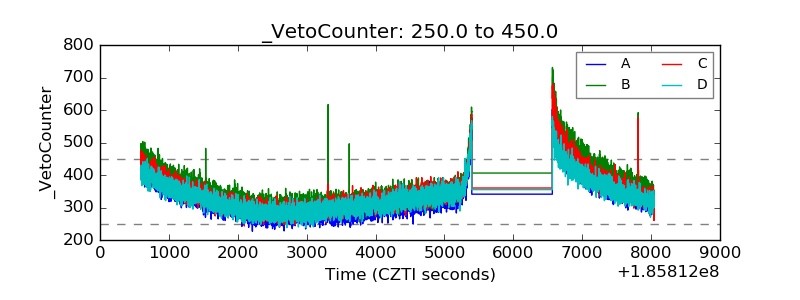 |